Technical Brief Workflows for automated downstream data analysis and visualization in large-scale computational mass spectrometry Stephan Aiche1,*, Timo Sachsenberg2, Erhan Kenar3, Mathias Walzer2, Bernd Wiswedel4, Theresa Kristl5, Matthew Boyles6, Albert Duschl6, Christian G. Huber5, Michael R. Berthold7, Knut Reinert1, and Oliver Kohlbacher2 1
Department of Mathematics and Computer Science, Freie Universitaet Berlin,
Germany 2
Applied Bioinformatics, Center for Bioinformatics, Quantitative Biology Center, and
Dept. of Computer Science, University of Tübingen, Germany 3
Quantitative Biology Center (QBiC), University of Tübingen, Germany
4
KNIME.com AG, Zurich, 8005, Switzerland
5
Division of Chemistry and Bioanalytics, Department of Molecular Biology, University of Salzburg, Austria 6 Division of Allergy and Immunology, Department of Molecular Biology, University of Salzburg, Austria 7 Chair for Bioinformatics and Information Mining, Department of Computer and Information Science, University of Konstanz, Germany *Corresponding Author: Stephan Aiche, Takustr. 9, 14195 Berlin, Germany, tel.: +49 30 838 75137, fax: +49 30 838 75218, email:
[email protected] Abbreviations KNIME - Konstanz Information Miner LC-MS - Liquid chromatography coupled to mass spectrometry LC-MS/MS - Liquid chromatography coupled to tandem mass spectrometry TMT - Tandem mass tags TOPP - The OpenMS Proteomics Pipeline TOPPAS - The OpenMS Proteomics Pipeline Assistant UPLC - Ultra performance liquid chromatography
Keywords: Proteomics, Metabolomics, Workflows, KNIME, OpenMS Word count: 2316
Abstract Mass spectrometry-based proteomics and metabolomics are rapidly evolving research fields driven by the development of novel instruments, experimental approaches, and analysis methods. Monolithic analysis tools perform well on single tasks but lack the flexibility to cope with the constantly changing requirements and experimental setups. Workflow systems, which combine small processing tools into complex analysis pipelines, allow custom-tailored and flexible data processing workflows that can be published or shared with collaborators. In this article, we present the integration of established tools for computational mass spectrometry from the open-source software framework OpenMS into the workflow engine KNIME for the analysis of large data sets and production of high quality visualizations. We provide example workflows to demonstrate combined data processing and visualization for three diverse tasks in computational mass spectrometry: isobaric mass tag based quantitation in complex experimental setups, label-free quantitation and identification of metabolites, and quality control for proteomics experiments.
Research in proteomics and metabolomics is mainly driven by mass spectrometry coupled to liquid chromatography (LC-MS). Running long gradients and acquisition of high-resolution mass spectra yields an enormous amount of data that needs to be processed efficiently. Various instruments and experimental techniques are employed in current research in order to answer complex biological questions. This variety in experimental setups raises the need for highly flexible and efficient computational approaches to analyze experimental data. Workflow systems that combine small, reusable building blocks into larger, experiment-specific analysis workflows provide this flexibility. We demonstrate how the integration of OpenMS [1, 2] into the workflow system KNIME [3] significantly extends data processing capabilities allowing for sophisticated downstream analysis and visualization. OpenMS is an open source software framework for computational mass spectrometry. It provides more than 100 tools for signal processing, identification, and quantification including adapters to established search engines like Mascot [4], OMSSA [5], or X!Tandem [6]. OpenMS workflows can be constructed based on The OpenMS Proteomics Pipeline (TOPP) [1] in the graphical user interface TOPPAS [7]. Designed for fully automated processing, TOPPAS does not provide functionality for downstream analysis and only limited visualization capabilities. KNIME is an open source integration platform providing a powerful and flexible workflow system combined with advanced data analytics, visualization and reporting capabilities. KNIME integrates nodes for machine learning, statistical data analysis, and interfaces to various scripting languages, e.g., the statistical programming language R. KNIME’s functionality can be easily extended with nodes provided via an online plugin repository (so called KNIME extensions). As the execution of a KNIME workflow usually runs locally on a compute machine it does not require extra IT security provisions beyond the usual steps on the operating system or file system level. For larger data the execution can also be run on (often commercially) available cloud/cluster or server solutions, which meet today's security standards. The integration of OpenMS into KNIME is based on the GenericWorkflowNodes project (https://github.com/genericworkflownodes) that generates KNIME nodes for any command line tool that provides an XML-based description of the tool interface. We extended OpenMS to automatically generate those XML files for each TOPP tool. In contrast to regular KNIME nodes, the OpenMS nodes expect files and not tables as input. To allow an interaction between the file-based OpenMS nodes and the regular KNIME nodes we implemented a set of nodes to load the content of
proteomics data files into KNIME tables. These nodes either use the OpenMS specific TextExporter format or the recently published mzTab [8] format as input. Integrating OpenMS tools into KNIME enables the user to combine automated data processing of the raw mass spectrometry data (signal processing, quantification, identification) with KNIME’s data-mining and visualization capabilities in a single workflow, e.g., by directly integrating the initial raw data analysis with well-known R packages for proteomics data analysis (e.g., isobar [9], see Example 1) or by utilizing the existing KNIME packages for cheminformatics (e.g., to visualize chemical structures of metabolites, see Example 2). A KNIME/OpenMS workflow is composed of multiple nodes that are connected by ports. Ports represent single or multiple files that are passed from one tool to another. The number of incoming and outgoing ports depends on the individual tool, e.g., a database search engine like OMSSA will have two incoming ports, one for the file containing the spectra to be analyzed and one for the protein database to be searched. Nodes are added by drag & drop to the workbench and connected by drawing a line from the outgoing to the desired incoming port. For each generated connection between OpenMS nodes, the workflow engine will check if the file types are compatible, i.e., that only files of supported formats are given to a node. The parameters of nodes and their documentation are available via a configuration dialog. On execution, each node checks if the incoming data meets all requirements, e.g., the required amount of input files, and the workflow engine will abort the execution with a meaningful error message if requirements are not met. Workflows are very rarely so simple, that they contain only a linear sequence of nodes to process a single file. Therefore, additional nodes are provided to construct more complex workflows including loops and merge nodes. Loops allow applying the same series of nodes to multiple input files one at a time. Merge nodes allow combining two files into a list that can be given to nodes that require more than one input file. To further structure a workflow, KNIME provides so called Meta-nodes to group a collection of nodes. Grouping into Meta-nodes can be used to hide a very complex series of nodes and instead provide a high-level view on the data flow. When the initial analysis steps are finished, one often wants to load the generated results into the KNIME environment, i.e., represent them in the KNIME table structure. Using the OpenMS conversion nodes allows the user to load the file-based results of an OpenMS pipeline into KNIME tables. These tables can afterwards easily be processed using the hundreds of KNIME nodes or custom R code implemented in the KNIME R nodes.
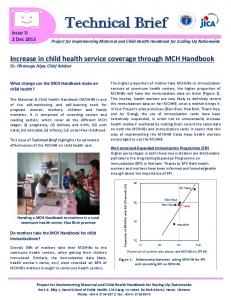
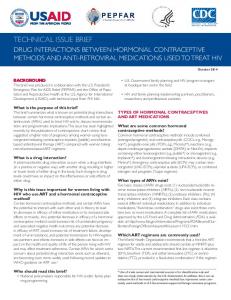
KNIME can export complete, pre-configured workflows into self-contained ZIP files. Thus, workflows can easily be shared with collaborators, uploaded to web-archives, or otherwise be made accessible to the scientific community. Once configured, workflows can also be run from command line for fully automated batch processing on a large number of files. With minor extensions, using KNIME’s flow variable concept, one can also configure KNIME such that the input files or other variable parameters of the workflow can be set from the command line when executed in batch-mode. Consequently, workflows can be configured and tested in a desktop environment, using small subsets of the original dataset, and subsequently be deployed to large compute infrastructures. In the remainder of this article we will present a series of example workflows adapted from existing projects. Quantitative experiments are one of the most basic approaches in proteomics. Here we present a workflow for the analysis of a complex sample labeled with Tandem mass tags (TMT) [10]. Human lung adenocarcinoma epithelial cells (A549) were treated with nano-copper oxide (CuO) or left untreated (three biological replicates). Cells were harvested at 6 different time points (0, 1, 3, 6, 12 and 24 hours after exposure to CuO or medium only controls) and subsequently measured and analyzed. For details on the experimental procedure see Supporting Information. The analysis workflow (see Figure 1) performs peptide identification using multiple search engines in parallel and then combines those results first into a single identification, using the ConsensusID approach [12], and afterwards combines the identifications with the quantitative information extracted from the TMT reporter ions. The protein inference and protein quantitation is based on the R package isobar [9], that is integrated via the R KNIME nodes. The workflow generates multiple tables containing the identified proteins with their respective log ratios and p-values as well as informative plots that can be used directly in reports or manuscripts. Additionally, a separate file containing basic quality control information is generated. Identification and quantitation of small molecules are basic approaches in metabolomics studies. In the second example, we present an UPLC-MS based, label-free quantitation workflow to exemplify the differential analysis of small molecules as typically used for biomarker discovery. Two spike-in conditions of a dilution series (male blood sample measured in triplicates, for details refer to [13]) have been processed by the analysis workflow (see Figure 2). Eluting smallmolecules were detected by our recently published feature detection approach [13]. Afterwards, inter-experiment retention time shifts were corrected by map alignment
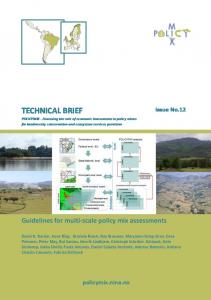
[14] and subsequently features occurring at the same mass-to-charge ratio and retention time were linked between the different MS runs [15]. Identifications were assigned by accurate mass search against the HMDB database [16], which has been extended with the isotopically labeled spike-in compounds. Feature intensities were normalized using quantile normalization. Two-sided t-tests and a fold change threshold of two were applied to determine differentially quantified compounds. Pvalues have been corrected for FDR control using the Benjamini-Hochberg procedure. For reporting, identification and quantification results are joined in a table for manual inspection. With the increasing amount of data produced in LC-MS/MS experiments quality control has become a crucial aspect of the day-to-day usage of mass spectrometry. Optimally, it should be easy to extend existing analysis workflows to also incorporate quality control. For this, qcML, a format for the representation, storage, and transfer of quality metrics has been developed [17]. The computation of the quality metrics, the generation of suitable plots, and integration in qcML can be achieved by extending existing OpenMS/KNIME workflows. Figure 3 shows the detailed QC workflow as it was presented previously [17]. It uses a combination of OpenMS nodes, R nodes, and the KNIME reporting functionality to generate a full quality control report. See ref. [17] for more details on the format and the workflow. The combination of OpenMS and KNIME allows users to utilize the numerous OpenMS tools in a user-friendly workflow environment in combination with the powerful analysis and visualization techniques provided by KNIME. With this unique combination, workflows for the analysis of mass spectrometry data can easily be created, tested, and shared with collaborators and used in high-throughput scenarios. All example workflows presented in this paper can be downloaded including example data from https://sourceforge.net/projects/open-ms/files/Papers/OpenMS_KNIME/.
Acknowledgments This project has received funding from the European Union’s Seventh Framework Programme [FP7/2007-2013] under EC-GA No. 263215 ‘MARINA’ (acknowledged by S. Aiche, T. Kristl, C. G. Huber, O. Kohlbacher and K. Reinert). This project has received funding from the European Union’s Seventh Framework Programme for research, technological development and demonstration under grant agreement No 263147 (NanoValid, support to A. Duschl and M. Boyles). M. Walzer and O. Kohlbacher acknowledge funding from Deutsche Forschungsgemeinschaft (SFB685/B1) and the European Union’s Seventh Framework Programme (EC-GA No. 262067– PRIME-XS). E. Kenar and O. Kohlbacher acknowledge funding from Deutsche Forschungsgemeinschaft (KO-2313/6-1) and Bundesministerium für Bildung und Forschung (01GI1104A). The authors have declared no conflict of interest.
References [1] Kohlbacher, O., Reinert, K., Gropl, C., Lange, E., et al., TOPP--the OpenMS proteomics pipeline. Bioinformatics 2007, 23, e191-197. [2] Sturm, M., Bertsch, A., Gropl, C., Hildebrandt, A., et al., OpenMS - an opensource software framework for mass spectrometry. BMC Bioinformatics 2008, 9, 163. [3] Berthold, M. R., Cebron, N., Dill, F., Gabriel, T. R., et al., KNIME: The Konstanz Information Miner, Data Analysis, Machine Learning and Applications, Springer Berlin Heidelberg 2007, pp. 319-326. [4] Perkins, D. N., Pappin, D. J., Creasy, D. M., Cottrell, J. S., Probability-based protein identification by searching sequence databases using mass spectrometry data. Electrophoresis 1999, 20, 3551-3567. [5] Geer, L. Y., Markey, S. P., Kowalak, J. A., Wagner, L., et al., Open mass spectrometry search algorithm. J Proteome Res 2004, 3, 958-964. [6] Craig, R., Beavis, R. C., TANDEM: matching proteins with tandem mass spectra. Bioinformatics 2004, 20, 1466-1467. [7] Junker, J., Bielow, C., Bertsch, A., Sturm, M., et al., TOPPAS: a graphical workflow editor for the analysis of high-throughput proteomics data. J Proteome Res 2012, 11, 3914-3920. [8] Griss, J., Jones, A. R., Sachsenberg, T., Walzer, M., et al., The mzTab Data Exchange Format: communicating MS-based proteomics and metabolomics experimental results to a wider audience. Molecular & Cellular Proteomics 2014. [9] Breitwieser, F. P., Muller, A., Dayon, L., Kocher, T., et al., General statistical modeling of data from protein relative expression isobaric tags. J Proteome Res 2011, 10, 2758-2766. [10] Thompson, A., Schafer, J., Kuhn, K., Kienle, S., et al., Tandem mass tags: a novel quantification strategy for comparative analysis of complex protein mixtures by MS/MS. Anal Chem 2003, 75, 1895-1904. [11] Premstaller, A., Oberacher, H., Huber, C. G., High-performance liquid chromatography-electrospray ionization mass spectrometry of single- and doublestranded nucleic acids using monolithic capillary columns. Anal Chem 2000, 72, 4386-4393. [12] Nahnsen, S., Bertsch, A., Rahnenführer, J., Nordheim, A., Kohlbacher, O., Probabilistic consensus scoring improves tandem mass spectrometry peptide identification. Journal of proteome research 2011, 10, 3332-3343. [13] Kenar, E., Franken, H., Forcisi, S., Wormann, K., et al., Automated label-free quantification of metabolites from liquid chromatography-mass spectrometry data. Molecular & cellular proteomics : MCP 2014, 13, 348-359. [14] Lange, E., Gropl, C., Schulz-Trieglaff, O., Leinenbach, A., et al., A geometric approach for the alignment of liquid chromatography-mass spectrometry data. Bioinformatics 2007, 23, i273-281. [15] Weisser, H., Nahnsen, S., Grossmann, J., Nilse, L., et al., An automated pipeline for high-throughput label-free quantitative proteomics. J Proteome Res 2013, 12, 1628-1644. [16] Wishart, D. S., Tzur, D., Knox, C., Eisner, R., et al., HMDB: the Human Metabolome Database. Nucleic acids research 2007, 35, D521-526. [17] Walzer, M., Pernas, L. E., Nasso, S., Bittremieux, W., et al., qcML: an exchange format for quality control metrics from mass spectrometry experiments. Molecular & cellular proteomics : MCP 2014.
Figure 1: TMT quantitation workflow performing reporter extraction, identification, and differential protein quantitation. Results are generated in form of images and excel spreadsheets. (a) displays one of the heat maps generated by the workflow showing significantly expressed proteins in the treated condition, (b) shows the distribution of protein ratios for one of the biological replicates that can be used for quality control, and (c) shows small part of the final report table as it will be written to the resulting excel file.
Figure 2: Workflow for label-free quantitation of metabolites. The insets show plots and tables generated by the workflow. (a) shows the intensity distributions of the individual samples before and (b) after normalization. (c) shows the summary table including the rendered chemical formulas for the identified and quantified metabolites.
Figure 3: Workflow to compute and summarize a detailed quality report for an LCMS/MS experiment. Insets (a)-(c) show parts of the generated quality report. (a) gives an overview of the analyzed file and details on the experiment, (b) shows the charge distribution of found MS1 features, and (c) shows a plot comparing found MS1 features with peptides identified in the MS/MS spectra.