a channel width of 25 mm, and has a nominal power rating of 5 kW. A more detailed discussion of this thruster can be found in Refs. 2 and 3. A laboratory model ...
JOURNAL OF PROPULSION AND POWER Vol. 22, No. 1, January–February 2006
Technical Notes TECHNICAL NOTES are short manuscripts describing new developments or important results of a preliminary nature. These Notes should not exceed 2500 words (where a figure or table counts as 200 words). Following informal review by the Editors, they may be published within a few months of the date of receipt. Style requirements are the same as for regular contributions (see inside back cover).
Ion Collection in Hall Thruster Plumes
2.31-cm-diam collection electrode enclosed within a guard ring. The collection electrode is aluminum, spray coated with tungsten to minimize secondary electron emission. Figure 2b shows a schematic of probe B. Probe B consists of a 1.941-cm-diam collection electrode enclosed within a guard ring. Probe B is made of stainless steel and is not spray coated, like probe A, to reduce secondary electron emission. The collector surface and guard ring are mounted to a ceramic electrical insulator. Both the collector and guard ring of probes A and B are designed to be biased to the same negative potential below facility ground to minimize edge effects around the collector by creating a flat, uniform sheath over the collection area.
Mitchell L. R. Walker,∗ Richard R. Hofer,∗ and Alec D. Gallimore† University of Michigan, Ann Arbor, Michigan 48109 Introduction
T
HE Hall effect thruster’s (HETs) combination of high specific impulse, efficiency, and thrust density has increased its popularity for use as spacecraft propulsion. Currently, the widespread use of HETs is hindered by the limited understanding of plume interaction with the spacecraft. This situation is complicated by the wide rage of probe designs and test facilities used for HET investigations. This Note reports on two nude Faraday probes of differing design that are used simultaneously to measure the ion current density of a 5-kW Hall thruster. The results show that both probes measure similar thruster plume profiles over the range of angular positions investigated for all operating conditions, with small differences between the ion current density profiles of the probes attributed to material selection. Moreover, both probes measure the highest ion current density near thruster centerline at the highest facility operating pressure. A combination of charge-exchange collisions and vacuum chamber gas ingestion into the thruster is believed to cause this phenomenon.
Data-Acquisition System The thruster is mounted with the exhaust beam aligned with the chamber axis, such that the thruster centerline is referenced as 0 deg. The probes are positioned 19.50 ± 0.25 deg apart on an overhead, rotating arm that is attached to a rotary table with a repeatability of 12 arc-sec. The probes are aligned to the center of the 173Mv1 exit plane and placed 100.9 ± 0.1 cm downstream of the thruster. A scan of the thruster plume from −100 to 100 deg, in 1-deg measurement increments, takes approximately 6 min. Multiple measurements of the ion current density profile, collected at a single operating condition, show that the data of both probes are very repeatable. In the following discussion, all data reported are with the collector and guard ring of both probes A and B biased to 20 V below facility ground by a single power supply. Prior use of nude probes at Plasmadynamics and Electric Propulsion Laboratory has indicated that a bias voltage of 20 V below facility ground is sufficient for the collector to enter ion saturation without substantial sheath growth.5,6 A 99.6 �(±0.5%) current shunt is placed in the biasing line connected to each collector. Probe current is measured to an accuracy of ±0.004% with this shunt resistor. The ion current density is calculated by dividing the current by the collector surface area and has an accuracy of ±0.5%.
Experimental Apparatus All testing was performed in the large vacuum test facility (LVTF) described in Ref. 1. The thruster is mounted at station 1, as indicated in Fig. 1. The facility backpressure was varied from 4.3 × 10⁻⁴ Pa (3.2 × 10⁻⁶ torr) to 1.9 × 10⁻³ Pa (1.4 × 10⁻⁵ torr) by changing the number of operating pumps.
Experimental Results and Discussion
Hall Thruster
The Faraday probe comparison is performed on the NASA173Mv1 Hall thruster. The 173Mv1 has a mean diameter of 148 mm, a channel width of 25 mm, and has a nominal power rating of 5 kW. A more detailed discussion of this thruster can be found in Refs. 2 and 3. A laboratory model hollow cathode is located at the 12 o’clock position on the thruster.4
The effect of facility backpressure on the measured ion current density of each probe is investigated by varying the pumping speed of the LVTF. Both nude Faraday probes are simultaneously investigated. The thruster is operated at 300 and 500 V at approximately 4.4 and 10 A, at nominal pumping speeds of 70,000, 140,000, and 240,000 l/s. Table 2 presents the thruster operating conditions and corresponding backpressures that we investigated. In Table 2 I ic is the inner magnet current, I oc is the outer magnet current, and V c-g, is the voltage difference between the cathode and ground. As the facility backpressure increases, more background xenon gas is ingested into the thruster discharge chamber. The anode mass flow rate is adjusted to keep the discharge current constant at all pumping
Probe Design
Table 1 summarizes the relevant dimensions of each probe. Figure 2a shows a schematic of probe A, which consists of a Received 2 July 2004; revision received 30 August 2005; accepted for c 2005 by Mitchell L. R. Walker. publication 30 May 2005. Copyright � Published by the American Institute of Aeronautics and Astronautics, Inc., with permission. Copies of this paper may be made for personal or internal use, on condition that the copier pay the $10.00 per-copy fee to the Copyright Clearance Center, Inc., 222 Rosewood Drive, Danvers, MA 01923; include the code 0748-4658/06 $10.00 in correspondence with the CCC. ∗ Graduate Student Researcher, Plasmadynamics and Electric Propulsion Laboratory, Department of Aerospace Engineering, 1052 FXB Building, 1320 Beal Avenue. Student Member AIAA. † Professor, Plasmadynamics and Electric Propulsion Laboratory, Department of Aerospace Engineering, 3037 FXB Building, 1320 Beal Avenue. Associate Fellow AIAA.
Table 1
205
Dimensions of probes A and B (all dimensions in centimeters)
Part name
Probe A
Probe B
Collector outer diameter Guard ring outer diameter Guard ring thickness Collector-to-guard ring gap Collector material
2.31 2.540 0.074 0.231 Tungsten
1.941 3.185 0.483 0.279 304 SS
206
J. PROPULSION, VOL. 22, NO. 1:
Table 2 Discharge voltage, V 300 500 300 500 300 500 300 500 300 500 300 500
TECHNICAL NOTES
NASA-173Mv1 operating conditions (anode and cathode flow rates are accurate to within 0.2 and 0.02 mg/s, respectively) Discharge current, A
Anode flow, mg/s
Cathode flow, mg/s
I ic, A
I oc, A
V c-g, V
Pressure, Pa-Xe
Pressure, torr-xe
4.39 5.01 10.23 10.62 4.37 4.93 10.14 10.66 4.35 4.89 10.22 10.72
4.81 4.77 9.61 9.61 5.01 5.01 9.73 9.73 5.06 5.27 9.75 9.75
0.55 0.55 0.55 0.55 0.55 0.55 0.55 0.55 0.55 0.55 0.55 0.55
2.00 2.50 3.50 3.25 2.00 2.50 3.50 3.25 2.00 2.50 3.50 3.25
1.50 2.00 3.00 2.85 1.50 2.00 3.00 2.85 1.50 2.00 3.00 2.85
−11.5 −12.5 −13.7 −13.3 −11.9 −11.4 −12.2 −12.3 −11.9 −11.2 −10.7 −10.8
1.7E−03 1.7E−03 3.1E−03 3.1E−03 1.0E−03 1.0E−03 1.7E−03 1.7E−03 5.7E−04 6.1E−04 1.0E−03 1.0E−03
1.3E−05 1.3E−05 2.3E−05 2.3E−05 7.6E−06 7.6E−06 1.3E−05 1.3E−05 4.3E−06 4.6E−06 7.7E−06 7.7E−06
Fig. 1
Schematic of the LVTF (not to scale).
a) Schematic of probe A
b) Schematic of probe B Fig. 2 Schematic of probes A and B. The collectors are isolated from the guard rings with ceramic standoffs.
speeds. As shown in Table 2, the magnet setting remains constant at each power setting for all three pumping speeds. Probe Design
Figure 3 compares the operation of probe A to probe B for thruster operating conditions of 300 V, at 4.37 A and 10.14 A. The figure shows that probes A and B measure similar thruster plume profiles for the 300-V thruster operating conditions. The similarity between the two probe measurements is also seen in the 500-V traces, and thus only probe A data measured at 300 V are presented and discussed. Because all other parameters are identical, the small differ-
Fig. 3 Ion current density vs position for probes A and B at a nominal pumping speed of 140,000 l/s on xenon. (300-V, 4.37-A, and 10.14-A thruster operation).
ence between the measured ion current density profiles must be a result of probe design, that is, collector material, guard ring thickness, and collector-to-guard ring gap. The greater secondary emission coefficient of probe B (0.15 for steel7 vs 0.02 for tungsten8 ) can account for the measured differences between the probe responses. Gulczinski measured ion energies above 100 eV, which is sufficient to yield electrons, in the P5 plume from 0 to 90 deg off thruster centerline.9 Thus, the secondary electron emission coefficient of
J. PROPULSION, VOL. 22, NO. 1:
the collector is important at all locations in the plume. Based on the differences in the secondary electron emission yield of the collector materials, the measured ion current density of probe B should be approximately 12.7% greater than that of probe A. This is very close to the 12.3 and 8.7% differences seen in the ion current density traces in Fig. 3 on thruster centerline at 4.3 and 10.2 A. Debye length estimates using known P5 plume parameters show that it is always greater than the guard ring to collector gap, so that their sheaths merge at all locations in the plume. With this criterion satisfied, the difference in guard ring design between the probes should not affect ion collection. The impact of material selection led to the use of probe A for all other results presented in this paper. Backpressure Effects
Figures 4 and 5 show ion current density traces at 4.3 and 10 A, respectively, with a discharge voltage of 300 V. The effect of facility backpressure is clearly seen in the wings of both figures. As the facility backpressure increases, the measured ion current density by both probes increases at large angles at all operating conditions even though the anode mass flow rate is reduced to maintain a constant
Fig. 4 Ion current density vs position for probe A at backpressures of 1.7 × 10⁻³ Pa (1.3 × 10⁻⁵ torr), 1.0 × 10⁻³ Pa (7.6 × 10⁻⁶ torr), and 5.7 × 10⁻⁴ Pa (4.3 × 10⁻⁶ torr) (300-V, 4.3-A thruster operation).
Fig. 5 Ion current density vs position for probe A at backpressures of 1.0 × 10⁻³ Pa (7.7 × 10⁻⁶ torr), 1.7 × 10⁻³ Pa (1.3 × 10⁻⁵ torr), and 3.1 × 10⁻³ Pa (2.3 × 10 −5 torr) (300-V, 10-A thruster operation).
TECHNICAL NOTES
207
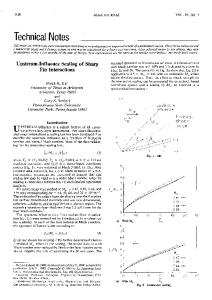
discharge current. Figure 4 shows that at the 4.3-A condition the central core of the plume is unaffected by the changes in the facility backpressure. By comparison, Manzella and Sankovic10 observed that the central core of the SPT-100 ion current density profile is largely unaffected roughly within ±30 deg from centerline with changing facility pressure. In addition, Manzella observed an increase in measured ion current at large angles.10 Manzella changed the facility pressure by bleeding xenon into the test chamber through an auxiliary bleed valve on the tank wall, not by varying pumping speed. The results show that these two techniques appear to yield an equivalent backpressure field. At the 4-A operating condition neither the 173Mv1 nor the SPT-10010 exhibit a change in the central core of the plume with increasing backpressure. This can be explained by noting that on centerline the number of slow charge exchange (CEX) ions is negligible in comparison to the number of ions born in the discharge channel. However, at the 10-A operating condition (Fig. 5), the ion current density in the central core and in the wings of the 173Mv1 plume increases with increasing facility backpressure. Similar results were obtained with the SPT-140 (see Ref. 11). It is not clear why the central core ion current density increases with increasing facility backpressure at the 10-A condition and not the 4.3-A condition. It is possible that the increase in central core ion current density can be explained by an increase neutral population at the thruster exit plane because the background pressure at the 10-A condition is nearly twice that of the 4.3-A condition. At the 10-A operating condition this process, though not totally understood, appears to outweigh the decrease in anode flow rate, which is done to maintain constant discharge current. An estimation of the measured total ion beam current Ii can be used to evaluate a Faraday probe’s ability to measure the ion current density. The Ii is affected by the facility backpressure because the ion current density measured by the Faraday probe includes CEX ions. Figure 6 shows the integrated beam current. The ion current density angular distribution is not symmetric about a probe angle of zero. To account for the asymmetry, the total ion beam current is calculated using the left- and right-hand-side angular distributions. The average of the two results is presented here. The error in the calculated total ion beam current is ±5%. Figure 6 shows that as facility backpressure decreases the total integrated ion beam current at all thruster operating conditions slowly increases. This trend is counterintuitive because a higher backpressure normally results in more low-energy CEX ions, which in turn cause Faraday probes to measure an ion current density higher than the true value. The process that causes this trend is not understood. The trend exhibited in Fig. 6 shows that total integrated ion current might not be a straightforward method of evaluating facility
Fig. 6 Total integrated ion beam current vs facility backpressure at all operating conditions for probe A.
208
Fig. 7
J. PROPULSION, VOL. 22, NO. 1:
Facility backpressure vs plume divergence angle for probe A.
backpressure effects. Instead, by comparing the ratio of total integrated ion current to discharge current with Hofer’s exit plane measurements of Ii /Id in Ref. 12, the ability of a Faraday probe design to measure the ion current density in the presence of CEX ions can be evaluated. Hofer reports Ii /Id , where Id is the discharge current, to be approximately 77% (±2%) for the optimized Hall thruster.12 The ratios of the total ion beam current to discharge current, Ii /Id measured with probe A are greater than the 77% value Hofer reports.12 In addition, Ii /Id increases with discharge voltage for constant discharge current at all operating conditions except 1.7 × 10⁻³ Pa at approximately 4 A. The difference in the ratios of the total ion beam current to discharge current can be attributed to facility effects. As the ion energy increases from 300 to 500 eV, the chargeexchange cross section decreases, which leads to a reduction in reaction probability. The reduction in reaction probability allows more fast discharge ions to reach the Faraday probe surface. This agrees well with the observed increase in Ii /Id when the discharge voltage increases from 300 to 500 V. Integrating the angle-dependent ion flux yields the plume current contained within a given half-angle. The divergence half-angles containing 90% of the total measured ion current are calculated for probe A using the measured ion current density profiles. Figure 7 shows that the plume divergence half-angle decreases as the backpressure decreases for the 4–5 A operating conditions, which is consistent with prior results. From 4–5 A, the measured ion current densities in the central core of the SPT-100,10 SPT-140,11 and 173Mv15 are unaffected by facility backpressure, but at large angles from centerline the ion current density measurements decrease with decreasing backpressure. The divergence half-angles of these thrusters also decrease with decreasing backpressure for discharge currents of 4–5 A. In addition, the measured ion current density within the central core of these thrusters increases with increasing backpressure for the 10-A operating conditions, which creates a more collimated plume profile. This is consistent with Fig. 7, which shows that the calculated divergence half-angle of the 173Mv1 decreases as the facility backpressure increases for the 10-A operating conditions. The ion current density percent difference between two backpressures displays the effect of facility backpressure on ion current density measurements. Figure 8 shows the percent difference in current density between the backpressures of 1.7 × 10⁻³ Pa (1.3 × 10⁻⁵ torr) and 5.7 × 10⁻⁴ Pa (4.3 × 10⁻⁶ torr) at a thruster operating condition of 300 V at 4.3 A. Figure 9 shows the percent difference in measured ion current density between backpressures of 1.0 × 10⁻³ Pa (7.6 × 10⁻⁶ torr) and 5.7 × 10⁻⁴ Pa (4.3 × 10⁻⁶ torr) at a thruster operating condition of 300 V at 4.3 A. As seen in Fig. 8, the percent difference between measurements taken at 1.7 × 10⁻³ Pa
TECHNICAL NOTES
Fig. 8 Percent difference between current density profiles measured at backpressures of 1.7 × 10⁻³ Pa (1.3 × 10⁻⁵ torr) and 5.7 × 10⁻⁴ Pa (4.3 × 10⁻⁶ torr) using probe A at an operating condition of 300 V, 4.3 A.
Fig. 9 Percent difference between current density profiles measured at backpressures of 1.0 × 10⁻³ Pa (7.6 × 10⁻⁶ torr) and 5.7 × 10⁻⁴ Pa (4.3 × 10⁻⁶ torr) using probe A at an operating condition of 300 V, 4.3 A.
(1.3 × 10⁻⁵ torr) and 5.7 × 10⁻⁴ Pa (4.3 × 10⁻⁶ torr) is approximately a 7% increase on centerline. By reducing the backpressure to 1.0 × 10⁻³ Pa (7.6 × 10⁻⁶ torr), the centerline difference from 5.7 × 10⁻⁴ Pa (4.3 × 10⁻⁶ torr) is unchanged. The increasing percent difference at large angles from centerline corresponds to the presence of CEX ions in the plume perimeter. As shown in Figs. 8 and 9, deviations in ion current density profile increase with increasing facility background pressure for HET plume angle measurements beyond approximately ±40 deg. The effect of the CEX ions on Faraday probe measurements is most evident at large angles in the ion current density profiles where the ratio of primary discharge to CEX ions is small. The effect of CEX ions increases with increasing facility backpressure because of an increase in the number of neutrals atoms present in the vacuum chamber. The percentage of beam ions that reach a given location in the plume is affected by the facility operating pressure. Gulczinski’s ion energy distribution measurements of the P5, at the 300-V, 5-A operation condition, show that the most probable ion energy of singly charged ions at 40 and 90 deg is approximately 280 and 180 V, respectively.9 The percentage of beam ions that reach probe A
J. PROPULSION, VOL. 22, NO. 1:
without a collision is calculated at the interrogation angles using the ion energy estimates and the Xe-Xe+ cross-section data in Ref. 13. At 40 deg the beam ion survival rate is 90% for 1.7 × 10⁻³ Pa and increases to 97% for a backpressure of 5.7 × 10⁻⁴ Pa. At 90 deg the beam ion survival rate is 89% for a backpressure of 1.7 × 10⁻³ Pa and increases to 96% for a backpressure of 5.7 × 10⁻⁴ Pa. The decrease in the number of collisions caused by the lower operating pressure only accounts for a small increase in the percentage of ions that reach the probes at 40 deg. It has been shown that elastic scattering is the source of the majority of ions with energy greater than E/q = 50 V that are observed at angles greater than 45 deg with respect to the thruster axis.14 These ions account for only a few percent of the beam. The nude Faraday probe cannot differentiate between these high-energy largeangle scattered ions and the low-energy CEX ions. The percentage of elastically scattered ions in the plume is not measured, and thus their effect is not accounted for in the analysis of the Faraday probe data.
Conclusions The ion current density distribution of the 173Mv1 Hall thruster is measured with two probes over a wide rage of backpressures and operating conditions. The effect of probe design is a result of different secondary electron emission coefficients—tungsten collector surfaces are clearly required for accurate beam current measurements. Analysis of local plasma parameters shows that Debye length must be considered when calculating collector-to-guard ring gap. The collector-to-guard ring gap of the probe should be designed and positioned to ensure a flat, uniform sheath over the collector surface. For both probes, the magnitude of the ion current density at the central core of the plume increases with increasing facility background pressure. A similar trend in ion current density measurements is seen at large angles from the thruster centerline. Probes A and B measure similar thruster plume profiles for all operating conditions. Analysis of the ion current density traces shows that Ii /I D might be the best way to evaluate the performance of a Faraday probe. In addition, the plume divergence angle depends on facility backpressure and anode flow rate. Clearly, the CEX and elastically scattered ions present at angles greater than 40 deg from thruster centerline must be actively filtered away from the Faraday probe collector surface to reduce the effect of facility backpressure on the measurements.
Acknowledgments The research contained herein was sponsored by the Air Force Office of Scientific Research. (Mitat Birkan is the contract monitor). We would like to thank Colleen Marrese at Jet Propulsion Laboratory for loaning Plasmadynamics and Electric Propulsion Laboratory (PEPL) the nude Faraday probes (probe A), Robert Jankvosky at NASA Glenn Research Center (GRC) for loaning PEPL the NASA GRC probes (probe B) and laboratory-model hollow cathode, Terry
209
TECHNICAL NOTES
Larrow for fabricating the hardware used in this study, and the departmental technical staff and other graduate students at PEPL for help in maintaining the facilities. M. L. R. Walker is supported by the Michigan Space Grant Consortium and the National Science Foundation. R. Hofer is supported by the NASA Graduate Student Research Program. The authors are greatly appreciative of this support.
References 1 Walker,
M. L. R., Gallimore, A. D., Cai, C., and Boyd, I. D., “Vacuum Chamber Pressure Maps of a Hall Thruster Cold Flow Expansion,” Journal of Propulsion and Power, Vol. 20, No. 6, 2004, pp. 1127–1132. 2 Hofer, R. R., Peterson, P. Y., and Gallimore, A. D., “A High Specific Impulse Two-Stage Hall Thruster with Plasma Lens Focusing,” International Electric Propulsion Conference, IEPC-01-036, Oct. 2001. 3 Hofer, R. R., and Gallimore, A. D., “The Role of Magnetic Field Topography in Improving the Performance of a High-Voltage Hall Thruster,” AIAA Paper 2002-4111, July 2002. 4 Sarver-Verhey, T. R., “28,000 hour Xenon Hollow Cathode Life Test Results,” International Electric Propulsion Conference, IEPC-97-168, Aug. 1997. 5 Walker, M. L. R., Hofer, R. R., and Gallimore, A. D., “The Effects of Nude Faraday Probe Design and Vacuum Facility Backpressure on the Measured Ion Current Density Profile of Hall Thruster Plumes,” AIAA Paper 2002-4253, July 2002. 6 Haas, J. M., “Low-Perturbation Interrogation of the Internal and Nearfield Plasma Structure of a Hall Thruster Using a High-Speed Probe Positioning System,” Ph.D. Dissertation, Univ. of Michigan, University of Michigan Aerospace Engineering Microfilms International, Ann Arbor, Feb. 2001. 7 Nedzelskiy, M., and Cabral, V., “Influence of a Non-Uniform Magnetic Field on the Measurement of the ne xσeff Profile by Heavy Ion Beam Probing with a Multiple Cell Array Detector,” 28th EPS Conference on Controlled Fusion and Plasma Physics, ECA, V25A, 2001, pp. 1253–1256. 8 Brown, S., Basic Data of Plasma Physics, McGraw–Hill, New York, 1959, p. 230. 9 Gulczinski, F. S., “Examination of the Structure and Evolution of Ion Energy Properties of a 5 kW Class Laboratory Hall Effect Thruster at Various Operational Conditions,” Ph.D. Dissertation, Univ. of Michigan Dt, Univ. of Michigan Department Aerospace Engineering Microfilms International, Ann Arbor, Aug. 1999. 10 Manzella, D. H., and Sankovic, J. M., “Hall Thruster Ion Beam Characterization,” AIAA Paper 95-2927, July 1995. 11 Hargus, W. J., Fife, J., Mason, L., Jankovsky, R. S., Haag, T. W., and Pinero, S., “Preliminary Performance Results of the High Performance Hall System SPT-140,” AIAA Paper 2000-3250, July 2000. 12 Hofer, R. R., and Gallimore, A. D., “Recent Results from Internal and Very-Near-Field Plasma Diagnostics of a High Specific Impulse Hall Thruster,” International Electric Propulsion Conference, IEPC-2003-037, March 2003. 13 Boyd, I. D., and Dressler, R. A., “Far Field Modeling of the Plasma Plume of a Hall Thruster,” Journal of Applied Physics, Vol. 92, No. 4, 2002, pp. 1764–1774. 14 Katz, J., Davis, Mandell, Mikellides, Dressler, R. A., Boyd, I. D., Kannenberg, and Pollard, J. E., King, “A Hall Effect Thruster Plume Model Including Large-Angle Elastic Scattering,” AIAA Paper 2001-3355, July 2001.


![technical notes - PIVX [PDF]](https://m.moam.info/img/260x300/technical-notes-pivx-pdf_6479dcf2098a9e07618b456b.jpg)