Mar 30, 2001 - A missed buying opportunity is often not regarded ... International Journal of Intelligent Systems in Accounting, ... 2.2 Software Components .
Techniques and Software for Development and Evaluation of Trading Strategies Thomas Hellström Ph.D. Thesis, 2001 UMINF-01.07 ISBN 91-7305-023-7 ISSN-0348-0542 Department of Computing Science Umeå University S-901 87 Umeå, Sweden March 30, 2001
ii
Abstract Dear Sir or Madam will you read my book It took me years to write, will you take a look Paperback Writer, Lennon/McCartney
This thesis deals with the analysis and development of techniques and software for trading strategies. Within a developed simulation environment algorithms, both existing and newly-introduced, are put to the test and conclusions are drawn regarding both the prediction accuracy and the test procedure as such. The problems with optimization of trading rules are attacked with a non-linear constraint to ensure a minimum number of trading signals for a given time period. The thesis also introduces a novel rank measure that takes into account a large number of securities and grades them according to the relative returns. Linear modeling of the ranks yields competitive prediction results and suggests further research along the same track. In another part of the thesis an algorithm is developed for estimating covariance matrices as they are used in portfolio optimization. The algorithm identifies and removes outliers in data and thereby achieves both more accurate estimations of future covariance matrices and higher risk-adjusted returns in the optimized portfolios.
iv
Preface It took me so long to find out, and I found out Ah, ah, ah, ah, ah, ah Day Tripper, Lennon/McCartney
In recent years the application of techniques, such as machine learning, data mining, knowledge discovery, and nonlinear optimization to financial prediction problems, has seen exciting results. Several annual conferences are totally dedicated to the subject, including Computational Finance since 1993 and Forecasting Financial Markets since 1994. Furthermore, most major conferences in the various fields of machine learning, and also in fields such as mathematical programming, have workshops and sessions dealing with methodologies for financial predictions. The great interest in the field shows an increasing belief, not only among active traders but also in the academic world, that many financial markets are far from perfectly efficient, in the sense that asset prices do not always reflect all available information. The major part of this thesis deals with the analysis and development of techniques and software for trading strategies. The contributions of the work falls essentially into the area of this financial application. An extensive software environment for developing and testing prediction algorithms is presented and used in Papers 6 and 7. Guidelines and methodology to deal with the ever-present problem of data snooping can be found in many of the presented papers, for example in Paper 5, which deals with the problem in conjunction with optimization of trading rules. A new way to formulate a multi-stock prediction problem by ranking the stock returns is presented in Paper 4. Paper 3 describes a technique for removing outliers in time series data for portfolio optimization. The technique can also be applied to other applications, where noisy time series data is modeled. The other papers also could be of value for non-financial applications. The common denominator would be in such a case an extremely low signal to noise ratio combined with the way misclassification costs are calculated. A missed buying opportunity is often not regarded to be as fatal as a false buying signal. The same way of judging misclassifications is found in the industrial sector as well as in natural resource exploration. It is my belief and hope that the work presented in this thesis proves useful also in such domains, outside the trading rooms. The thesis is organized as follows: Chapter 1 contains a survey of academic views on predictability in the financial markets. The software environment developed and used throughout the thesis work is then described briefly in Chapter 2. Chapter 3 is a summary of the included publications. Finally, the publications are reprinted in their original form.
vi The thesis includes the following publications: 1. T. Hellström. Data Snooping in the Stock Market1 . Theory of Stochastic Processes, 5(21)(1—2):33—50, 1999. 2. T. Hellström and K. Holmström. The Relevance of Trends for Prediction of Stock Returns2 . International Journal of Intelligent Systems in Accounting, Finance & Management, 9(1):23—34, 2000. 3. T. Hellström. Outlier Removal for Prediction of Covariance Matrices with an Application to Portfolio Optimization1 . Theory of Stochastic Processes, 6(22)(3—4):47—63, 2000. 4. T. Hellström. Predicting a Rank Measure for Portfolio Selection1 . Theory of Stochastic Processes, 6(22)(3—4):64—83, 2000. 5. T. Hellström. Optimization of Trading Rules with a Penalty Term for Increased Risk-Adjusted Performance3 . Advanced Modeling and Optimization, 2(3):135—149, 2000. 6. T. Hellström and K. Holmström. Parameter Tuning in Trading Algorithms using ASTA4 . In Y. S. Abu-Mostafa, B. LeBaron, A. W. Lo, and A. S. Weigend (Editors), Computational Finance 1999, pages 343—357, MIT Press September 1999. 7. T. Hellström. ASTA — a Tool for Development of Stock Prediction Algorithms1 . Theory of Stochastic Processes, 5(21)(1—2):22—32, 1999.
The thesis also contains two appendices: 1. T. Hellström. ASTA - User’s Reference Guide. Technical Report UMINF00.16 ISSN-0348-0542, Department of Computing Science Umeå University, Umeå Sweden, 2000. 2. T. Hellström. CLS - a Work Bench for Classification Algorithms. Technical Report UMINF-00.17 ISSN-0348-0542, Department of Computing Science Umeå University, Umeå Sweden, 2000.
1
c ° c ° 3 c ° 4 c ° 2
1999, 2000 TBiMC. Reproduced with permission. 2000 John Wiley & Sons Limited. Reproduced with permission. 2000 ICI Publishing House — Bucharest, Romania. Reproduced with permission. 1999 Massachusetts Institute of Technology. Reproduced with permission.
Acknowledgements where would I be without you Lovely Rita, Lennon/McCartney
I wish to thank my supervisors, Professor Patrik Eklund and Professor Zvi Gilula. Patrik has been my main supervisor while Zvi has acted as joint supervisor for the second half of my work. Thanks also to Professor Kenneth Holmström who was joint supervisor for the first half of the work and is co-author of two of the papers from that period. Furthermore, I would like to thank the head of the department Lennart Edblom who, together with Patrik, found means and resources for my collaboration with Zvi at the Hebrew University in Jerusalem, Israel. I had the honor to visit Zvi and his colleagues on two occasions and major parts of this thesis were created at that time. I am grateful as well to Professor Dmitrii Silvestrov who has shown great confidence in me and has given me invaluable opportunities to participate in international research activities. Let me also thank Dr. Xavier deLuna, Professor Bo Kågström and Professor Per-Åke Wedin for their kind help and suggestions during the completion of this thesis. I would like to go on and thank Fredrik Georgsson for his willingness and ability to discuss even topics of which he knows nothing. All in true academic spirit.
Umeå, April 1, 2001 Thomas Hellström
viii
Contents 1 Introduction 1.1 Why Predict Stock Prices? . . . . . . . . 1.2 Is the Market Predictable At All? . . . . 1.2.1 The Random Walk Hypothesis . . 1.2.2 The Efficient Market Hypothesis . 1.2.3 Current State of Affairs . . . . . 1.2.4 Evidence of Predictability . . . . 2 A Software Environment 2.1 Software Design . . . . . . . . . . . . . . 2.1.1 Choice of Programming Language 2.1.2 Design Guidelines . . . . . . . . . 2.1.3 User Interface . . . . . . . . . . . 2.2 Software Components . . . . . . . . . . . 2.2.1 Interfacing . . . . . . . . . . . . . 2.2.2 Market Simulation . . . . . . . . 2.2.3 Data Extraction . . . . . . . . . . 2.2.4 Classification . . . . . . . . . . .
. . . . . . . . . . . . . . .
. . . . . . . . . . . . . . .
. . . . . . . . . . . . . . .
. . . . . . . . . . . . . . .
. . . . . . . . . . . . . . .
. . . . . . . . . . . . . . .
. . . . . . . . . . . . . . .
. . . . . . . . . . . . . . .
. . . . . . . . . . . . . . .
. . . . . . . . . . . . . . .
. . . . . . . . . . . . . . .
. . . . . . . . . . . . . . .
. . . . . . . . . . . . . . .
. . . . . . . . . . . . . . .
. . . . . . . . . . . . . . .
. . . . . .
1 1 1 2 2 3 4
. . . . . . . . .
9 10 10 11 11 12 12 12 13 13
3 Summary of the Included Papers
15
Bibliography
19
Paper 1
23
Paper 2
43
Paper 3
57
Paper 4
77
Paper 5
99
Paper 6
117
Paper 7
135
Appendix 1
149
Appendix 2
207
x
CONTENTS .
Chapter 1 Introduction 1.1
Why Predict Stock Prices? Cause I don’t care too much for money, For money can’t buy me love Can’t Buy Me Love, Lennon/McCartney
The wish to find methods to predict asset returns has occupied the minds of investors and also academics since the birth of financial markets. Besides the obvious monetary value that comes with the ability to correctly predict financial assets, there has been a growing recognition among economists that the financial variables are closely connected to real economy. One example is the relatively new idea of using interest rates to fight inflation [6, p.xxxiii]. The liberalization and globalization of world asset markets have caused interest rates, exchange rates, and also other asset markets to be intimately linked, and the need for tools to monitor as well as control risk levels has become obvious both for industrial companies and financial institutions. The question of predictability in the stock markets is therefore important even outside the trading rooms.
1.2
Is the Market Predictable At All? Let me forget about today until tomorrow Mr. Tambourine Man, B. Dylan
It is hard to resist the temptation to include the following old joke (cited from Lo, McKinley [15, p.6]) about ‘an economist strolling down the street with a companion when they come upon a $100 bill lying on the ground. As the companion reaches down to pick it up, the economist says “Don’t bother — if it were a real $100 bill, someone would have already picked it up”’. Irrational as it may seem, this way of reasoning is very close to the official academic standpoint until only a few years ago. Let us start the debate by introducing two key concepts: the Random Walk Hypothesis and the Efficient Market Hypothesis.
2
CHAPTER 1. INTRODUCTION
1.2.1
The Random Walk Hypothesis Here I stand head in hand. Turn my face to the wall You’ve Got To Hide Your Love Away, Lennon/McCartney
The concept of random walk was in use already in the sixteenth century as a model of games of chance. More recently it has been used in chemistry and physics, for example the Brownian Motion, which is used to describe random movements of particles in liquid. This application might have instigated the metaphor of a drunk man trying to find his way home along a street. His1 staggering back and forth around the middle of the street (or hopefully the pavement) can be described mathematically by the random walk concept. Related or not to this analogy of a drunk person, the random walk is also a popular model to describe the actions of financial traders. It is expressed in the Random Walk Hypothesis, which simply claims that a financial time series follows a random walk process, normally defined as y(t) = y(t − 1) + a(t),
(1.1)
where y is the time series in question, and a is an error term, which has zero mean, constant variance, and whose values are independent of each other. The change ∆y(t) = y(t) − y(t − 1) is thus a(t) and is hence independent of previous changes ∆y(t − 1), ∆y(t − 2), .... Empirical observations such as clustered volatility have led to discussions about the validity of the Random Walk Hypothesis as a theoretical model of financial markets and to alternative formulations. One such formulation is the Martingale process which rules out the conditional dependence in ∆y, but not in any higher moments of ∆y, as shown in Mills [19]. This is consistent with the observations that financial time series go through quiet periods as well as periods of turbulence. As Mills points out, this can be modeled by a process, in which successive conditional variances are autocorrelated, but not with the more restrictive random walk. Paul Samuelson’s influential paper [23] aims at proving that “properly anticipated prices fluctuate randomly”. The idea is that all investors analyze the same information instantaneously and reach the same results regarding the “real” price of all assets. Combined with frictionless markets, there will never be any opportunities to make profits based on further analysis of information. In such a world, price changes would vary randomly and therefore would be completely unpredictable. This view has dominated the theoretic field for decades and the Random Walk Hypothesis has been “taken for granted as gospel truth” [17, p.13].
1.2.2
The Efficient Market Hypothesis We have two classes of forecasters: Those who don’t know and those who don’t know they don’t know. John Kenneth Galbraith
The Efficient Market Hypothesis states that the current market price reflects the assimilation of all the information available. This means that given the information, 1
For the sake of genus neutrality it should be emphasized that the analogy would work equally well for a drunk woman.
1.2. IS THE MARKET PREDICTABLE AT ALL?
3
no useful prediction of future changes in the price can be made. As new information enters the system, the imbalanced state is immediately discovered and quickly eliminated by a “correct” change in market price. The Efficient Market Hypothesis has been fairly well supported in a number of research studies, e.g. White [25], Lowe and Welsh [17]. In Fama’s survey [7], most of the included research papers did not present statistically significant evidence against the Efficient Market Hypothesis. It has, just like its close relative the Random Walk Hypothesis, been for long the “official” viewpoint in the academic community.
1.2.3
Current State of Affairs I’ve got to admit it’s getting better, a little better all the time Getting Better, Lennon/McCartney
Although the Random Walk Hypothesis has been dominating the academic scene for many decades, during the same period many presented studies have rejected it. A few early examples are Osborn [20] and Steiger [24]. Lo and MacKinley [13] show that the weekly first-order autocorrelation coefficient for an equally-weighted returns index is as high as 30%, which is a clear rejection of random walk behavior. As previously mentioned, the Efficient Market Hypothesis too has been, for a long time, the “official” viewpoint among academics. However, in recent years, many research papers have begun to question the hypothesis. One key point in the criticism comes from the fact that many market actors value more factors than just the price for which they can buy and sell an asset. The most striking example is the concept of risk. Risk is central in modern portfolio theory but is not taken into account in the Efficient Market Hypothesis [15, p.5]. Since different kinds of actors compute risk in different ways, it is perfectly possible that one actor views a certain stock price as a good buying opportunity, while another views the same price as a good selling opportunity. Another example is the varying liquidity needs among traders. Some traders are gladly willing to pay a higher price just to make sure the trade is executed immediately. Yet, none of the traders in these examples can be said to act irrationally. They simply have different utility functions for computing the value of different actions and states. Another key point in the criticism deals with the way the cost for trading is defined. It has always been clear that transaction costs have to be added to the price to give the Efficient Market Hypothesis any chance of being valid. Consequently, the most common form of the hypothesis claims that “excess” profit from analyzing and trading stocks is not possible. By excessive it is normally meant after transaction costs. However, there are many other costs involved in analyzing and trading. Grossman and Stiglitz [10] claim that inefficient markets are necessary since neither data acquisition nor data analysis is free. For these operations to be meaningful for any market actor, the costs have to be compensated for by sufficient profit opportunities. Predictions involve a lot of work in terms of data acquisition, manual analysis and computer intensive modeling. For this work to be done, it simply has to pay off in terms of “excess” profit, which can be seen as the economic rent paid for performing the costly data analysis. If no such profits were possible, no one would invest money in traditional financial analyses or development of new financial methodologies. Since huge amounts of money are doubtlessly pumped into these
4
CHAPTER 1. INTRODUCTION
activities worldwide, it seems likelly that these investments do pay off and that the Efficient Market Hypothesis is being contradicted. Lo and MacKinley [15, p.16] give a compelling argument that goes well over the head of most theories and principal discussions. They report how investment firms like Morgan Stanley and D.E. Shaw exploited “inefficiencies”, later to be called “statistical arbitrage”, for more than a decade during the 1980’s before the techniques became public knowledge and the prospects of profit by them diminished. Summarising the arguments given so far, the fact that some companies have found and exploited predictability in the past shows that it could also be possible in the future. Besides, it pinpoints the fact that the cost for trading stocks is not determined by the price of the stocks only. Just as trading costs have to be included, so do costs for development and execution of data analysis and trading techniques. Furthermore, the profit made is not only determined by the difference between buy and sell prices. Some actors value low risk and fast execution of trading in addition to the pure stock prices. In a heterogeneous market there are constantly both buy and sell opportunities that can generate “excess” profits with respect to an individual’s preferences. Fama goes as far as stating, in a review [9], that the Efficient Market Hypothesis surely must be false. Also Cuthbertson concludes in a survey [3, p. 152.]:“Not only are stock returns predictable from regression equations, but there is considerable evidence that actual trading strategies based on the predictions from these equations can result in profits, net of dealing costs”. However, academic opinion is not in unison. Lo and MacKinley summarize [15, p.6]: “Even after three decades of research and literally thousands of journal articles, economists have not yet reached a consensus about whether markets — particularly financial markets — are efficient or not”. The question of whether presented trading results are statistically significant, and whether the profits are still positive after compensation for risk, is still open enough to keep the debate on the Efficient Market Hypothesis alive for a long time to come.
1.2.4
Evidence of Predictability An economist is someone who sees something working in practice and asks whether it would work in principle. Stephen M. Goldfeld
Instead of spending all energy at forcefully defending the Random Walk and the Efficient Market Hypotheses, many researchers have instead started to look at possible reasons why the markets could be predictable and even how some prediction methods could be used to generate “excess” profit. Below are a few examples of effects and “anomalies”2 that have been observed and reported.
2
This is a common denotation for observations that do not fit the current paradigm, in this case the Efficient Market Hypothesis.
1.2. IS THE MARKET PREDICTABLE AT ALL?
5
Autocorrelation Nothing you can do but you can learn how to be you in time All You Need is Love, Lennon/McCartney
There has been extensive research on the temporal dynamics of stock returns. For weekly and monthly returns, most results point at negative autocorrelations for individual stocks. See for example Blume and Friend [1], Lo and MacKinley [14] and Jegadeesh [11]. Fama and French [8] find a statistically significant negative serial correlation also for long holding periods (more than 3 years) in stocks. A negative serial correlation is consistent with the Stock Market Overreaction and Mean Reversion effects described below. The autocorrelation for portfolios of stocks, and also for indices, are most often reported as positive. Lo and Mackinley [15, p.119] report strong positive autocorrelation in weekly returns for an equally weighted stock index. The autocorrelation as well as cross-correlations between national stock indices are also found positive in the tests reported in Paper 7 of this thesis. Cross effects I am he as you are he as you are me and we are all together. I Am The Walrus, Lennon/McCartney
In [15], Lo and MacKinley report on positive cross-autocovariances across securities. These cross effects are most often positive in sign and are characterized by a lead-lag structure, where returns for large-capitalization stocks tend to lead those of smaller stocks. It is interesting to note that a profitable portfolio strategy can be formed around this effect even if the individual stocks are completely unpredictable using past returns of each stock alone. This effect can provide an explanation to the successful trading results from rank predictions presented in Paper 4 of this thesis. Mean Reversion Get back, get back, get back to where you once belonged Get Back, Lennon/McCartney
Mean reversion is the observed phenomenon, where higher-than-average returns are followed by lower returns for the same stock in the future. In two studies [8, 21], the effect is observed for stocks over long holding periods (3—5 years). However, for weekly returns, a mean-reverting model does not fit data any better than a pure random-walk model [12]. In any case, the effect of mean reversion is related to many practical trading strategies concerned with ‘buying low’ and ‘selling high’.
6
CHAPTER 1. INTRODUCTION
Stock Market Overreaction For the loser now will be later to win The times they are a-changin’, B. Dylan
This effect refers to the waves of optimisim and pessimism that give the market inertia to temporaily move asset prices away from their “real” value. Overreaction could be explained by the negative serial correlation previously described in this section. However, another plausible explanation is the cross-autocovariances mentioned earlier. Regardless of the cause of the effect, it can be utilized in simply trading strategies based on ‘buying the losers’ and ‘selling the winners’. This strategy is evaluated as an example in Paper 7 of this thesis and is also reported to be successful by DeBondt and Thaler [4, 5]. Small-Firm Effect Have you seen the little piggies, crawling in the dirt Piggies, Harrison
This effect comes from the observation that small capitalized companies over a long time period have had higher rate of returns than the larger companies [3]. Also the results of the research presented in this thesis are in accordance with this observation. For example, the rank predictions presented in Paper 4 show a clear difference in behavior between large and small stocks. The classical argument against trading strategies based on this effect is that the higher returns are balanced by a higher risk attached to small firms. However, there are also papers, for example Reinganum [22], arguing that even the risk-adjusted returns are higher for smaller firms than for larger ones. Technical Analysis I hi hi hi hi hi hi, feel the wind blow. Well you can indicate everything you see Dig A Pony, Lennon/McCartney
Technical analysis, also known as “charting,” has been used by practitioners in the financial markets for a long time. So-called “technical indicators,” consisting of simple transformations of past stock data, are used to produce buy and sell recommendations for the traders. In the academic community, technical analysis has been at best proclaimed useless, and at worst equated with woodo, astrology or alchemy. A corner stone in the criticism is the influencial book A Random Walk Down Wall Street [18] by Burton Malkiel. One of the reasons for these diverging views is the highly subjective nature of technical analysis. Attempts to formalize a few of the most subjective technical trading rules is made by Lo, Mamaysky and Wang in [16], where the authors conclude that “several technical indicators do provide incremental information and may have some practical value”. In an often-quoted paper, Brock, Lakonishok and LeBaron [2] show that moving-average rules produce statistically significant average returns for the US stock market. While the standard methods suggested and used by technical analysts can be rightly accused of being naively crude and taken out of the blue, it is also a fact that
1.2. IS THE MARKET PREDICTABLE AT ALL?
7
many of the (failed) academic attempts to model the stock market have been even more simplifying. One such example is the relation between traded volume and stock prices that always has been obvious for technical traders. Many technical trading rules, when forming their trading signals, include the traded volume as well as the open, close, low, and high price for each day. In contrast, the majority of academic models on the subject works with close prices only. However non-predictable the stock market may be, it is not a correct inference to draw this conclusion from such simplified analyses. Part of the work in this thesis aims at bridging the gulf between technical anlaysis and quantitative finance. The ASTA system described in Paper 7 provides a flexible and objective testbench for trading rules. The standard technical indicator Stochastics is subject to analysis in Paper 6. Methods for optimization and evaluation of performance of trading rules are developed in Paper 5.
8
CHAPTER 1. INTRODUCTION
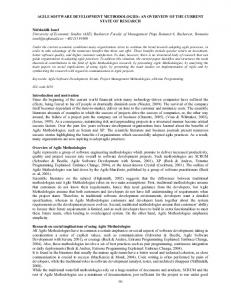
Chapter 2 A Software Environment A few software components have been developed as part of the research work presented in this thesis. While a lot of programming efforts have been spent on rather specialized tasks, a few general-purpose tools have also been developed. The purpose has been to simplify and improve the development and evaluation cycle when working with prediction algorithms for financial markets. An overview of these tools is shown in Figure 2.1. The next section of this chapter discusses a few general guidelines and design principles, and the rest of the chapter provides a brief and non-technical description of the parts that constitute the environment. The major parts have additional documentation supplied in Appendices 1 and 2.
ket
INTERFACING • Data Formatting • Data Cleaning
MARKET SIMULATION Performanc
a base: ock Prices aded Volumes TA EXTRACTION Functions Library: • Technical indicators • Statistical functions • Trend functions • Rank predictions CLASSIFICATION
Algorithm Library: • Neural Networks • LDA • kNN Performanc 53.5 53 52.5 52 51.5 51 50.5
eled Data Classification:
50
0
a from er Domains:
Figure 2.1: Software environment for stock-prediction research
0.1
0. 2
0.3
0.4
0.
10
CHAPTER 2. A SOFTWARE ENVIRONMENT
2.1
Software Design
This section contains some general notes and comments regarding the software developed for the papers in this PhD thesis. All programs have been written in the Matlab programming language. The total number of source code lines exceeds 30,000.
2.1.1
Choice of Programming Language I will say the only words I know you’ll understand Michelle, Lennon/McCartney
The choice of Matlab as programming language was guided by a number of (sometimes contradicting) requirements: • Development environment. Should provide modern debug facilities. Since the development, like many other academic software development projects, has been run by a single person, no special support for project management or version control was regarded necessary. • Availability of well documented software libraries for standardized tasks such as graphics and numerical computations. While most programming languages have a large amount of toolboxes and subroutine libraries developed by third parties, the availability of integrated toolboxes in Matlab was judged as a great advantage. This becomes clear while (if not before) collaborating and exchanging programs with other researchers. • Execution speed. Fast execution is always a nice quality and especially in timeconsuming applications such as the modeling performed in the CLS system and also in simulation programs such as the ASTA system. Matlab is hardly one of the fastest languages but the speed issue was not regarded as too important (see Design Guidelines below). Furthermore, several independent attempts to translate Matlab code to compiling languages ends up with the conclusion that Matlab runs even faster than the compiled code. • Availability of a system function that can execute a string containing a function call expressed in the language itself. This function was included in the design ideas from the beginning of the project because it makes it possible to create very powerful and interactive functionality. The user can enter function calls in the graphical user interface. This design idea has been used in both the CLS and the ASTA systems. This functionality is hard to achieve with a compiled language.
2.1. SOFTWARE DESIGN
2.1.2
11
Design Guidelines So please listen to me if you want to stay mine You Can’t Do That, Lennon/McCartney
Software design often involves a tradeoff between execution speed on the one hand and developing time on the other. A related tradeoff sometimes exists between execution time and correctness of the developed code. The fastest code is not seldom hard to understand and is furthermore difficult to adjust to fit the changes in specifications that often occur in research-related development. The situation is expressed in the programming proverb ”make it work before you make it fast”, which is indeed a good rule to follow, even when developing software for research work. The idea is, of course, that a slow code can be improved when the bottlenecks in a working system are identified. However, the constantly increasing CPU speeds have reduced the overall execution time to less than 20% of the original time during the 4 years that our development work has been going on. Execution time has therefore not been a primary objective in the programming work. Modularity, on the other hand, is an important design principle, not least in research-related software development. Since a clear specification of goals and means is seldom available in the early stages of such development, it is very important to identify objects and functions in a way that leaves open as many doors as possible for future extension and re-design. This is achieved by general design rules for modularity: natural and clearly defined tasks for all functions, few and natural in and out parameters and an object-oriented view on the program design in general.
2.1.3
User Interface I wanna be famous, a star of the screen, But you do something in between Drive My Car, Lennon/McCartney
The nowadays-mandatory Graphical User Interfaces (GUI:s) are of course important even when developing software for research purposes. This is especially true when developing general-purpose tools such as the CLS and ASTA systems. However, one major drawback of the GUI:s becomes extra annoying and impractical when working with research work. Since research-related programming, almost by definition, involves repeated runs of the same program, slightly modified programs and multiple data sets, a GUI often becomes both cumbersome and unsafe as a way to enter commands to the programs. The GUI:s are therefore duplicated by command-line counter parts. Using these command-line counter parts makes it very easy to write a “make” file with all program executions necessary for a certain paper or sub-project. In this way all results can be easily regenerated, for example with a new data set or perhaps after having fixed a bug in the programs. The extra effort invested for creating this functionality has saved a lot of time as well as irritation over having to repeat long series of manual program runs. The spin-off effects of a research paper is also doubtlessly increased. A whole new set of tables and graphs can be generated for a new data set or for another algorithm almost by the touch of a finger.
12
2.2
CHAPTER 2. A SOFTWARE ENVIRONMENT
Software Components
The software components illustrated in Figure 2.1 are briefly described below.
2.2.1
Interfacing I look at the floor and I see it needs sweeping Still my guitar gently weeps While My Guitar Gently Weeps, Harrison
Data from the market often contains errors, which can cause serious problems if entered without careful data preprocessing and error checking. Special caution should be exercised when handling missing values. Quite often missing values are replaced by zeroes in the data. While easily found in manual analyses, such errors tend to survive and corrupt an automatic system for data analysis. When working with fundamental data, special caution must be applied. Figures from company reports can not be assumed to be available for inclusion in prediction algorithms before the day they were made public. This is also the case for some official statistics, especially if they are labeled backwards in time as in ‘Unemployment rate dec2000’ published in the beginning of year 2001.
2.2.2
Market Simulation Without going out of my door, I can know all things on earth The Inner Light, Harrison
A main ingredient in the developed environment is a market simulator named ASTA, an Artifical Stock Trading Agent. The primary purpose of the ASTA system is to provide an easy-to-use environment for evaluating multi-stock trading algorithms. A key component in the system is a stable and realistic testbench, highlighting and helping to avoid the huge risks of data snooping involved in this kind of financial prediction. Performance is presented as annual figures and is always compared to benchmark strategies. The behavior of the agent is controlled by buy and sell rules, which can be composed interactively or written as user-defined functions. Various types of combinations of rules and data screening can be easily performed. The system can be used interactively, as a Windows-based development tool, or noninteractively, where a supplied objective function maps a trading strategy to a profit measure. The ASTA system has been extensively used in Papers 4, 5, and 6. A functional description is given in Paper 7 and a detailed User’s Reference Guide can be found in Appendix 1.
2.2. SOFTWARE COMPONENTS
2.2.3
13
Data Extraction The King was in the garden picking flowers for a friend who came to play Cry Baby Cry, Lennon/McCartney
One way of formulating stock prediction problems is as a classification problem, where an input vector X should be mapped to an output class C by a classifier that manages to separate data points by looking at the data features in the input vector X only. To interface the stock data to such a methodology, DASTA, a data extraction tool has been developed. The output class C is normally chosen as the sign of the return (i.e. the relative change in stock price) and the input vector X can be configured in a variety of ways using the extensive function library developed for the ASTA system. The DASTA program has been used as a research tool in the presented work, but has not yet been packaged as a product.
2.2.4
Classification I think a “No” will mean a “Yes” but it’s all wrong. That is I think I disagree Strawberry Fields Forever, Lennon/McCartney
As described in the previous section, stock prediction problems can be formulated as classification problems. CLS is a general-purpose system that can be used for benchmarking, testing, and developing of classification algorithms. A number of state-of-the-art algorithms are implemented: Single Perceptron, Multilayer Perceptron, k-nearest neighbor, and Discriminant analysis. The k-nearest-neighbor algorithm was utilized in Paper 3. The system has a number of modes to control the test procedure: Training/Test sets, N-fold cross validation, Sliding windows. The call to the classifier may include a variable and the classifier’s dependence of this variable can be easily illustrated in diagrams. The CLS system is thoroughly described in a User’s Guide in Appendix 2.
14
CHAPTER 2. A SOFTWARE ENVIRONMENT
Chapter 3 Summary of the Included Papers If you really like it you can have the rights It could make a million for you overnight Paperback Writer, Lennon/McCartney
This chapter contains a summary of the included papers and appendices. Full reprints can be found at the end of the thesis.
Paper 1 A general discussion about stock prediction issues. The problems with performance evaluation of near random-walk processes are illustrated with some examples and the consequences for algorithm development and performance evaluation are discussed. The prediction task is formalized. Existing benchmarks and testing metrics are surveyed, and some new measures are introduced.
Paper 2 The purpose of this paper is to examine the concept of trends and how it can be utilized for predictions of stock returns. A statistical analysis of stock data from the Swedish stock market over the period 1987—1996 shows how the trends are correlated to future returns. A k-nearest-neighbor algorithm identifies regions in the input space, where a correlation exists and improves prediction performance by issuing a “don’t know” answer where no correlation can be found.
Paper 3 Provides a description of a novel algorithm for systematic removal of outliers in the computation of covariance matrices for portfolio optimization. The algorithm gives a significant reduction in RMSE for the covariance matrices when tested on data with deliberately planted outliers and also for real stock data. The covariance matrices are also fed into a portfolio optimizer that maximizes risk-adjusted return. The algorithm gives higher risk-adjusted return than the naive prediction, even if the reduction of RMSE for the covariances is higher than the gain in portfolio optimization. This indicates that outliers in stock data do not affect the computation
16
CHAPTER 3. SUMMARY OF THE INCLUDED PAPERS
of optimal portfolios to any significant degree, at least not on the daily scale that is used in the algorithm. However, the algorithm shows a clear ability to detect and eliminate the effect of outliers in data and could be applied to other time-seriesrelated modeling problems with outliers in data.
Paper 4 Investigations regarding stock price predictability and market efficiency normally focus on individual time series. In this paper we introduce a rank measure that takes into account a large number of securities and grades them according to the relative returns. It turns out that this rank measure, besides being more closely related to a real trading situation, is more predictable than the individual returns. The rank is predicted with a linear model and the empirical results show hit rates around 60% for the sign of selected 1-day predictions. The predicted ranks are also used as a basis for a portfolio selection algorithm, which significantly outperforms the benchmark when tested on the Swedish stock market over the years 1993—1997. The result stands in strong contradiction to the Random Walk Hypothesis and also offers a strong indication that market inefficiencies exist and can be exploited with multi-stock predictions such as the presented rank approach.
Paper 5 When data mining financial data sets, it is very easy to jump into conclusions regarding trading rules that exhibit extremely profitable behavior, when tested on historical data. These misjudgments are often caused by the rules covering too few examples in the examined data. This paper deals with the problem in conjunction with nonconvex global optimization of trading rules by adding a constraint in the problem formulation. The effect is a regularization, where solutions covering too few examples are rejected. The modeling is performed with a sliding-window technique and generates different parameters for the optimized trading rules in each time window. Test results from the Swedish stock market show superior generalization ability in terms of risk-adjusted hit rates for the rules generated with the proposed method. Furthermore, the results show that the high hit rates achieved are to a large extent a result of the adaptive modeling with sliding windows.
Paper 6 Using the trading simulator ASTA as object function in a numerical optimization of parameters in the well-known technical indicator Stochastics. The optimization routine performs nonconvex global optimization of the annual profit above index and reaches almost the same parameter settings as the ones commonly used in actual trading with the Stochastics indicator.
17
Paper 7 Experiments in the ASTA environment for developing stock prediction algorithms are presented and discussed. Algorithms based on trading rules are evaluated by simulated trading using historical data from the Swedish stock market. One of the examples demonstrates how a “Buy the losers, Sell the winners” strategy can be implemented with the rank concept introduced in Paper 4. In addition to being a testbench for trading algorithms based on buy and sell rules, pure fixed-horizon predictions can also be developed and tested with ASTA. As one example, an investigation of the correlations between returns for international stock indexes is presented.
Appendix 1 A complete User’s Guide to the ASTA system, used in many of the other papers in the thesis. ASTA, an Artificial Stock Trading Agent is developed in the Matlab programming environment. The primary purpose of the system is to supply a stable and realistic testbench for the development of single- and multi-stock trading algorithms. The behavior of the agent is controlled by a high-level language, which is easily extendable with user-defined functions. The buy and sell rules can be composed interactively and various types of data screening can be easily performed, all within the Matlab language syntax. Apart from being a Windows-based testbench for trading algorithms, the system can be also run in batch mode, where a supplied objective function maps a trading strategy to a profit measure. This can be used to tune parameters or to automate the development of trading strategies. To improve the performance of a given algorithm, the data from the simulated trades can be output and externally analyzed.
Appendix 2 Describes the CLS system, which is a Matlab-based research tool for classification algorithms. It can be used for benchmarking, testing, and developing. The CLS system also implements a number of standard classification algorithms: Neural Networks, Discriminant, Linear regression, and K-nearest-neighbor. The evaluation of performance is critical when developing classification algorithms, especially those based on techniques with weak modeling that makes few assumptions about the data-generating process. Some applications, prediction of stocks to name one, present a delicate evaluation situation, since the expected performance for a working algorithm is hard to distinguish from what you get by tossing a coin. Other needs for proper evaluation of performance arise when new classification algorithms are being developed and should be tested against other methods on a large number of benchmark problems. This is of course a time-consuming process, often neglected in both research and real applications. The computation of performance can be done in a number of ways. The following options are implemented in the CLS system: Separate testing and data sets, Full cross validation, N-fold cross validation, and N runs with equally sized scrambled training and test sets. The CLS system was used with the K-nearest-neighbor algorithm described in Paper 3.
18
CHAPTER 3. SUMMARY OF THE INCLUDED PAPERS
It’s a thousand pages, give or take a few I’ll be writing more in a week or two Paperback Writer, Lennon/McCartney
Bibliography [1] M. Blume and I. Friend. The Changing Role of the Individual Investor. John Wiley and Sons, New York, 1978. [2] W. Brock, J. Lakonishok, and B. LeBaron. Simple technical rules and the stochastic properties of stock returns. Journal of Finance, 47:1731—1764, 1992. [3] K. Cuthbertson. Quantitative Financial Economics. Stocks, Bonds and Foreign Exchange. John Wiley and Sons, England, 1996. [4] W. DeBondt and R. Thaler. Does the stock market overreact. Journal of Finance, 40:793—805, 1985. [5] W. DeBondt and R. Thaler. Further evidence on investor overreaction and stock market seasonality. Journal of Finance, 42:557—582, 1987. [6] C. Dunis, editor. Forecasting Financial Markets. Exchange Rates, Interest Rates and Asset Management. Financial Economics and Quantitative Analysis. John Wiley & Sons, Chichester, 1996. [7] E. Fama. Efficient capital markets: A review of theory and empirical work. Journal of Finance, 25:383—417, 1970. [8] E. Fama and K. French. Permanent and temporary components of stock prices. Journal of Political Economy, 96:246—273, 1988. [9] E. F. Fama. Efficient capital markets: II. The Journal of Finance, 46(5):1575— 1617, December 1991. [10] S. Grossman and J. Stiglitz. The impossibility of informationally efficient markets. The American Economic Review, 66:246—253, 1980. [11] N. Jegadeesh. Evidence of predictable behavior of security returns. Journal of Finance, 45:881—898, 1990. [12] A. W. Lo and A. C. MacKinley. Stock market prices do not follow random walks: Evidence from a simple specification test. (Working Paper 5-87), 1987. [13] A. W. Lo and A. C. MacKinley. Stock market prices do not follow random walks: Evidence from a simple specification test. Review of Financial Studies, 1:41—66, 1988. [14] A. W. Lo and A. C. MacKinley. When are contrarian profits due to stock market overreaction? Review of Financial Studies, 3:175—205, 1990.
20
BIBLIOGRAPHY
[15] A. W. Lo and A. C. MacKinley. A Non-Random Walk Down Wall Street. Princeton University Press, Princeton, 1999. [16] A. W. Lo, H. Mamaysky, and J. Wang. Foundations of technical analysis: Computational algorithms, statistical inference, and empirical implementation. Technical Report Working Paper 7613, National Bureau of Economic Research, Cambridge, 2000. [17] D. Lowe and A. R. Webb. Time series prediction by adaptive networks: A dynamical systems perspective. IEEE Computer Society Press, 1991. [18] B. G. Malkiel. A random walk down Wall Street. Norton & Co, Inc, New York, 1990. [19] T. C. Mills. The Econometric Modelling of Financial Time Series. Cambridge University Press, Cambridge, 1993. [20] M. Osborne. Periodic structure in the Brownian motion of stock prices. Operations Research, 10:345—379, 1962. [21] J. Poterba and L. Summers. Mean reversion in stock prices: Evidence and implications. Journal of Financial Economics, 22:26—59, 1988. [22] M. Reinganum. The anomalous stock market behavior of small firms in January: Empirical tests for tax-loss selling effects. Journal of Financial Economics, 12(1):89—104, 1983. [23] P. Samuelson. Proof that properly anticipated prices fluctuate randomly. Industrial Management Review, 6:41—49, 1965. [24] W. Steiger. A test of nonrandomness in stock price changes. In P. Cootner, editor, The Random Character of Stock Market Prices, Cambridge, MA, 1964. MIT Press. [25] H. White. Economic prediction using neural networks: The case of IBM daily stock returns. In IEEE International Conference on Neural Networks, San Diego, pages 451—459, San Diego, 1988.
Paper 1
24
BIBLIOGRAPHY
Paper 2
44
BIBLIOGRAPHY
Paper 3
58
BIBLIOGRAPHY
Paper 4
78
BIBLIOGRAPHY
Paper 5
100
BIBLIOGRAPHY
Paper 6
118
BIBLIOGRAPHY
Paper 7
136
BIBLIOGRAPHY
Appendix 1
150
BIBLIOGRAPHY
Appendix 2