A class of 34 students studying âDigital Electronicsâ toward a degree of a practical engineer was ... KEY WORDS: Project-Based Learning; technology education.
C 2004) Journal of Science Education and Technology, Vol. 13, No. 3, September 2004 (�
Technology Project Learning Versus Lab Experimentation S. Waks1,2 and N. Sabag1
The Project-Based Learning (PBL) approach enables the student to construct knowledge in his/her own way. Piaget, the founder of constructivism, saw the development of intelligence as a process involving the relationship between brain maturity and individual experience. The technology PBL (TPBL) approach confronts the student with a personal problem taken from real life, which he/she has to solve by designing and building an artifact or instrument. It is assumed that by replacing dictated lab experimentation with project learning in an engineering course, the student will show an improvement in learning achievements. This paper describes the last stage (1 year) of a 3-year four-stage research in order to examine the achievements of students using the TPBL approach in comparison to those that carry out lab experiments. A class of 34 students studying “Digital Electronics” toward a degree of a practical engineer was randomly divided into two training groups. During one semester, the experimental group used the TPBL approach and the control group used lab experiments. The groups’ achievements were monitored during 1 year. The research findings reveal that the experimental group gained higher scores. KEY WORDS: Project-Based Learning; technology education.
INTRODUCTION
younger department—Software and/or Information Technologies. The learning materials in electronics department are no longer challenging (sometimes even boring) for the students (Barak, 2002). Students’ motivation to optimize their learning efforts in order to achieve high scores so as to enter the higher education engineering route in the future, drives them to prefer to take mathematics and physics courses which offer (in Israel) a bonus of 30% rather than electronics, which awards only 25% and requires more learning hours. (One important criterion for entering university engineering studies is the matriculation average score. This score is weighted according to the number of learning units and the prestige of the discipline. For example, the 5-unit mathematics weight equals to the student score in mathematics multiplied by 5 and by 1.3.) Such a situation is described by Hill (1999) in his article Signs of Distress in Technology Education Programs. Some of the early warning signs are the inactivity of personnel, outdated curricula and facilities that
An increasing concern is expressed among the community of electronics teachers in Israel. According to them, electronics education is in a crisis. A brainstorming on this issue was conducted involving 30 teachers. It turned out that high achievers, which used to compete for entering the electronics department in prestigious high schools, no longer need to make an effort in order to be admitted to electronics studies. On the contrary, the teachers are those who have to look for good students. The students’ achievements are no longer as high as they used to be and the motivation to learn is questionable. Among the reasons for this situation we can mention the competition forced by a 1 Department
of Education in Technology and Science, Technion—Israel Institute of Technology, Haifa 32000, Israel. 2 To whom correspondence should be addressed; e-mail: waks@tx. technion.ac.il.
333 C 2004 Plenum Publishing Corporation 1059-0145/04/0900-0333/0 �
334 increase additional difficulties in attracting students, budget cuts, and lack of respect for the program. Hill suggests that problem solving and planning (inherent in Technology Problem-Based Learning— TPBL) are essential for improving the program. Grill (2002) complains about the difficulty that Australian hi-tech industry is having in filling many jobs. According to Grill (2002) the problem starts in schools that largely omit any electronics from their curriculum. An attempt to locate teaching/learning methods that might raise the interest of students in studying electronics is brought in this paper. One attractive idea was to integrate project-based learning into the curriculum. This paper describes findings of the last stage of 3-year four-stage study investigating an electronics course taken by engineering technology students, using the Technology Project-Based Learning approach. The first three stages of this research involved mainly qualitative assessing means. In these stages population of about 150 students from eight high schools were engaged in Technology Projects-Based Learning, after which they had to take a matriculation examination on their own projects. The goal of this study was to examine the influence of training (in the field of Digital Electronics) through projects, on student achievements, in comparison to the effect of traditional training (through dictated lab experiments).
Waks and Sabag too in papers concerning Project-Based Learning (Barlex, 1994; Black and Harisson, 1994; Johnson, 1997; Waks, 1997; Waks and Merdler, 2003). Waks and Helps (2004) investigated a situation where all students were required to select, design, implement, present, and document a project in the discipline as capstone experience in their forth year of BSc studies in engineering technology. The article Using Real-World Projects to Help Students Meet High Standards in Education and the Workplace (ERIC, 2000) claims that students benefit most from projects that are planned jointly by academic and career/technical teachers. It enables teachers to align their learning objectives to reflect “real life” more accurately, and motivate students achieve in both academic and career/technical classrooms. Bennett (2002) discovered that design (one characteristic of TPBL) helps children to gain technological literacy. Rasinen (2003) investigated the curriculum of technology education in six countries (United States, Australia, England, The Netherlands, Sweden, and France). He found out that in all these countries, learning how to plan, produce, and evaluate is emphasized. All of these characteristics are inherent in TPBL. These sources and those mentioned in the following paragraph were used as the theoretical basis of project learning approach investigated in our study.
The Aspect of Constructionism THEORETICAL FOUNDATION OF PROJECT LEARNING “Benefits of learning by doing have long been touted; the roots of the idea go back to John Dewey” (Krajcik et al., 1994). According to Dewey’s philosophy the experience is the only tool through which humans explore the world (Dewey, 1944). According to various research studies, a significant part of learning should be carried out within authentic environments relevant to students (De Vries and Tamir, 1997; Fosnot, 1995; Johnson, 1997; Salomon and Perkins, 1996; Verner and Hershko, 2003). Others claim that for constructing knowledge and for learning transfer there must be a linkage between learning principles and their applications (Chen, 1978; Dewey, 1944; Perkins and Swartz, 1992; Solomon and Perkins, 1996). The creativity aspect is mentioned
In the foreword to Harel’s (1991) book, Papert (in Hard, 1991) defines the term “constructionism.” It puts together the psychological term “constructivism” and the word “construction.” In putting these two words together Papert means that building the structure of knowledge (“in the mind”) goes especially well when the learner is engaged in building material structures (“in the real world”) as children do in construction sets. Technology projectbased activities do lead to applications which may contribute to the construction of knowledge in the mind of the student, as expected by the spirit of constructivism. Feuerstein (2000) follows in the footsteps of his mentor Piaget that the development of intelligence depends on three factors: genetic, neurological maturity, and human activity. Piaget regarded the development of intelligence as dependent on the
Technology Project Learning Versus Lab Experimentation linkage between brain maturity and the activity and experiences of the individual. Without these experiences Piaget found no way of explaining growth and brain development, which enables the shift from one developmental stage to the next. Feuerstein also maintains that the student needs a mediating factor (such as a teacher) in order to learn. The current research relates to student learning in an environment of self-experimentation in addition to lectures. Von Glasersfeld (1995) says that constructivists endeavored to break away from the paradox associated with the requirement that knowledge represents an independent world and admits that knowledge represents something that is far more important to us, namely what we can do in our experimental world. He also suggests that teachers should bring examples from the students’ field of experience. Salomon and Perkins (1996) claim that acquiring knowledge is an active occupation on the part of the learner, and that the learner has to produce a real product in order to make the experiment significant (as happens in Project-Based Learning).
METHODOLOGY The Research Question To what extent do achievements in “Digital electronics” of students improve when learning in a project environment compared to the achievements of students who conduct structured laboratory experiments? Research Groups The research groups included 34 second-year students studying for their engineering technology degree according to the curriculum of the Institute for Technological Training—Ministry of Labor, Israel. The class was randomly divided into two lab groups, which learned the theory (Digital Electronics) together. These students have the same academic and social background like the other students studying toward the degree of practical engineering in electronics in Israel; therefore we can treat them as a representing sample (Sabag, 2002). One group in-
335
cluded 16 students and the other group included 18 students. The students’ allocation into groups was done by the head of electronics department (not one of the researchers). The 16 students group was offered to work on projects while the other carried out the classical laboratory experiments in the framework of the course “Digital Electronics.” Two students out of 16 chose to have laboratory experiments and they were allowed to follow their choice. The other 14 had project work. This comprised the experimental group. The remaining 20 students, conducting dictated laboratory experiments, comprised the control group. We believe that the effect of two students’ decision not to have project, on the random way of the group selection is small. The groups had the same lectures, the same homework, the same exams, and the same lecturer. All their activities were similar except of lab experimentation. Although the division into groups was almost random, a comparison of the students’ achievements was made for the two groups before the lab experimenting started; to make sure that the students of the experimental group did not have higher achievements than those of the control group prior to the experiment. The students’ mean grades in “Digital Electronics 1” were compared (details of the way the grades were given will follow) and the mean grades in 12 theoretical scientific subjects were compared as well. The results of the comparison are presented in Table I. Table I reveals that the mean grade in “Digital Electronics 1” tends slightly in favor of the control group and in the other 12 courses the achievements are slightly lower. A t test was performed in order to compare between the groups prior to the lab experimentation. The results show that these differences are not statistically significant. Therefore, it can be stated that the groups were not different in their achievements.
Table I. Groups’ Average Achievements Before Treatment 12 courses Group Experimental (n = 14) Control (n = 20) p value
Mean grades
SD
79.9 9.1 78.2 7.5 0.26
Digital Electronics 1 Mean grades
SD
66 72
20 17 0.17
336
Waks and Sabag
The Activity The students of the experimental group worked on a project of about 40 h instead of the laboratory experiments, which are defined in the syllabus. The project activity was not included in the syllabus but every single project included topics from the syllabus. The laboratory experiments included fourteen 3-h sessions. The students of the control group were asked to build an electronic circuit in each experiment (for instance, LPF—Low Pass Filter: the circuit passes “low” frequencies fairly well, but attenuates “high” frequencies; HPF—High Pass Filter: the circuit passes “high” frequencies fairly well, but attenuates “low” frequencies, or multi-vibrators: these are regenerative circuits that are used in timing applications). Their activities were mainly measuring voltages and waveforms than fill a report explaining the measured results and compare to the theoretical expected results. The Content Realm of Experimentation (Laboratory or Project) The content realm is that of “Digital Electronics,” which was studied for three consecutive semesters according to the curriculum, which included: 1. “Digital Electronics 1” (studied in semester 2 of the whole program). The main issues are basic waveforms (such as step function, square wave, triangle wave, and impulse), LPF and HPF response to various waveform, transient and steady state. The mean grade of this semester was used as a pretest score and will be henceforth marked as test 1. 2. “Digital Electronics 2” (studied in semester 3, in which our study was carried out). The main topics were chopping circuits, clamping circuits, and logic families. 3. “Digital Electronics 3” (studied in semester 4, the follow-up period). The main subjects were multi-vibrators, wave generator, digital to analog converters, analog to digital converters, and voltage to frequency converters. Study Phases of the Experimental Group In the course of their work on the project, the students were required to go through the following
stages: 1. Selecting a topic and characterizing the system it represents. Students were allowed to choose a topic from a list or to offer a topic of their own initiative. 2. Defining the tasks in the team. 3. Gathering information from the Internet (searching according to key words). 4. Preparing a block diagram of the system. 5. Examination of the electronic circuit in a simulation (e.g., EWB software package). 6. Preparing production documents (a list of components, wiring, and an assembly draft— layout) before the actual assembly. 7. Assembling the system (construction with real components) and systematic tracing of malfunctions—trouble shooting. 8. Each process was preceded by a teacher– students discussion in order to set the criteria for assessing the project. When the project activity was completed, the students determined the final grade according to preset criteria. 9. The entire process was documented including the students’ various project activities. At the end the students were asked to hand in their project booklet. Project topics related to electronic applied circuits such as car alarm; bio control system; wave generator (sinusoidal, square, and triangular wave shapes).
The Research Program For testing the impact of the Technology Project-Based Learning approach on students’ achievement a Pretest–Posttest Control Group Design experiment (True Experimental Design) was carried out (Campble and Stanley, 1963). The randomly assigned experimental and control groups were given the same “Digital Electronics 1” pretests. The experimental group conducted experiments by projects, and the control group conducted traditional—structured laboratory experiments. During the research experiment time, both groups were given the same “Digital Electronics 2” tests. MANOVA (Green et al., 1997) tests with repeated measures aiming at assessing whether the differences between the mean grades of the two groups were statistically significant.
Technology Project Learning Versus Lab Experimentation
337
Achievement Tests
Table III. Internal Consistency and Reliability of the Tests in the Follow-Up Period
The pretest grade (marked as test 1) was determined according to the calculated average of two tests that were held in the course of the second semester, in which the students studied “Digital Electronics 1.”
Test no. Test 4 Test 5
Between judges reliability
Alpha Cronbach
0.87 0.90
0.81 0.78
The reliability of the judges was examined, and alpha Cronbach was calculated for each of the tests. The findings are presented in Table III.
Tests Taken During the Experiment and Follow-Up Periods In the course of the third semester (the experiment period), the period during which the experimental group worked on the projects and the control group conducted laboratory experiments in “Digital Electronics 2,” a mid-semester test (test 2), and a final test (test 3) were given in “Digital electronics 2.” Both tests were planned according to a bi-dimensional table to assure validity of contents. Questions were classified according the Plants’ taxonomy (Plants et al., 1980, pp. 21–34), which is recommended in the area of technology (Waks, 1995). The tests emphasized questions on the level of “strategy” and “interpretation.” The tests were examined by two experts and experienced teachers of Digital Electronics (expert validation). Two independent testers corrected the tests, and high correlations were found between the grades given by the two testers. An alpha Cronbach coefficient was calculated for both tests to examine internal consistency. The findings are presented in Table II. In semester 4 the work on the projects ceased, but follow-up on the students’ achievements continued. Two tests were given in that semester in “Digital Electronics 3”: a mid-semester (test 4) and a final test (test 5). Both tests were devised according to a bidimensional table to assure validity of contents and were validated by experts. Questions were classified according the Plants’ taxonomy (Plants et al., 1980, pp. 21–34). For example, a diagram of a waveform circuit was given. The students were asked to analyze the circuit, to draw the waveforms it generates and calculate the voltages and times of the extreme points of the waveforms.
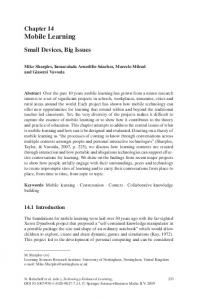
RESULTS Student Achievements in the Treatment Period The mean grades of both groups in the three tests (test 1, test 2, and test 3) are described in Fig. 1. Figure 1 reveals that the achievements of the experimental group, which were lower than those of the control group before the treatment, are higher than those of the control group (during the experiment and after it). To examine if the phenomenon is statistically significant, MANOVA with repeated measures was calculated (Green et al., 1997). The first factor (independent variable) is the group (experimental or control), and the dependent variables are the results of the three tests (test 1, test 2, and test 3). The findings were found to be statistically significant (p = 0.05). For the complete MANOVA outcomes see Appendix 1. That means that the achievements of the students in the experimental group are indeed higher than those of the control group as a result of the project experimentation.
Table II. Internal Consistency and Reliability of Tests in the Treatment Period Test no. Test 2 Test 3
Between judges reliability
Alpha Cronbach
0.95 0.92
0.72 0.87
Fig. 1. Students’ achievements during the experimental and follow-up periods.
338
Waks and Sabag Table IV. Mean Grades and Significance of the Difference Between Groups Average and standard deviation of tests Test 1
Test 2
Test 3
Test 4
Test 5
Group
Average
SD
Average
SD
Average
SD
Average
SD
Average
SD
Control group Experimental group Experimental minus control scores p value
72 66 −6
20 18
59 68 9
20 20
51 61 10
29 18
65 76 11
30 22
46 61 15
29 17
0.005
0.005
0.016
Student Achievements in the Follow-Up Period
0.003
veal that the gap between the groups did not decrease. It can be seen that it even increased slightly in the last test.
One of the following results was to be expected during the follow-up period: 1. The experimental group would continue to improve in comparison with the control group. To examine this possibility, one-way MANOVA with repeated measures was conducted, which included all five tests. The result was not significant (p = 0.12), which means that it cannot be argued that the experimental group continued to improve after the “treatment” period. 2. The experimental group would maintain the gap in grades in comparison with the control group. To examine the second possibility, we have to look at the mean grades of both groups in all five “Digital Electronics” tests, which are presented in Fig. 1 and Table IV. ANOVA was calculated for each of the tests in comparison with the pretest. Table IV presents the mean grades of both groups and the results of the statistical analysis. The improvement of the experimental group’s achievements in each test compared to pretest is significantly better than the control group’s. 3. The experimental group would lose the gap it achieved in comparison with the control group. Figure 1 and the results in Table IV re-
The Impact of Experimentation Via Projects on Average Students The above-presented research findings were obtained in spite of the fact that the control group included four outstanding students (with an average score of over 90), and in the experimental group there was only one such excellent student (the control group had three students with grades below 10 out of 100 at least in one of the research exams, and there was only one such student in the experimental group). It would be interesting to find out how experimentation via projects affects the average students—that is to say, students who are neither excellent nor failing. A comparison of the achievements of average students from both groups was made in order to look at this issue. The findings are presented in Table V. To find out if the phenomenon is statistically significant, MANOVA (Green et al., 1997) with repeated measures was calculated. The first factor (independent variable) is the group (experimental or control), and the dependent variables are the results of the three tests (test 1 to test 3). The findings were found to be statistically significant, like those of the entire class (p = 0.05). For the complete MANOVA
Table V. A Comparison Between Group Scores of Average Students Average and standard deviation of tests Test 1 Group Control group (n = 12) Experimental group (n = 13) Experimental minus control mean grades p value
Test 2
Test 3
Test 4
Test 5
Average
SD
Average
SD
Average
SD
Average
SD
Average
SD
70 66 −4
13 14
56 71 15
13 18
45 60 15
25 14
65 79 14
18 12
46 60 14
19 16
0.02
0.07
0.03
0.06
Technology Project Learning Versus Lab Experimentation outcomes see Appendix 2. That is the case although the mean difference between the groups was bigger and the variance of each group was smaller, in comparison with the results of the entire population of students in the class. The reason for that is the removal of the excellent students and the failing ones, which reduced the researched population from 34 students to 25 students.
DISCUSSION One major problem is raised when it comes to TPBL achievements assessment. From one side the TPBL approach dictates an open atmosphere. Such an atmosphere is crucial for the student to speculate and learn from mistakes. On the other hand measuring achievements demands the use of achievement tests, which cause tension and anxiety. The dilemma was solved by using two assessment methods for two different grades. For the experimentation activity we used peer assessment. The experimental group and the teacher agreed upon a set of criterions to use for assessing the project work. Every couple of students presented its project in front of the experimental group members, which assessed the project. These grades are not part of the research data. But to answer the research question (To what extent do achievements in “Digital Electronics” of students improve when learning in a project environment compared to the achievements of students who conducted structured laboratory experiments?) we used achievement tests as explained in this paper. The research findings suggest that the achievements of the experimental group are significantly higher than those of the control group. Here we
339
have a case where both the experimental and control groups had a linkage between learning principles and their applications. Both experimentation methods contribute to constructing knowledge and learning transfer as mentioned above in this paper. Even so the experimental group achieved higher grades than did the control group. Therefore, we may come to a conclusion that learning in a project environment might contribute to the improvement of students’ achievements. The gap between the achievements of the students of average groups is greater than the gaps between the two entire groups. This leads to the conclusion that the project activity contributes to the average student more than to the high or low achievers. The advantage of the experimental group students may be accounted for by the constructionism approach to learning. It is, indeed, true that the students of the control group conducted experiments, but project experiments that include design activities and repairing malfunctioning circuits turned out to be more effective when student achievements are considered. These finding may support the “constructionism” theory. APPENDIX 1: MANOVA OUTCOMES FOR THE ENTIRE STUDENTS POPULATION General Linear Model
Between-Subjects Factors N GROUPE
1.00 2.00
Multivariate Tests Effect Intercept
GROUPE
a Exact
Pillai’s trace Wilks’ lambda Hotelling’s trace Roy’s largest root Pillai’s trace Wilks’ lambda Hotelling’s trace Roy’s largest root
statistic. Intercept + GROUPE.
bDesign:
Value
F
Hypothesis df
Error df
Sig.
0.941 0.059 15.999 15.999 0.222 0.778 0.285 0.285
159.987 159.987 159.987 159.987 2.850 2.850 2.850 2.850
3.000 3.000 3.000 3.000 3.000 3.000 3.000 3.000
30.000 30.000 30.000 30.000 30.000 30.000 30.000 30.000
0.000 0.000 0.000 0.000 0.054 0.054 0.054 0.054
20 14
340
Waks and Sabag Tests of Between-Subjects Effects Source
Dependent variable
Corrected model
Test 1 Test 2 Test 3 Test 1 Test 2 Test 3 Test 1 Test 2 Test 3 Test 1 Test 2 Test 3 Test 1 Test 2 Test 3 Test 1 Test 2 Test 3
Intercept
GROUPE
Error
Total
Corrected total
Type III sum of squares
df
Mean square
F
Sig.
329.086 917.850 812.975 157239.086 131069.850 102632.622 329.086 917.850 812.975 11848.679 12626.414 20656.907 177102.000 144861.000 124100.000 12177.765 13544.265 21469.882
1 1 1 1 1 1 1 1 1 32 32 32 34 34 34 33 33 33
329.086 917.850 812.975 157239.086 131069.850 102632.622 329.086 917.850 812.975 370.271 394.575 645.528
0.889 2.326 1.259 424.659 332.179 158.990 .889 2.326 1.259
0.353 0.137 0.270 0.000 0.000 0.000 0.353 0.137 0.270
= 0.027 (adjusted R2 = −0.003). = 0.068 (adjusted R2 = 0.039). c R2 = 0.038 (adjusted R2 = 0.008). a R2 bR2
APPENDIX 2: MANOVA OUTCOMES FOR THE INTERMEDIATE STUDENTS General Linear Model
Between-Subjects Factors N GROUPE
1 2
13 12
Multivariate Tests Effect Intercept
GROUPE
a Exact
Pillai’s trace Wilks’ lambda Hotelling’s trace Roy’s largest root Pillai’s trace Wilks’ lambda Hotelling’s trace Roy’s largest root
statistic. Intercept + GROUPE.
bDesign:
Value
F
Hypothesis df
Error df
Sig.
0.975 0.025 39.227 39.227 0.304 0.696 0.438 0.438
274.586 274.586 274.586 274.586 3.063 3.063 3.063 3.063
3.000 3.000 3.000 3.000 3.000 3.000 3.000 3.000
21.000 21.000 21.000 21.000 21.000 21.000 21.000 21.000
0.000 0.000 0.000 0.000 0.050 0.050 0.050 0.050
Technology Project Learning Versus Lab Experimentation
341
Tests of Between-Subjects Effects Source Corrected model
Intercept
GROUPE
Error
Total
Corrected total
Dependent variable Test 1 Test 2 Test 3 Test 1 Test 2 Test 3 Test 1 Test 2 Test 3 Test 1 Test 2 Test 3 Test 1 Test 2 Test 3 Test 1 Test 2 Test 3
Type III sum of squares
df
Mean square
F
Sig.
84.776 1597.440 1439.016 115164.936 99066.240 69647.016 84.776 1597.440 1439.016 4103.224 5554.000 9495.224 119788.000 105371.000 79893.000 4188.000 7151.440 10934.240
1 1 1 1 1 1 1 1 1 23 23 23 25 25 25 24 24 24
84.776 1597.440 1439.016 115164.936 99066.240 69647.016 84.776 1597.440 1439.016 178.401 241.478 412.836
0.475 6.615 3.486 645.540 410.249 168.704 0.475 6.615 3.486
0.498 0.017 0.075 0.000 0.000 0.000 0.498 0.017 0.075
= 0.020 (adjusted R2 = −0.022). = 0.223 (adjusted R2 = 0.190). c R2 = 0.132 (adjusted R2 = 0.094). a R2 bR2
REFERENCES Barak, M. (2002). Learning good electronics or coping with challenging tasks: The priorities of excellent students. Journal of Technology Education 14: 20–34. Barlex, D. (1994). Organizing project work. In Banks, F. (Ed.), Teaching Technology, Routledge, London. Bennett, D. T. (2002). Themes in technology education research. Project 2061: American Association for the Advancement of Science (AAAS) Technology Education Research Conference. Retrieved from http://www. project2061.org/meeting/technology/Bennett/Bennett.htm Black, P., and Harisson, G. (1994). Technological capability. In Banks, F. (Ed.), Teaching Technology, Routledge, London. Campble, D. T., and Stanley, J. C. (1963). Experimental and Quasi-Experimental Designs for Research, Rand McNally, Chicago. Chen, D. (1978). Design Develop and Implementation of Curriculum Unit 7, The Open University of Israel, Tel Aviv. De Vries, M. J., and Tamir, A. (1997). Shaping concepts of technology: What concepts and how to shape them. International Journal of Technology and Design Education 7: 3–10. Retrieved from http://www.kluweronline.com/issn/0957-7572/ Dewey, J. (1944). Democracy and Education, Macmillan, New York. ERIC. (2000). Using Real-World Projects to Help Students Meet High Standards in Education and the Workplace. Site Development Guide #11. High Schools That Work. (ERIC ISSUE: RIESEP2001). Southern Regional Education Board (ERIC NO: ED451420). Feuerstein, R. (2000). Piaget and Feuerstein—Points of Diverse and Agreement. Retrieved from http://www.education.gov.il/ preschool/nekudot1.htm. Fosnot, C. T. (1995). “Constructivism: A Psychological Theory of Learning.” In Fosnot, C. T. (ed), Constructivism Theory, Perspective and Practice. (pp. 8–33). Teacher College, Columbia University.
Green, S. B., Salkind, N. J., and Akey, T. M. (1997). Using SPSS for Windows: Analyzing and Understanding Data, Prentice Hall, New Jersey. Grill, R. (2002). Remedies for Crisis in Electronics Industry/Education. South Australian Microprocessor Group Incorporated. Retrieved from http://samg.yi.org/meeting.php? meetingIndex = 19. Harel, I. (1991). Children Designers, Ablex Publishing Corporation New Jersey, Norwood, NJ. Hill, C. E. (1999). Signs of distress in technology education programs. The Technology Teacher. International Technology Education Association, Reston, pp. 21–26. Johnson, D. S. (1997). Learning technological concepts and developing intellectual skills. International Journal of Technology and Design Education 7: 161–180. Krajcik, J. S., Blumenfeld, P. C., Marx, R. W., and Soloway, E. (1994). A collaborative model for helping middle grade science teachers learn project-based instruction. The Elementary School Journal 94: 483–497. Perkins, D., and Swartz, R. (1992). The nine basics of teaching thinking. In Csta, A. L., Bellanca, J. L., and Fogarty, R. (Eds.), If Minds Matter: A Forward to Future, Skylight Publishing, Inc. Palatine, Illinoise. Plants, H. L., Dean, R. K., Sears, J. T., and Venable, W. S. (1980). A taxonomy of problem solving activities and its implication for teaching. In Lubkin, J. L. (Ed.), The Teaching of Elementary Problem Solving in Engineering and Related Fields, American Society for Engineering Education, Washington, DC, pp. 21–34. Rasinen, A. (2003). An analysis of the technology education curriculum of six countries. Journal of Technology Education 15: 31–47. Sabag, N. (2002). Characteristics of Project Based Learning in Electronics, Doctoral dissertation (in Hebrew; Abstract in English), Technion—Israel Institute of Technology, Haifa, Israel. Salomon, G., and Perkins, D. (1996). Learning in wonderland: What do computers really offer education? In Kerr, S. T.
342 (Ed.), Technology and the Future of Schooling (Vol. Ninetyfifth yearbook of the National Society for the study of Education, Part II), University of Chicago Press, Chicago, Illinoise, pp. 111–130. Verner, I. M., and Hershko, E. (2003). School graduation project in robot design: A case study of team learning experiences and outcomes. Journal of Technology Education 14(2): 40– 54. Von Glasersfeld, E. (1995). A constructivist approach to teaching. In Steffe, L. P., and Gale, J. (Eds.), Constructivism in Education, Lawrence Erlbaum Associates, Hillsdale.
Waks and Sabag Waks, S. (1995). Curriculum Design—From an Art Towards A Science, Tempus Publication, Oxford. Waks, S. (1997). Lateral thinking and technology education. Journal of Science Education and Technology 6: 245–255. Waks, S., and Helps, C. R. G. (2004). Dimensions in electronics education change. The International Journal of Engineering Education 20(1): 83–90. Waks, S., and Merdler, M. (2003). Identifying creativity factors associated with final project work in technology/engineering education. Research in Science and Technological Education 14: 83–90.