Temperature regulates NF-κB dynamics and function through timing of A20 transcription C. V. Harpera,1, D. J. Woodcockb,c,1, C. Lama, M. Garcia-Albornozd, A. Adamsona, L. Ashalla, W. Rowea, P. Downtona, L. Schmidta, S. Weste, D. G. Spillera, D. A. Randb,c,2, and M. R. H. Whitea,2 a Systems Microscopy Centre, Division of Molecular and Cellular Function, School of Biology, Faculty of Biology, Medicine and Health, Manchester Academic Health Sciences Centre, University of Manchester, M13 9PT Manchester, United Kingdom; bMathematics Institute, University of Warwick, CV4 7AL Coventry, United Kingdom; cZeeman Institute for Systems Biology and Infectious Epidemiology Research, University of Warwick, CV4 7AL Coventry, United Kingdom; d Division of Evolution and Genomic Sciences, School of Biology, Faculty of Biology, Medicine and Health, Manchester Academic Health Sciences Centre, University of Manchester, M13 9PT Manchester, United Kingdom; and eInstitute of Integrative Biology, University of Liverpool, L69 7ZB United Kingdom
Edited by Ronald N. Germain, National Institutes of Health, Bethesda, MD, and approved April 27, 2018 (received for review March 7, 2018)
NF-κB
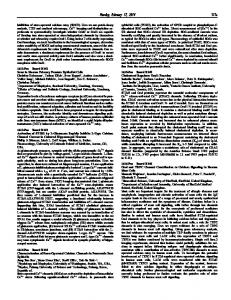
by measuring both the oscillatory dynamics and the downstream gene expression response. Results To investigate the effect of temperature on NF-κB dynamics, we used time-lapse live-cell microscopy to study cytoplasmic to nuclear oscillations of NF-κB across the physiological temperature range, 34 °C to 40 °C. Bacterial artificial chromosomes expressing human RelA and IκBα fused to fluorescent proteins were generated to enable detection of both the dynamics of RelA translocations and IκBα degradation and resynthesis, allowing expression at more physiological levels. The RelA and IκB dynamics were observed to have regular opposite phases (Fig. 1 A and B). A rapid temperature shift from 37 °C to 40 °C caused an immediate decrease in period of RelA translocation from ∼100 min to ∼74 min in TNFα-treated (10 ng/mL), transiently Significance
| temperature | A20 | transcription | dynamics
Inflammation is often accompanied by temperature change, but little is known about the role of temperature in the inflammatory response. We show that physiologically relevant temperature changes significantly perturb NF-κB dynamics following TNFα stimulation in single cells. Using experimentation informed by mathematical modeling, we found that these changes were mediated, at least in part, through the key feedback gene TNFAIP3/A20. Curtailing A20 expression removed temperature sensitivity across the fever range (37 °C to 40 °C). Gene expression was generally unaffected between these temperatures, although a select set of NF-κB−regulated genes was up-regulated at early time points. These genes were predominantly involved in inflammation, signaling, and cell fate. The cellular response to inflammation may therefore be mechanistically and functionally regulated by temperature.
T
he nuclear factor kappa B (NF-κB) signaling pathway is a key mediator of the immune system, which regulates cell fate as well as stress and inflammatory responses. It responds to diverse stimuli, including viral and bacterial pathogens, free radicals, cytokines, and growth factors (1), and can process information from multiple input signals to regulate the transcription of >500 genes (1, 2). In response to persistent cytokine signaling, the NF-κB transcription factor complex (typically RelA/p65:p50) can oscillate repeatedly between the cytoplasm and nucleus with a period of ∼100 min (3–5). This is regulated by a set of negative feedback loops, notably via the genes expressing IκBα, IκBe, and A20 proteins. The dynamics, and particularly frequency, of NF-κB oscillations may be one component that regulates the pattern of target gene expression and the physiological response (3, 6–8). Changes in temperature alter the rates of all biological– chemical reactions. The ability of mammals to regulate temperature is an important aspect of survival. In humans, there are natural physiological temperature changes involved in day−night (36.4 °C to 37.5 °C) (9), menstrual (∼0.5 °C increase after ovulation) (10), and (more variable) seasonal temperature cycles, as well as between peripheral tissues (∼34 °C) and core body temperature (∼37 °C). Temperature also increases with fever (typically 37 °C to 40 °C). The direct functional consequences of these temperature changes are largely unclear, but there has been a growing body of evidence that the efficacy of the immune response may be modulated by temperature (11, 12). Despite the long-established associations between temperature, fever, and inflammation, as well as between inflammation and NF-κB signaling, it remains unknown how temperature affects the NF-κB system. We investigated how temperature change in the physiological range affects the NF-κB system response, www.pnas.org/cgi/doi/10.1073/pnas.1803609115
Author contributions: C.V.H., D.J.W., D.A.R., and M.R.H.W. designed research; C.V.H., D.J.W., C.L., L.A., P.D., L.S., S.W., and D.A.R. performed research; D.J.W. and A.A. contributed new reagents/analytic tools; C.V.H., D.J.W., M.G.-A., and W.R. analyzed data; C.V.H., D.J.W., D.G.S., D.A.R., and M.R.H.W. wrote the paper; D.G.S. managed microscopy facility and assisted with microscopy experiments; D.A.R. jointly directed project with a focus on modeling and bioinformatics; and M.R.H.W. initiated and jointly directed project with a focus on experimental work. The authors declare no conflict of interest. This article is a PNAS Direct Submission. This open access article is distributed under Creative Commons Attribution-NonCommercialNoDerivatives License 4.0 (CC BY-NC-ND). Data deposition: Gene expression data reported in this paper have been deposited in the ArrayExpress database, https://www.ebi.ac.uk/arrayexpress (accession no. E-MTAB-5158). 1
C.V.H. and D.J.W. contributed equally to the work.
2
To whom correspondence may be addressed. Email:
[email protected] or mike.
[email protected].
This article contains supporting information online at www.pnas.org/lookup/suppl/doi:10. 1073/pnas.1803609115/-/DCSupplemental.
PNAS Latest Articles | 1 of 7
SYSTEMS BIOLOGY
NF-κB signaling plays a pivotal role in control of the inflammatory response. We investigated how the dynamics and function of NF-κB were affected by temperature within the mammalian physiological range (34 °C to 40 °C). An increase in temperature led to an increase in NF-κB nuclear/cytoplasmic oscillation frequency following Tumor Necrosis Factor alpha (TNFα) stimulation. Mathematical modeling suggested that this temperature sensitivity might be due to an A20-dependent mechanism, and A20 silencing removed the sensitivity to increased temperature. The timing of the early response of a key set of NF-κB target genes showed strong temperature dependence. The cytokine-induced expression of many (but not all) later genes was insensitive to temperature change (suggesting that they might be functionally temperature-compensated). Moreover, a set of temperature- and TNFα-regulated genes were implicated in NFκB cross-talk with key cell-fate–controlling pathways. In conclusion, NF-κB dynamics and target gene expression are modulated by temperature and can accurately transmit multidimensional information to control inflammation.
transfected SK-N-AS cells (Fig. 1 C and D). TNFα treatment at different (constant) incubation temperatures (34 °C, 37 °C, and 40 °C) showed pronounced modification of the oscillation period (Fig. 1 E–G). In both cell lines and primary cells, there were significant (approximately linear) decreases in period from 34 °C to 37 °C to 40 °C (Fig. 1 H–J), and also down to 28 °C (SI Appendix, Fig. S1). The Q10 temperature coefficient [a measure of the temperature sensitivity of a process due to an increase of 10°, it is calculated as Q10 = (R2/R1)10/(T2 − T1), where R1 and R2 are the oscillation frequencies at temperatures T1 and T2, respectively; temperatures are given in kelvin] was measured as being between ∼2.3 and 3.1 in the different experimental systems. These data suggest that NF-κB oscillation frequency is very temperature sensitive, in contrast with temperature-compensated processes like the circadian clock (13). We analyzed an established deterministic mathematical model of the NF-κB system (3) by incorporating temperature dependence of the rate parameters using the Arrhenius relation (Fig. 2A and SI Appendix, SI Methods 1), informed by previous approaches for circadian clocks (14). This analysis predicted a decrease in period as temperature increased (Fig. 2B), in agreement with the overall experimental trend (Fig. 1). Sensitivity analysis (SI Appendix, SI Methods 1) was used to identify
C
30
2
20
1
10
0
0
250
500
750
1000
0
0
0
200
RelA Nuc:Total (plasmid)
F1.0
TNF 34o
1.0
600
800
0.8
0.8
0.6
0.6
0.6
0.4
0.4
0.4
0.2
0.2
0.2
0.0
0.0
200
400
600
800
0
200
H
50
600
800
0.0
I
100
IκBα degradation and synthesis (cell lines + BAC)
50 25 0
37°
40°
0
200
400
600
800
RelA translocation (primary J mouse adult fibroblasts + BAC)
150 0
50
100
150
0
250
250
200
200
200
150
150
150
100
100
100
50
50
50
0
0
37°
75
Time (minutes)
250
34°
100
TNF 40o
Time (minutes)
RelA translocation (cell lines + plasmid) 0
400
***
Temperature (C)
1.0
0.8
0
1000
G
TNF 37o
Time (minutes)
Oscillation period (minutes)
400
Time (minutes)
Time (minutes)
E
D
40o
Oscillation period (minutes)
3
37o
RelA Nuc:Total (plasmid)
B
IκBα Intensity (BAC)
RelA Nuc:Total (BAC)
A
those parameters that had the greatest effect on period (Fig. 2C). Parameters controlling the key inflammatory regulator A20 (TNFAIP3) were observed to have the largest effect on the period (Fig. 2C). The control coefficients used to quantify this sensitivity were used to predict the change in period per degree of temperature change (SI Appendix, SI Methods 1). This analysis was then compared with the experimental data (Fig. 2D). This showed a greater experimental change in period than could be predicted by the original model, indicating that it was necessary to modify the structure of the model. Due to the observed sensitivity of the original model to parameters controlling A20, we investigated the effect of temperature on TNFα-stimulated A20 expression, using time-course microarray experiments. These data showed a significant greater than twofold increase in A20 expression at 30 min at 40 °C (SI Appendix, Fig. S2), compared with 37 °C. No significant differences were observed at subsequent time points, suggesting that that the ratio of transcription rate to degradation rate was largely unchanged at these later times. These data implied that changes in these rates could not reasonably account for the change in period.
40°
Temperature (C)
34°
37°
40°
Temperature (C)
0
50
34°
100
37°
150
40°
Temperature (C)
Fig. 1. Temperature sensitivity of the NF-κB system. (A) Human BACs expressing RelA-DsRedXP and IκBα-EGFP. (B) Oscillations of RelA-DsRedXP localization and IκBα-EGFP degradation and resynthesis in a single human SK-N-AS cell (stably expressing both BACs) measured by confocal microscopy. (C and D) TNFαinduced RelA-DsRedXP oscillation frequency increased significantly (***P < 0.01) following an increase in the incubation temperature (37 °C to 40 °C) surrounding the SK-N-AS cells (∼8 h following TNFα stimulation). Representative single-cell traces are shown (C). (E–G) Single-cell traces of TNFα-induced oscillations in SK-N-AS cells transiently transfected with RelA-DsRedXP maintained at (E) 34 °C, (F) 37 °C, and (G) 40 °C. Cells were incubated at the respective temperature for 1 h before TNFα stimulation. (H–J) Time-lapse confocal images and the distribution of the TNFα-induced oscillatory period of NF-κB in cells maintained at 34 °C, 37 °C, and 40 °C in (H) SK-N-AS stably transfected with RelA-DsRedXP (140 ± 27 min; 100 ± 17 min; 79 ± 15 min, respectively), (I) SK-N-AS cells stably transfected with IκBα-eGFP BAC (132 ± 42 min; 103 ± 31 min; 79 ± 12 min, respectively), and (J) mouse primary adult fibroblasts from transgenic mice expressing the RelA-DsRedXP BAC (108 ± 17 min; 90 ± 27 min; 59 ± 9 min, respectively). P < 0.001 in all three cell models. Values show mean oscillation period ±SD. (Scale bars, 10 μm.)
2 of 7 | www.pnas.org/cgi/doi/10.1073/pnas.1803609115
Harper et al.
0.1
0.2 0.1 0
0
0
100
200
300
400
500 −0.1
0.8 0.7
85 minutes
0.6 0.5
100 minutes
122 minutes
−0.2 −0.3
0.4 0.3
−0.4
0.2
−0.5
0
100
200
300
400
500
Parameters
600
Time (minutes) log2 (fold change) Nuclear/Total NF-κB
F
7 6 5 4 3 2 1 0 0
Arrhenius Model SK-N-AS p65 SK-N-AS IkBa
-15
-10
-5
0
5
10
15
5
H
250
15 79
20
25
30
100 minutes
4 3 2 1 0 -1
0
100
200
300
400
500
600
0
Time (minutes) RelA translocation (plasmid)
WT
-
+
10
15
20
25
30
25
30
IκBα
4.5
A20 KD
-
5
Time (minutes)
+
A20
4
3.5
2
1
3
2.5
150
2
1.5
100
1
Time (minutes)
0.5
50
2
3
Tubulin
0 0
0
5
10
Time (minutes)
0
0
37°C WT
37°C KD
40°C WT
40°C KD
log (fold change)
200
Observed Period (minutes)
Normalized Pol II Binding
4
10 minutes
Difference in period (minutes)
G
5
log2(fold change)
Variable Initiation Model
0.9 0.8 0.7 0.6 0.5 0.4 0.3 0.2 0.1 0
A20
6.5 minutes
log2(fold change)
40°C - 37°C
Temperature
E
37°C - 34°C
D
5
10
15
20
Time (minutes)
Temperature & Treatment
Fig. 2. Temperature dependence of the NF-κB system depends on A20. (A) Diagram of the NF-κB pathway showing the interactions between the main components incorporated into the model. (B) Example traces of RelA-DsRedXP oscillations post-TNFα treatment at 34 °C, 37 °C, and 40 °C (Top), compared with simulations of single-cell trajectories from the NF-κB model with parameters depending on temperature through the Arrhenius equation (Bottom). (C) Sensitivity analysis indicates that the model parameters that are most sensitive are linked to the synthesis and reactions of A20. (D) The experimentally observed change in the oscillation period per degree temperature below or above 37 °C, for SK-N-AS cells transiently expressing RelA-DsRedXP (orange) or stably expressing IκBα-eGFP (green), compared with the prediction of the original model (3) with adjusted parameters for temperature change (black), or as predicted by a modified model (purple) (for details, see SI Appendix, SI Methods). (E) The modified NF-κB model incorporated a transcriptional delay of A20 of ∼6.5 min (Top). This change was able to recapitulate the level of change in the observed period between 37 °C and 40 °C (Bottom). (F) RT-PCR analysis over the first 30 min post-TNFα treatment for A20 (Top) and IκBα (Bottom) mRNA expression at 37 °C and 40 °C. Statistical analysis was used to determine the point of first up-regulation (SI Appendix, SI Methods) at 37 °C (gray shading) and 40 °C (red shading). (G) ChIP analysis of RNA polymerase II DNA binding to the A20 gene after continuous TNFα stimulation at 37 °C and 40 °C. (H) The effect of siRNA knockdown of A20 on NF-κB oscillatory period at 37 °C and 40 °C (for scrambled siRNA control, see SI Appendix, Fig. S5); there was no significant difference (P < 0.05) between the knockdowns at these temperatures (121 ± 33 min and 116 ± 36 min, respectively). (Inset) Western blot showing the efficacy of the A20 siRNA knockdown with and without TNFα treatment. Throughout the figure, color denotes experimental and simulated temperature conditions: blue, 34 °C; black, 37 °C; and red, 40 °C.
We analyzed the model for simple structural changes, which might predict dynamics compatible with the experimentally observed oscillation dynamics. One such change incorporated a putative regulated (delayed) timing of A20 transcription (SI Appendix, SI Methods 2; see also data in Fig. 2 D and E). This modified model predicted that a putative 6.5-min-faster onset of A20 transcription at 40 °C, compared with 37 °C, was one simple structural change to the model that was able to produce dynamics consistent with the experimental observations (Fig. 2E). Harper et al.
This prediction was initially supported by the microarray experiments and was further supported by analysis of a detailed qPCR time course of TNFAIP3/A20 mRNA expression following TNFα treatment at 37 °C and 40 °C (Fig. 2F). In contrast, no similar difference was observed in the onset of expression of the other feedback inhibitors IκBα (Fig. 2F) or IκBe (SI Appendix, Fig. S3). This suggested the possibility of a specific effect of temperature on A20 feedback kinetics. Quantification of bound RNA Polymerase II on the A20 gene using ChIP indicated PNAS Latest Articles | 3 of 7
SYSTEMS BIOLOGY
0.1 0
IκBα nuclear export NF-κB IκBα association Catalysis of IκBα
0.2
0.3
IκBα protein degradation IKK activation NF-κB nuclear import NF-κB nuclear export
0.3
0.4
IKK inactivation
Nuclear/Total NF- κB
0.6 0.5
0.4
34°C 37°C 40°C
RelA translocation (plasmid)
0.7
A20 effect on IKK inhibition IκBα translation IκBα transcription IκBα mRNA degradation
C
0.8
A20 transcription A20 translation
B
A20 mRNA degradation A20 protein degradation IκBα nuclear import IKKn production Catalysis of NF-κB
A
earlier transcription elongation at 40 °C, compared with 37 °C (Fig. 2G). Western blot analysis of A20 protein levels also showed a temperature-dependent change in the dynamics of A20 expression at the protein level (SI Appendix, Fig. S4). These observations therefore supported a temperature-dependent change in the timing of the onset of A20 expression that was compatible with the model prediction. We found that siRNA-mediated A20 knockdown increased the period of TNFα-induced oscillations at both 37 °C and 40 °C (Fig. 2H and SI Appendix, Fig. S5). Treatment at either temperature in the A20-depleted cells gave the same period of ∼120 min, indicating that the dynamics of the system became insensitive to temperature. These data support the hypothesis that temperature regulation of the A20 feedback loop is an important component in the control of the timing of the oscillatory dynamics of the NF-κB system. The effect of temperature on the gene expression response to TNFα was studied using microarrays (validated by RT-qPCR; SI Appendix, Fig. S6). Expression profiles of NF-κB−dependent genes, induced by TNFα, have previously been categorized by the time at which they reached their peak level of expression after the cells were stimulated at 37 °C (15, 16). Here, our microarray data were both analyzed by the previously described Hao and Baltimore criteria, or newly classified into immediate, middle, or slow by the time (30, 130, and either 230 or 430 min, respectively, poststimulation) at which they first displayed a significant change from their initial expression (SI Appendix, Fig. S7). A set of immediate genes were up-regulated at 40 °C compared with 37 °C after 30 min, but, notably, were unaffected by temperature at later time points (Fig. 3A). The middle (Fig. 3B) and slow genes (Fig. 3C) were also predominantly unaffected, with occasional sporadic patterns of differential expression. Very few TNFα-responsive genes were significantly affected by temperature alone (6%; see Dataset S1). These data suggest temperature insensitivity of a majority of target genes, accompanied by the temperature-dependent regulation of the dynamics of a different subset of genes. We categorized those genes that exhibited significant differential expression at 40 °C compared with 37 °C after TNFα stimulation by the time point at which this difference first occurred (denoted DETEMP#, where # is the time point), and subdivided them based on known NF-κB targets or otherwise (κB or non-κB genes; SI Appendix, SI Methods 4 and Table S2 and Dataset S1). Of the DETEMP30 genes, all but two of the κB genes were up-regulated, and approximately two-thirds of these more than doubled their expression (including TNFAIP3/A20; Fig. 3D, Left). At subsequent time points, the mRNA levels of κB genes were similar at the two temperatures. The behavior of the corresponding non-κB genes was significantly different at each time point (P < 0.05) as they were both up- and down-regulated at 30 min, and had differing expression at later time points (Fig. 3D, Right). Similarly, in the DETEMP130 genes, we predominantly observed up-regulation at 130 min in κB genes in comparison with the non-κB genes, but there were no significant behavioral differences at subsequent times (Fig. 3E). However, the DETEMP230 and DETEMP430 genes generally showed temperature-dependent downregulation, whether or not they were known κB targets (Fig. 3 F and G). Our principal observation was therefore the identification of a set of immediate NF-κB−dependent genes that show early temperature-dependent up-regulation followed by subsequent temperature insensitivity. We analyzed Gene Ontology (GO) categories (SI Appendix, SI Methods 4) of TNFα-dependent genes which were differentially expressed with respect to temperature (Fig. 3 H and I). These were compared with the genes which showed a transcriptional response to TNFα alone at 37 °C (SI Appendix, Fig. S8). Increases were observed in the number of temperature-regulated 4 of 7 | www.pnas.org/cgi/doi/10.1073/pnas.1803609115
κB (but not non-κB) genes within important GO categories, including immune and inflammatory responses. To further elucidate the functional effects of genes affected by temperature, we performed an analysis of their linkages in terms of protein interaction networks and signaling networks. Genes that showed significant temperature-dependent changes mapped to key cell signaling pathways involved in cytokine networks, cell repair and survival, and feedback control of the TNFα/NF-κB system, as illustrated in Fig. 4. They included BIRC3/cIAP2, which is involved in feedback control of NF-κB and apoptosis; IL1α, which is strongly linked to the control of fever; GADD45B, which is involved in links to p53-dependent DNA repair and apoptosis control; MAP3K8 (TPL2), linked to the ERK/JNK pathways (all κB genes); and Axin2, which is a key inhibitor of the Wnt signaling pathway. Several genes also showed linkages between the protein−protein interaction networks and key functional pathways (SI Appendix, Figs. S9–S11). Analysis of protein levels of some key genes showed that, for A20 (SI Appendix, Fig. S4), BIRC3/cIAP2, Traf1, and Axin2 (SI Appendix, Fig. S12), the observed changes in RNA expression were also observed at the protein level. Our work therefore suggests that temperature affects the pattern of NF-κB−dependent gene expression in a highly controlled manner that enables precise and coordinated inflammatory and cell-fate responses to infection and stress, while leaving other functions unperturbed. Discussion We have found that changes in temperature alter both the oscillatory frequency of NF-κB and the gene expression response to TNFα. As we predominantly observed an enhanced early response in the κB genes, followed by unchanged expression levels at later time points, we suggest that the oscillatory and transcriptional effects of temperature are intertwined. We propose that the observed temperature insensitivity may constitute a form of temperature compensation in gene expression, which is a result of the interaction between the increased oscillation frequency and the generic effects of temperature on synthesis and degradation rates. This “temperature compensation” may imply a biological requirement that the basic inflammatory and immune response to pathogens must remain functional across the physiological temperature range. At the same time, the differential timing of expression of a specific group of κB genes may play a key role in the modulation of cellular responses to cytokine stimulation at altered temperatures. There may also be direct or indirect functional effects through genes classified as non-κB genes, which may be differentially expressed at later time points. These non-κB genes most likely include some NF-κB−regulated genes where the direct role of NF-κB has not yet been defined. With this in mind, one particularly interesting observation was the strong down-regulation at 40 °C compared with 37 °C of AXIN2 (for mRNA data, see SI Appendix, Fig. S6, and, for Western Blot, see SI Appendix, Fig. S12), a key Wnt pathway feedback repressor (17) (Fig. 4), and a known oscillator (18). These data may suggest temperature modulation of Wnt/NF-κB cross-talk. One of the κB genes that showed temperature-sensitive dynamics of early onset gene expression was the key feedback inhibitor A20/TNFAIP3. We tested a mathematical model prediction that modulation of A20 might affect the sensitivity of the NF-κB system to temperature. A20 knockdown removed the sensitivity to temperature between 37 °C and 40 °C, a temperature range relevant to the fever response. These data indicate a role for A20 in modulation of the inflammatory response in response to temperature changes. The other key feedback genes, IκBα and IκBe, did not show the same consistent change in their TNFα-dependent expression dynamics at different temperatures (SI Appendix, Fig. S3). While it is possible that variation in the level of cell heterogeneity might represent an important modulator Harper et al.
0
0
30 130 230 430
30 130 230 430
0
Time (minutes)
Time (minutes)
30 130 230 430
Time (minutes)
log2(expression at 40°C) - log2(expression at 37°C) -2
D
-1.5
κB genes. N=28
0
F
-1
-0.5
First DE at 30 minutes
30 130 230 430
0
κB genes. N=7
30 130 230 430
0
Time (minutes)
1.5
2
κB genes. N=19
Non-κB genes. N=33
30 130 230 430
0
30 130 230 430
First DE at 430 minutes G κB genes. Non-κB genes. N=88 N=9
0
30 130 230 430
Time (minutes)
30 130 230 430
0
Time (minutes)
κB genes
H
1
First DE at 130 minutes
0
30 130 230 430
Non-κB genes. N=51
0.5
E
Non-κB genes. N=28
First DE at 230 minutes
0
0
I
30 130 230 430
Time (minutes)
Non-κB genes
Time of first DE
NF-kB signaling Adhesion Cell differentiation Transport Phosphorylation Cell death Cell migration Response to stimuli Inflammatory response Immune system Signal transduction
30 130 230 430
Methods 0
5
10
15
20
0
5
10
15
20
25
30
Number of differentially expressed genes
Fig. 3. Temperature change affects expression through early genes. Heatmaps showing the log difference in expression between 40 °C and 37 °C at 0, 30, 130, 230, and 430 min following treatment with TNFα. A–C show how expression changes with temperature increase in the (A) immediate, (B) middle, and (C) slow genes, which were determined by the time of first differential transcription from baseline after TNFα treatment at 37 °C (SI Appendix, SI Methods 4). Genes are ordered using hierarchical clustering of expression levels; corresponding gene names are given in Dataset S1. DE, differentially expressed. D–G show those genes with statistically significant differential transcription between the two temperatures after TNFα treatment. These are ordered by the first time point at which a significant dif-
Harper et al.
of a cell population/tissue level inflammatory response (19), no consistent change in cell-to-cell dynamic heterogeneity was observed (SI Appendix, SI Methods 1), and the absence of temperature regulation of IκBe provides no evidence for a mechanism by which temperature may regulate cellular heterogeneity. Overall, these data suggest that A20 may therefore represent a specific target for therapeutic intervention. Recent studies using an information theoretic approach have suggested that the ability of the NF-κB system to transmit information is relatively limited, enabling, at most, a binary decision (7, 20). Given the complex downstream roles assigned to NF-κB, such a limitation has seemed rather counterintuitive, and our results underscore this concern. These previous studies have focused on the mutual information between the cytokine level and the amount of transcription factor in the nucleus at a set of given times. They have not considered all aspects of the response, omitting key aspects, such as the dynamics, modification states (e.g., phosphorylation) of NF-κB subunits, interactions between these subunits, and the overall gene expression pattern. By studying stimulation, coupled to temperature perturbation, we now hypothesize that, when NF-κB dynamics and the gene expression profile are taken into account, the ability of NF-κB to transmit information may be significantly greater than has been previously suggested. There has been a great deal of work suggesting that the inflammatory response may be regulated by temperature–fever (21). At febrile temperatures, NF-κB activity has been shown to be modulated by factors such as HSF1 to ensure correct regulation of the proinflammatory response (22). In our studies, we observed that temperature affects NF-κB dynamics at not only increased but also decreased temperatures (Fig. 1 and SI Appendix, Fig. S1), including temperatures well below those normally associated with a heat shock response. A number of studies have suggested that febrile temperatures can affect the expression of inflammatory cytokines. Rhinovirus infection of airway cells at lowered airway temperatures has been suggested to be due to a differential innate immune response at these lower temperatures (23, 24). In addition, animal housing temperature can have a dramatic effect on tumor formation and immune responses in laboratory mice (25). We speculate that the association of sleep pattern/circadian rhythms with NF-κB disruption (26), chronic inflammation (27), and cancer prognosis (28) could be due, in part, to altered sleep−wake temperature cycles (e.g., caused by shift work). In conclusion, we show that small temperature changes can dramatically alter the dynamics of the NF-κB response to cytokine stimulation. This is mediated through the A20 feedback inhibitor and leads to specific dynamic changes in the expression of key NF-κB−dependent genes involved in the inflammatory response, as well as cross-talk with other important cell-fate– regulating pathways. Overall, these results suggest that temperature regulates the inflammatory response through modulation of NF-κB signaling and its downstream functions. Cell Culture and Reagents. Experiments were performed on three cell models: human neuroblastoma SK-N-AS cells transfected with RelA-dsRedXP plasmid, SK-N-AS cells stably expressing an IkBα-eGFP BAC as described previously (29, 30), and primary mouse adult fibroblasts (MAFs) cultured from ear
ference was observed, and are further divided into κB genes (Left) and nonκB genes (Right). GO categories were established from these genes (SI Appendix, SI Methods 4), and the timing and number of genes that fell into each category are shown as separate bar charts for (H) κB and (I) non-κB genes, the names of which are given in SI Appendix, Table S2 and Dataset S1. Transcript variants are treated separately throughout.
PNAS Latest Articles | 5 of 7
SYSTEMS BIOLOGY
AImmediate genes, N=30 BMiddle genes, N=332 CSlow genes, N=875
TNF/LTA
Virus
Stress signals DNA damage
IL1A IL1B
TNFR2
TNF Signaling pathway
TRAF1 TRAF2 TRAF3
TNFR1 DDX58
SODD
TRADD TRAF2 TRAF5 RIP1
BIRC3 ATM AIP1
cIAP1 BIRC3
NIK
PI3K
NIK
TAB1 TAB2 TAB3 TAK1
CASP7 p53 JNK
RIP
Akt
MKK3
BBC3
c-Jun
IKKs
p38
IκBα
IL1R DNA damage
cIAP1 BIRC3
Wnt SFRP4
ASK1 Frizzled LRP5 LRP6
GADD45B
IKKβ IKKα IKKγ
MAP3K8 NF-κB
NGF
MEK1 MAP2K3 MKK4 MEK2 MAP2K6 MKK7
MAP3K4
TAK1 Apoptosis
Cell survival
ERK1 ERK2
Degradation P50 P65
P53 signaling pathway
CREB c/EBPβ
DNA
DNA
Remodelling of extracellular matrix
Cell Survival Intracellular adhesion signaling (negative)
JNK1 JNK2 NLK
GSK-3β AXIN2 APC
TCF LEF
β-catenin
MAPK signaling pathway
MSK1 MSK2
NF-kappa B signaling pathway
ammation
p38
AP-1
CKIe DVL GBP CK2
DNA
WNT signaling pathway
ammatory Leukocyte cell cycle recruitment cytokines
Fig. 4. Proteins derived from genes differentially expressed with temperature feature in important signaling pathways. Pathway analysis with the Kyoto Encyclopedia of Genes and Genomes (33) (KEGG) revealed where proteins derived from both κB genes (green) and non-κB genes (orange) are involved in key signaling pathways. Genes that were down-regulated at 40 °C compared with 37 °C are shown in italics; the remaining genes are up-regulated. Where gene and protein names differ, the gene name is given, for consistency. These interactions indicate that their differential expression of the associated genes could have important implications for future signal transduction through these pathways. To avoid bias, only interactions identified using KEGG are shown, leading to the omission of the roles of notable proteins such as A20 (TNFAIP3) in the NF-κB signaling pathway, and NEDD4L in the Wnt pathway.
punches from transgenic mice expressing an RelA-DsRedXP BAC (SI Appendix). SKN-AS cells were cultured in Modified Eagles Medium supplemented with 1% nonessential amino acids (Sigma-Aldrich), and MAFs were cultured in Dulbecco Modified Eagles Medium. Both cell types were supplemented with 10% FBS (Gibco). Transient transfection was performed as described previously (4). For bulk cell experiments (ChIP, RT-PCR, microarray analysis, and siRNA), experimental dishes were transferred to a humidified 5% CO2 incubator at 40 °C 1 h before the start of the time course. siRNA Knockdown. SK-N-AS cells were plated at a density of 36,000 cells per dish. A20 was targeted using a pool of four ON-TARGET plus siRNAs (200 nM; J-009919-05, J-009919-06, J-009919-07, and J-009919-08; Dharmacon), or low GC content scrambled siRNA transfected into cells using the SK-N-AS transfection kit (Altogen Biosystems) according to manufacturer’s instructions. Cells were transfected, as described previously (3), 24 h before imaging. Western Blot. Nitrocellulose membranes (Optitran BA-S85; Schleider & Schuell) were incubated overnight with primary antibodies against A20 (#59A426; Calbiochem), α-tubulin (#2144; Cell Signaling), Traf1 (#4715; Cell Signaling), c-IAP2 (#3130; Cell Signaling), or Axin2 (#2151; Cell Signaling) followed by HRPconjugated secondary antibodies (Cell Signaling).
6 of 7 | www.pnas.org/cgi/doi/10.1073/pnas.1803609115
RT-qPCR. Cells were plated at a density of 500,000 cells per dish. Total RNA was extracted using the High Pure RNA Isolation kit (Roche), according to manufacturer’s instructions, and quantified using a Nanodrop ND-1000 Spectrophotometer (Thermo Fisher Scientific); 1 μg of RNA was reverse-transcribed and amplified using the SuperScript VILO cDNA synthesis kit (Life Technologies). For RT-qPCR, cDNA was diluted 1:20 with RNase-free water, and amplified using the LightCycler 480 SYBR Green 1 Master Mix (Roche). Three biological replicates were performed. Relative quantification of gene expression was conducted using GAPDH expression level as an endogenous control. For sequences of primers, see SI Appendix, SI Methods. ChIP Assays. SK-N-AS cells (3 × 10⁶) were plated in 10-cm2 dishes and incubated at 37 °C for 48 h. Dishes were incubated at the appropriate temperature 1 h before treatment with 10 ng TNFα. ChIP assays were performed as described previously (3) based on the protocol by Upstate Biotechnology. Immunoprecipitation was carried out using 5 μg of either Anti-RNA polymerase II (Merck 05-623) or Anti-IgG antibodies (Cell Signaling #2729s). DNA was extracted and amplified by PCR as described previously (3). The following primer sequences were used: A20 gene forward GGTGTTGGAGAGCACAATGG, reverse CAGTGTGTATCGGTGCATGG, amplifying 160 bp of DNA. The qPCR was performed using LightCycler 480 SYBR Green 1 Master Mix (Roche).
Harper et al.
purification kit (Qiagen). The cDNA was labeled and analyzed on NimbleGen 12 × 135K Homo Sapiens Expression Arrays (100718 HG18 opt expr) by the Roche array service and subject to robust multiarray analysis normalization using the proprietary Nimblescan package. Data Availability. All microarray data used in this study are available in the ArrayExpress database (https://www.ebi.ac.uk/arrayexpress) under accession number E-MTAB-5158. Detailed methods are provided in SI Appendix, SI Methods.
Microarray Experiment. SK-N-AS cells were plated at a density of 500,000 cells per dish. Time-course experiments were carried out 48 h later. Cells were transferred to the two temperatures, 37 °C and 40 °C, for 1 h and then (at time 0) stimulated with 10 ng/mL of TNFα. Measurements were taken at 0, 30, 130, 230, and 430 min. Cells were lysed, and total RNA was extracted and quantified as above. The cDNA was obtained using the TransPlex Whole Transcriptome Amplification Kit and JumpStart Taq DNA polymerase (Sigma-Aldrich), with 300 ng of RNA starting material and 17 cycles of PCR amplification. The resulting cDNA was purified using the QIAquick PCR
ACKNOWLEDGMENTS. We thank Simon Hubbard, Chris Sanderson, Alex Loewer, Neil Perkins, Derek Mann, Robert Insall, Julian Davis, Andrew Loudon, James Bagnall, Anne McNamara, Dean Jackson, Pawel Paszek, and Ben Calverley for critical advice. Transgenic mice were curated by Ronald Naumann (Max Plank Institute of Molecular Cell Biology and Genetics). Werner Muller assisted with management of animal breeding and maintenance. Till Bretschneider assisted with Cell Tracker software. The work was supported by Biotechnology and Biological Sciences Research Council (BBSRC) Grants BBF0059382/BB/F0059381/ BBF00561X1, BB/F005318/1, and BB/K003097/1; Medical Research Council (MRC) Grants MR/K015885/1 and MR/M008908/1; and a PhD studentship (S.W.) (BBSRC training Grant BB/F529003/1). D.J.W. and D.A.R. were partly funded by the European Union Seventh Framework Programme (FP7/20072013) under Grant Agreement 305564. This work benefits from the MRCfunded Single Cell Genomics Centre, using microscopy equipment based in the Systems Microscopy Centre. Carl Zeiss and Hamamatsu Photonics supported imaging technology and training.
1. Hayden MS, Ghosh S (2012) NF-κB, the first quarter-century: Remarkable progress and outstanding questions. Genes Dev 26:203–234. 2. Hao S, Baltimore D (2009) The stability of mRNA influences the temporal order of the induction of genes encoding inflammatory molecules. Nat Immunol 10:281–288. 3. Ashall L, et al. (2009) Pulsatile stimulation determines timing and specificity of NFkappaB-dependent transcription. Science 324:242–246. 4. Nelson DE, et al. (2004) Oscillations in NF-kappaB signaling control the dynamics of gene expression. Science 306:704–708. 5. Sung MH, et al. (2009) Sustained oscillations of NF-kappaB produce distinct genome scanning and gene expression profiles. PLoS One 4:e7163. 6. Zambrano S, De Toma I, Piffer A, Bianchi ME, Agresti A (2016) NF-κB oscillations translate into functionally related patterns of gene expression. eLife 5:e09100. 7. Tay S, et al. (2010) Single-cell NF-kappaB dynamics reveal digital activation and analogue information processing. Nature 466:267–271. 8. Kellogg RA, Tay S (2015) Noise facilitates transcriptional control under dynamic inputs. Cell 160:381–392. 9. Refinetti R, Menaker M (1992) The circadian rhythm of body temperature. Physiol Behav 51:613–637. 10. Baker FC, Driver HS (2007) Circadian rhythms, sleep, and the menstrual cycle. Sleep Med 8:613–622. 11. Evans SS, Repasky EA, Fisher DT (2015) Fever and the thermal regulation of immunity: The immune system feels the heat. Nat Rev Immunol 15:335–349. 12. Mace TA, et al. (2011) Differentiation of CD8+ T cells into effector cells is enhanced by physiological range hyperthermia. J Leukoc Biol 90:951–962. 13. Hastings JW, Sweeney BM (1957) On the mechanism of temperature independence in a biological clock. Proc Natl Acad Sci USA 43:804–811. 14. Gould PD, et al. (2013) Network balance via CRY signalling controls the Arabidopsis circadian clock over ambient temperatures. Mol Syst Biol 9:650. 15. Garber M, et al. (2012) A high-throughput chromatin immunoprecipitation approach reveals principles of dynamic gene regulation in mammals. Mol Cell 47:810–822. 16. Choudhary S, et al. (2013) Inducible tumor necrosis factor (TNF) receptor-associated factor-1 expression couples the canonical to the non-canonical NF-κB pathway in TNF stimulation. J Biol Chem 288:14612–14623. 17. Mengel B, et al. (2010) Modeling oscillatory control in NF-κB, p53 and Wnt signaling. Curr Opin Genet Dev 20:656–664. 18. Aulehla A, et al. (2003) Wnt3a plays a major role in the segmentation clock controlling somitogenesis. Dev Cell 4:395–406.
19. Paszek P, et al. (2010) Population robustness arising from cellular heterogeneity. Proc Natl Acad Sci USA 107:11644–11649. 20. Cheong R, Rhee A, Wang CJ, Nemenman I, Levchenko A (2011) Information transduction capacity of noisy biochemical signaling networks. Science 334:354–358. 21. Foxman EF, et al. (2015) Temperature-dependent innate defense against the common cold virus limits viral replication at warm temperature in mouse airway cells. Proc Natl Acad Sci USA 112:827–832. 22. Hasday JD, Singh IS (2000) Fever and the heat shock response: Distinct, partially overlapping processes. Cell Stress Chaperones 5:471–480. 23. Lofgren E, Fefferman NH, Naumov YN, Gorski J, Naumova EN (2007) Influenza seasonality: Underlying causes and modeling theories. J Virol 81:5429–5436. 24. Lee CT, Zhong L, Mace TA, Repasky EA (2012) Elevation in body temperature to fever range enhances and prolongs subsequent responsiveness of macrophages to endotoxin challenge. PLoS One 7:e30077. 25. Kokolus KM, et al. (2013) Baseline tumor growth and immune control in laboratory mice are significantly influenced by subthermoneutral housing temperature. Proc Natl Acad Sci USA 110:20176–20181. 26. Irwin MR, et al. (2008) Sleep loss activates cellular inflammatory signaling. Biol Psychiatry 64:538–540. 27. Ranjbaran Z, Keefer L, Stepanski E, Farhadi A, Keshavarzian A (2007) The relevance of sleep abnormalities to chronic inflammatory conditions. Inflamm Res 56:51–57. 28. Sephton S, Spiegel D (2003) Circadian disruption in cancer: A neuroendocrine-immune pathway from stress to disease? Brain Behav Immun 17:321–328. 29. Adamson A, et al. (2016) Signal transduction controls heterogeneous NF-κB dynamics and target gene expression through cytokine-specific refractory states. Nat Commun 7:12057. 30. Ankers JM, et al. (2016) Dynamic NF-κB and E2F interactions control the priority and timing of inflammatory signalling and cell proliferation. eLife 5:e10473. 31. Shen H, et al. (2006) Automated tracking of gene expression in individual cells and cell compartments. J R Soc Interface 3:787–794. 32. Du CJ, Marcello M, Spiller DG, White MR, Bretschneider T (2010) Interactive segmentation of clustered cells via geodesic commute distance and constrained density weighted Nyström method. Cytometry A 77:1137–1147. 33. Kanehisa M, Goto S (2000) KEGG: Kyoto Encyclopedia of Genes and Genomes. Nucleic Acids Res 28:27–30.
Harper et al.
PNAS Latest Articles | 7 of 7
SYSTEMS BIOLOGY
Fluorescent Time-Lapse Imaging. Cells (SK-N-AS: 100,000; RelA-dsRedXP Primary MAFs: 25,000) were seeded in 35-mm glass coverslip-based dishes (Greiner) 20 h before imaging. Cells were transferred to the stage of a Zeiss Axiovert 200 equipped with an XL incubator (maintained at the appropriate temperature and 5% CO2, in humid conditions), housed in temperaturecontrolled rooms at 26 ± 0.5 °C to aid accurate temperature control on microscopes; 10 ng/mL of TNFα was added to the dish 1 h after transfer onto the microscope, and images were captured every 5 min. Confocal microscopy was carried out as previously described (3) using a 40× Fluar NA 1.3 oilimmersion objective (Zeiss). Nuclear:cytoplasmic ratio of RelA-DsRedXP or whole cell intensity of IκBα-eGFP was calculated using Cell Tracker (31, 32). The timing of the second to sixth peaks (RelA-DsRedXP) or troughs (IκBαeGFP) was recorded for each cell. Culture medium during imaging, microscope acquisition parameters, and imaging data quantification were as previously described (3).