AQUATIC MICROBIAL ECOLOGY Aquat Microb Ecol
Vol. 11: 251-261, 1996
Published December 31
Temporal and spatial stability of bacterioplankton biomass and productivity in an atoll lagoon Jean-Pascal Torreton*,Philippe Dufour Centre ORSTOM d e Tahiti, BP 529, Papeete, French Polynesia
ABSTRACT. Spatial a n d temporal variations of bacter~oplanktonbioinass, production and growth rates were l n v e s t ~ g a t e d6 times from 1991 to 1994 In T ~ k e h a ulagoon (Tuamotu, French Polynesia) T h e water column was homogeneous from the surface to the bottom (20 m ) at the reference statlon but some horizontal vanations were detected, with b ~ o m a s sa n d production increasing from the reef-flat spillways (oceanic water inflow) to the main part of the lagoon a n d d e c r e a s ~ n gfrom the relat~velyeutrophic shore (near the village) to the main part of the lagoon. However, both of these perturbations \yere limited to the immediate vicinity of these arcas. D ~ efluctuations l of bacterial b ~ o m a s sand growth rate were slight (coeff~cientof variation, CV < 20",,) and showed 110 significant pattern Day-to-day variations recorded over periods of up to 20 consecutive days appeared also to be limited (CV < 2 5 % ) . A s~gnificantcorrelation between wind a n d total abundance of bacteria In the water colulnn suggested that these day-today variations may be in part e x p l a ~ n e dby wlnd, probably Inducing resuspension of sediments No significant pattern appeared from comparison of the G crulses spread over d ~ f f e r e n tseasons. Cruise averages differed slightly from each other, w ~ t hCV for all crulses averaging 34, 10 a n d 41 % for bacterioplankton b ~ o m a s s production , and growth I-ate, respect~vely.T ~ k e h a ulagoon appears to be a very stable ecosystem for bacterioplankton processes and therefore d ~ f f e r sstrongly from other reef water column systems. T h ~ untypical s stab~litym ~ g h bt e explained by the long r e s ~ d e n c etime of water (170 d ) , the strong stability of the oceanlc surrounding water (South Pacific Gyre), the weak seasonality of PI-imaryproducers and the l m i t e d inputs from corals, b o r d e r ~ n gislands and sediments.
KEY WORDS: Bacterioplankton . Bacter~alproduction . Thymidine incorporation . L e u c ~ n eincorpora tion . Atoll lagoon . Pac~ficOcean
INTRODUCTION
The developn~entof epifluorescence microscopy and tracer approaches has led to a better understanding of the contribution of heterotrophic bacterioplankton to the cycles of energy and matter in various pelagic ecosystems. Heterotrophic bacteria a r e recognized to play a key role in most of the aquatic systems studied and particularly in oligotrophic waters where efficient recycling processes are crucial. This is consistent with the increase in the bacterioplankton to phytoplankton biomass ratio from eutrophic to oligotrophic systems (Cho & Azam 1990, Dufour & Torreton 1996). Coral reefs areas are characterized by fast a n d efficient nutrient recycling processes and low standing
'E-mail.
[email protected]
0 Inter-Research 1996
stocks and inputs of new nutrients (Crossland & Barnes 1983). Understanding the production and fate of detrltus is thus of great importance for the comprehension of the processes governing these ecosystems. The determination of bacterial production of biomass a n d heterotrophic activity represents a n attractive shoi-tcut to integrate the detrital fluxes coming from the wide variety of potential sources in coral reefs environments (Ducklow 1990). Using the average surface area of 99 atolls (Stoddai-t 1965), Kinsey & Hopley (1991) calculated that the 425 atolls on the earth would represent 115000 km2 a n d thus 19% of the total area (617000 km2) covered by coral reef ecosystems (Smith 1978). Atoll a n d island lagoons often represent large bodies of oligotrophic water where heterotrophic bacterioplankton may constitute a large proportion of total carbon, nitrogen and phosphorus. Knowledge of bacterioplankton dynamics
252
Aquat Microb Ecol 11: 251-261, 1996
is thus essential in understanding the flows of energy and matter in these lagoons. However, most of the studies on bacterioplankton in coral reef environments have focused on the water overlying coral reefs (Sorokin 1973, 1978, Moriarty et al. 1985, 1990, Linley & Koop 1986, Hoppe et al. 1988, Ducklow 1990, Ayukai 1995) with only a few exceptions in atoll lagoons (in Majuro: Sorokin 1978, Yoshinaga et al. 1991; in Tuamotu: Torreton & Dufour 1996), and Island lagoons (Sorokin 1973, Landry et al. 1984, Yoshinaga et al. 1991). Reliable carbon and nutrient budgets are almost impossible to establish without estimating the representativeness of the measurements made during single cruises. The temporal variability of bacterioplankton biomass and activity is high in water overlying cera! reefs due to tide currents (Linley & Koop 1986, Hoppe et al. 1988), diurnal rhythms (Moriarty et al. 1985), resuspension wlth increasing wind speed (Moriariy 1979) and seasonal changes (Moriarty et al. 1985) and/or interannual variations. For example, on a die1 basis, Linley & Koop (1986) reported production variations up to 14-fold in lagoon waters and up to 25-fold in reef-flat waters of One Tree Island with a maximum generally during low tide. At Lizard Island, Moriarty et al. (1985) showed production values varying from 2-fold in the lagoon up to ?-fold at the reef front with a maximum in the afternoon. Production values determined in winter and summer 1982 at Lizard Island differ by about 22-fold in the lagoon and 78-fold at the reef-flat (Moriarty et al. 1985).These temporal variations are considerable and suggest a close coupling between substrate supply and bacterial growth. However, they also prevent the establishment of carbon and nutrient budgets with reasonable accuracy using data obtained from temporally limited studies. In coral reef systems, spatial variations appear also quite important; a ?-fold variation in growth rates was reported by Moriarty et al. (1985) at Lizard Island during ebb tide while Linley & Koop (1986) reported a 15-fold variation along a 2.5 km transect over Davies Reef. In contrast to repeated studies on the Great Barrier Reef, and probably due to their poor accessibility, studies on bacterioplankton processes in oceanic atolls have only been performed during oceanographic cruises (Sorokin 1973, 1978, Yoshinaga et al. 1991), preventing evaluation of the temporal and spatial variability of bacterial biomass and activity. The seasonal variations in oceanic atolls isolated from continental masses and situated in low latitudes may be expected to be smaller than those reported in the Great Barrier Reef. Indeed, in Tikehau lagoon chlorophyll a (chl a) and particulate organic carbon (POC) vary only by about 1.3- and 1.6-fold respectively with maxima dur-
ing austral winter (0.24 pg 1-' and 240 pg C l-l) and minima during austral summer (0.18 pg 1-' and 150 pg C 1-l; Charpy & Charpy-Roubaud 1991). In contrast, irradiance is minlmal (36 E m-2d-l) during austral winter and maximal (56 E m-2 d-') during summer, and total (pelagic+benthic) primary production estimated from light and chl a have been estimated to vary between 0.53 and 0.65 g C m-2 d-' in winter and summer, respectively (Charpy & Charpy-Roubaud 1990). Fluctuations of bacterial biomass and productivity should therefore be moderate at these scales. However, a possible close coupling between primary production and bacterial production could lead to significant variations of at least bacterial production at the daily scale. Resources for microbial growth could also be !ewer bett~reenareas n e a r t h e reef-flat spillways where oceanic water enters than in the central part of the lagoon. On the other hand, microbial growth shouid be greater near sites where human activity may lead to significant enrichment relative to inside a lagoon. Here, we present the results of a study of spatial and temporal variations of bacterioplankton biomass and productivity in the water column of Tikehau atoll lagoon. The questions we addressed were the following: What is the range of temporal variability in bacterial production and growth rates in the water column of this atoll lagoon? Are discrete measurements of these bacterioplanktonic variables representative of the 'average' conditions prevailing in this ecosystem? What is the extent of the presumable spatial gradients of bacterioplankton processes in the ecosystem? Do they prevent the extrapolation of measurements made at a limited number of stations inside the lagoon? For this purpose, different spatial scales were investigated including vertical profiles and horizontal variation from the shore to the main part of the lagoon and from a reef-flat spillway to the main part of the lagoon. Variation of bacterial abundance and activity was assessed over time scales ranging from hours to seasons. We are aware that studies of bacterioplanktonic process variability at smaller scales, such as the minute scale for temporal variations and the centimeter scale for spatial variations, may be useful to understand the physical and biological factors regulating bacterial populations (see for example Ducklow 1984, Paul et al. 1986, Schiller & Herndl 1989). This is, however, beyond the scope of this study.
MATERIALS AND METHODS
Study site. Tikehau atoll (14' 55' S, 148" 15' W ) is situated in the northwest of the Tuamotu Archipelago (French Polynesia). The lagoon has an area of 400 km2 with an average depth of 25 m (Lenhardt 1991).
Torreton & Dufour: Bacterloplankton biomass a n d productivity in a n atoll lagoon
Oceanic waters enter the lagoon mostly through reefflat spillways situated on the southern and eastern parts of the atoll while the main exit is via a permanent passage (200 m wide, 3.7 m deep) on the west side (Fig. 1 ) .Water residence time ranges from l00 to 230 d in austral winter and summer, respectively, and averages annually 170 d (Lenhardt 1991).Nutrient budgets (Charpy-Roubaud et al. 1990).phytoplankton and phytobenthos productivity (Charpy & Charpy-Roubaud 1990),zooplankton (Leborgne et al. 1989) and particulate organic matter standing stocks and fluxes (Blanchot et al. 1989, Charpy & Charpy-Roubaud 1991) have been described previously. Sampling. The present work was performed during 6 field trips in Tikehau in January 19 to 25, 1991, November 9 to 15, 1991 (start of the rainy season), March 15 to 21, 1992 (end of the rainy season), November 8 to 22, 1992, May 16 to June 3, 1993 and July 31 to August 19. 1994 (dry season). During the 6 field trips, samples were collected daily (at 09:OO or at 16:OO h) from the lagoon reference station at 0.5 n~ depth (total depth of station 20 m; Fig. 1) representative of the main part of Tikehau lagoon (average depth 25 m). Two die1 studies were conducted on November 17 to 18, 1992, and May 24 to 25, 1993. Bacterial variables were determined for 10 vertical profiles during the November 1991, March 1992, November 1992 and May 1993 studies. Water characteristics in a reef-flat spillway were studied at the reference spillway station bordering the village island to the east. This opening is 800 m long and 150 m wide with an average depth less than 1 m. The hydrodynamic characteristics of this spillway were studied previously (Lenhardt 1991). Oceanic surface (0.5 m deep) water samples were collected on the southern part of the atoll (Fig. 1). Water samples were collected using acidwashed Niskin bottles and treated at the ORSTOM f ~ e l dstation within 1 h after sampling. All sample handllng was performed using either disposable sterile hardware or acid-washed polycarbonate bottles. Bacterial parameters. Bacterial abundance was determined using epifluorescence microscopy (Porter & Feig 1980). The percentage of bacteria attached to particles and the frequency of dividing-divided cells (FDDC; Newel1 & Christian 1981) were distinguished on the same filters. Bacterial activity was estimated using [methyl-3H]thymidine (TdR) incorporation into DNA (Fuhrman & Azam 1982) and [4,5-3H]leucine (Leu) incorporation into proteins (Kirchman et al. 1985). The protocols employed in this study are described in detail elsewhere (Torreton & Dufour 1996).Conversion factors for TdR and Leu were determined in unenriched batch cultures of lagoon water using a cumulative calculation method (Bjnrnsen & Kuparinen 1991). Conversion factors for TdR and Leu
253
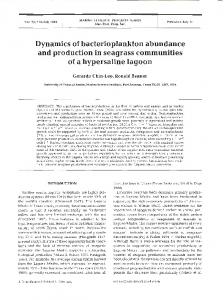
Fig. 1 Map of Tikehau atoll s h o ~ l i n gthe reference station. Pinnacles are abundant in the lagoon, but the reference pinnacle 1s the only one represented. Dotted a n d dashed lines represent village to reference station and reference reef-flat spillway to lagoon transects, respectively. Oceanic stations ( a ) were visited twice on May 22 and 24, 1993
averaged (%SD)0.80 (k0.29) X 10'' and 0.91 (-c0.34) x 10" cells mol-l, respectively (Torreton & Dufour 1996). The average Leu/TdR ratio is 13.1 in Tikehau lagoon, and TdR and Leu derived production values do not differ significantly (Torreton & Dufour 1996). Therefore, the weight average of 0.99 X 10" [(0.80X 10¹⁸ + 0.91 X 1017 x 13.1)/2] and 0.76 X 10¹⁷ cells mol-' l(0.80 x 10'8/13.1 + 0.91 X 101')/2] were calculated for TdR and Leu conversion factol-S,respectively. Replicate determination~differed on average by less than 10% for total bacterial counts, 15% for FDDC and 6 % for TdR and Leu incorporation rates. The percentage of attached cells is less precise as 4 % attached bacteria (average in the lagoon) represent only 16 cells out of 400 (minimum of cells enumerated per sample) and depends greatly on the presence of rare particles in the fields examined. We thus consider that only average values per cruise are significant using this procedure. Statistical analysis. Correlation and regression analyses were performed according to Snedecor & Cochran (1957).
RESULTS Spatial variations Vertical variations. To examine the vertical distribution of bacterioplankton parameters in the water column, a total of 10 profiles of bacterioplankton pararne-
254
Aquat Microb Ecol 11: 251-261, 1996
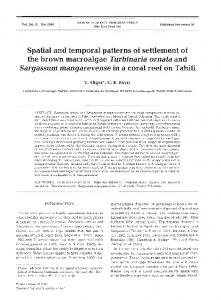
ters were taken at the reference station (20 m). Bacterial parameters showed little variation through the water column with average coefficients of variation (CV) of 10, 14 and 18% for bacterial abundance, production and growth rate, respectively. When all the values were expressed as a percentage of the water column average no significant trend was noticeable (Fig. 2). The water column may thus be considered homogenous for bacterioplankton parameters in this lagoon. Horizontal variations. Horizontal homogeneity of POC (particulate organic carbon), PON (particulate organic nitrogen), POP (particulate organic phosphorus), ATP (adenosine triphosphate) and pigments has been reported at the lagoon scale by Charpy & Chdrpy-Roubaud, (1991) and for nutrients by CharpyRoubaud et al. (1990).This justified the use of 1 lagoon reference station (see Fig. 1).We invest~gatedhorizontal variations In bacterioplanktonic abundance and activity at a smaller scale along 2 different transects: from the village to the reference station and from a reef-flat spillway to the main lagoon (Fig. 1). Village to the reference station transect: Bacterial numbers showed little differences along the transect (Fig. 3). TdR incorporation rate decreased sharply from
% average value 50
100
% average value
15050
100
150
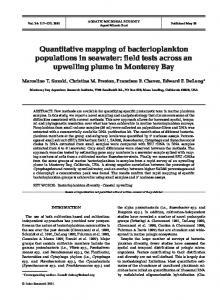
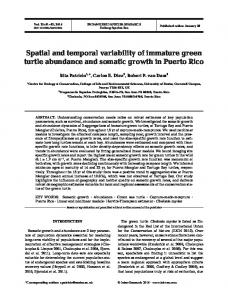
69-82 pm01 1-' h-' near the shore to 12-14 pm01 1-' h-' between 150 and 4500 m from the beach. High values near the beach were reflected in calculated bacterial generation times ul0.7-0.9 d in the first 100 nl from the beach compared to 3.4-4.7 d further into the lagoon. Leu incorporation rates followed the same pattern as TdR. Maximum values (900 to 1200 pm01 1-l h-') were recorded at the 2 stations near the beach and Leu incorporation decreased drastically to 100-120 pm01 1-' h-' into the main part of the lagoon. The differences were also reflected in FDDC values which ranged from 10.4-12.7% near the village to 6.7-8.3% in the main part of the lagoon. The nearshore increase of bacterioplankton variables, probably related to human activities, seems thus limited to the first 100 m from the shore (Fig. 3). Reef-flatspillway characteristics: On May 23, 1993, bacterial parameters and water velocity were recorded cvery 2 h over a tidal cycle in the reef-flat spillway (Fig. 4). Current speed ranged from 6 to 29 cm s averaging 14 cm s-' This value is close to the annual influx average (11 cm S-'; Lenhardt 1991) through this reefflat spillway. Bacterial abundance and activity appeared to be maximal at the beginning of the inflow and decreased through the tidal cycle. Water flowing through the reef-flat spillway showed bacteriological characteristics distinct from average bacterial parameters in oceanic waters at the same times (May 22 and 24; see location in Fig 1) indicating some changes during the flow. Four significant differences were observed (Table 1):
'
Ceii
ol nJ!!:!!m l 10
'
8
,,,Ill;
100
l
l r,llll,
l
r
, l ,
Ido0
meters from the shore
Fig. 2. Average vertical profiles for abundance (Cells), prod u c t ~ o n(" thymidine incorporation, T T I ) and growth rates (TTl/cell) of bacterioplankton expressed as a percentage of the average values for each water column. Error bars represent standard deviations (n = 10)
Fig. 3. Change in abundance (Cells, 10' 1-'), 3 H - t h y m ~ d ~ n e lncorporatlon (TTI, pm01 1 ' h - ' ) , 'H-leuclne incorporation (Leu, pm01 I-' h-') and frequency of dividing-divided cells (FDDC, ?h)along a transect from the shore to the lagoon reference station (November 13, 1992).Filled symbols a n d error bars on the right. represent average values a n d standard deviations in Tikehau lagoon reference station during the same study period (n = 14)
Torreton & Dufour: Bacterioplankton blomass and productivity in an atoll lagoon
20
-
-
T-
U)
E -
,
v
3
0 C .-
G=
-
0
Fig. 4. Temporal variat~onsin bacterial variables recorded In water flowing across a reef-flat spillway. Dotted line represents inflow speed. Symbols and units as in Fig. 3 - a 33% decrease of cell numbers (average 0.3 X 10%ells I-') relative to the ocean (average 0.45 X 10"ells I-'). - an increase of specific TdR incorporation rate per cell by 3.2-fold on average. This increase in bacterial activity reflects better growth conditions in the reefflat spillway than in oceanic waters. If we assume that the average TdR conversion factor determined in the lagoon (0.99 X 10¹⁸cells mol-') may be applied to reefflat spillway and oceanic waters, with 8.4 and 2.6 X m01 cell-' h-' (Table 1) bacteria showed average generation times ( l / p ) of 5 and 16 d, respectively. - an increase of specific Leu incorporation rate per cell by 4.1-fold on average, thus a greater increase
255
than for TdR incorporation. This led to a significant ( p < 0.01) increase of the Leu/TdR ratio from 24 in oceanic waters to 31 in the reef-flat spillway. - an increase of the number and proportion of attached cells (7.4%) compared to oceanic waters (1.5%). Reef-flat spillway to lagoon transect: A transect between the reef-flat spillway and the main part of the lagoon was investigated on November 12, 1992. Inflow speed was 11 cm S-', a value very close to the annual average (see above). Low abundances, typical of reefflat spillway values (0.3 to 0.4 X l o g cells I-'), were found up to 200 m inside the lagoon and increased sharply to 1.3 X 10' cells I-' 300 m inside and further (Fig. 5). The same pattern was observed for TdR incorporation rates with values between 1.0 and 1.3 pm01 I-' h-' from the spillway to 200 m into the lagoon, increasing to 17-21 pm01 I-' h-' 300 m or further inside the lagoon. FDDC increased in parallel from 3.6% in the spillway to 7 % in the lagoon. The influence of the reef-flat spillway seems thus limited to less than 300 m into [he lagoon during an 11 cm S-' inflow. At 300 m from the reef-flat spillway opening to the lagoon, bacterial parameters were quite typical of lagoonal values (Fig. 5 ) .
Temporal variations Die1 variations. The die1 cycles of abundance and activity were studied on November l?, 1992, and on May 24, 1993, using samples collected at 0.5 m at the reference station. Results (Table 2) show that diurnal variations were very slight with coefficients of variation always less than 20% for bacterial abundance, production (TdR and Leu) and growth rate indexes (FDDC, TdR/cell and Ledcell), with no significant trend with time of day.
Table 1. Lagoon, reef-flat sp~llwayand oceanic water characteristics in May 1993. Cells. total bacterial abundance (10"~'); FDDC: frequency of dividing-divided cells ( % of total); %ATT, percentage of attached cells; TTI: tritiated thymidine incorporation (pm011-' h-'); Leu: leucine ~ncorporation(pm01 1-' h-'); TTI/cell: thymidine incorporation rate per cell (10-" m01 I-' h-'); Ledcell: leucine incorporation rate per cell (IO-~'m01 1-' h-'). p: significance of the differences between reef-flat spillway and oceanic water averages was determined using a non-parametric Mann-Whitney test. ns: not significant; ' p < 0.05; "p < 0.01; "'p < 0.001 Site
Cells
FDDC
%AT
TT1
Leu
TTI/cell
8.1 1.8
2.1 2.1
11.9 2.2
168 31
5.1 1.1
71 13
7.4 3.4
2.6 1.0
79 33
8.4 2.6
260 92
Lagoon May 16 to June 3 (n = 19)
Mean SD
2.37 0.27
Reef-flat spillway May 23 (n = 7)
Mean SD
0.30 0.06
Ocean May 22 and 24 (n = 10)
Mean SD
0.45 0.08
p: reef-flat splllway/ocean p: reef-flat spillwayAagoon p: ocean/lagoon
Ledcell
Aquat Microb Ecol 11 251-261, 1996
256
0 00
-B-----oo o%---------..o.&--o-Q Q1° O _____July 94 $ r = 0.46
1
10
100
1000
meters from the reef flat spillway
Fig. 5. Change in bacterjoplankton variables along a transect from the reference reef-flat soillwav to the laaoon reference station (November 12. 1992). % A n : percentage of attached bacteria; other symbols and units as in Fig. 3. Filled symbols and error bars on the right represent average values and standard deviativr~sin Tikehau iagoon during thc same study period (n = 14)
0
5 Wind speed (m
10 S-1 )
4
Fig. 6. Raidllollship between bacterial a b u ~ d a n c eand wind speed averaged over the 24 h before sampling during May 1993 and July 1994 study periods
Rangiroa atoll near Tikehau atoll (Lenhardt 1991). We thus divided the datasets from the 2 last field trips Day-to-day fluctuations. Bacterial parameters were according to this value (5 m S-'). On average, bacterial abundance was between 10 and 20% greater during recorded every day at 09:OO h based on samples at the the days where wind speed exceeded 5 m S-' ( p < 0.05). reference station (0.5 m depth) over periods ranging The influence of wind speed on bacterioplankton profrom 1 to 3 wk during the 6 cruises. All the parameters varied slightly from day to day with CV values around duction and other parameters was not significant. 20% for bacterioplankton biomass, production and Seasonal variations. We are aware that a seasonal growth rate (Table 3). The range of variation (maxitrend determined using average values at different mum/minimum) for each study period was limited to seasons spread over 3 years could be biased by inter2.2-fold for bacterial abundance and TT1 incorporation, annual variations. However, the amplitude of seasonal 2.9-fold for Leu incorporation and 3.6-fold for specific variation may be evaluated using the results of the 6 field trips distributed through the year from January incorporation rates per cell. We tried to examine whether wind velocity influ1991 to August 1994 and covering the rainy season (November to March) and the dry season (April to enced day-to-day variability of bacterial processes. Wind speed was recorded continuously during the last October). Table 3 shows that, except for the proportion 2 field trips. In the May 1993 and August 1994 study peof attached cells, the maximum variation was a factor riods, as usual in austral winter (Lenhardt 1991),domiof 3 for TTI/cell. This was mostly due to variation in nant winds were from the southeast. When correlations abundance. Indeed, bacterial abundance (CV = 34 %) were examined between bacterial parameters and appears to fluctuate more than bacterial production as wind speed averaged 24 h before sampling, wind speed reflected by TdR (CV = 10 %) and Leu incorporation These slight fluctuations did not show any appeared to have a significant influence on total abun(CV = 11 X). evident seasonal trend. Moreover, the differences bedance (Fig. 6). Wind speed averages 4.9 m ss' yearly in tween the 2 field trips in November 1991 and 1992 are almost equal to the differTable 2. Average (Avg.),coefficient of variation (CV'K) and rnaxlmurn ampliences between the other field trlps (see tude (Max/rninj oi bacieriopid~~kivl~ palanliters de:ern;i;,cc! ::.cry 1 h =!c?.; 7 Fig. 7). diurnal cycles (9 values for each cycle). Symbols and units as in Table 1 Date
Cell
Nov 17, 1992 Avg. CVc% Max/min May 24, 1993 Avg. CV% Max/min
2.18 7
8.4
1.3
1.6
2.27 5
8.0 15 1.7
1.2
FDDC TT1 14
Leu TTl/cell Leu/cell
16.9 13 1.4
182 10 1.3
7.8 16 1.5
1.4
13.1
191 14 1.5
5.8 13 1.5
85 16 1.7
10 1.4
DISCUSSION
84
9
Spatial variations In T~kehaulagoon, vertical profiles of bacterioplanktonic abundance and activity in different seasons show that homo-
Torreton & Dufour. Bacter~oplanktonbiomass and productivity in an atoll lagoon
Table 3. Average (Avg.), coefficient of variation (CV%) and maximum amplitude (Max/min) of bacterioplankton variables in surface water (0.5 m deep) of Tikehau lagoon recorded daily during each study period. Symbols and units as in Table 1
I
Study period Jan 1991 (6 d ) Nov 1991 (6 d ) Mar 1992 (7 d)
Nov 1992 (14 d ) May 1993 (19 d ) Aug 1994 (21 d)
Cells
FDDC
'%,AI7
TT1
Leu
TTI/cell
Ledcell
Avg . CV % Max/min Avg. CV % Max/min Avg CV % Max/min Avg. CV %
Max/min Avg. CV %
Max/min Avg. CV % Max/min
Mean for avg." CV%" Max/mind
I dMean, coefficient of variation and maximum amplitude for the 6 study period averages geneity is the rule at the scales considered here. Vertical homogeneity of nutrients (Charpy-Roubaud et al. 1990) has been reported previously in this lagoon. Chl a, POC, PON, and ATP are also distributed homogeneously except in the near-bottom layer (1 m above sediments) where chl a, POC, and PON increase on average by 30% (Charpy & Charpy-Roubaud 1991). The bottom layer was not investigated systematically during this study but the samples that were taken revealed no discernible differences compared to other levels in another atoll lagoon (Takapoto; authors' unpubl. data). The vertical homogeneity is probably caused by wind mixing due to constant eastern trade winds (4.9 m S-' annual average; Lenhardt 1991). The study of horizontal variations shows some differences. Bacterial growth rate may vary 20-fold from 1.5 d-' near the wharf under human influence to 0.08 d-' near the reef-flat spillway where oceanic waters are entering into the lagoon (see Figs. 3 & 5). However, these departures from average conditions in the lagoon are very limited in space (