Dec 29, 2004 - Research Center for Prediction of Earthquakes and Volcanic Eruptions, Graduate School of Science, Tohoku University,. Sendai, Japan.
GEOPHYSICAL RESEARCH LETTERS, VOL. 31, L24616, doi:10.1029/2004GL021103, 2004
Temporal change of seismic structure around Iwate volcano inferred from waveform correlation analysis of similar earthquakes Teruo Yamawaki, Takeshi Nishimura, and Hiroyuki Hamaguchi Research Center for Prediction of Earthquakes and Volcanic Eruptions, Graduate School of Science, Tohoku University, Sendai, Japan Received 25 July 2004; revised 11 November 2004; accepted 29 November 2004; published 29 December 2004.
[1] We investigate the temporal change of crustal structure around Iwate volcano, northeastern Japan, using calculations of the cross-correlation coefficients of P- and S-waves of pairs of similar earthquakes that occurred between 1995 – 2002 at the subducting Pacific Plate boundary. While large coefficients are observed at most stations throughout the period, two stations located on the southwestern slope of Iwate volcano exhibit small S-wave coefficients. The coefficients at these two stations decreased remarkably from 1998, corresponding to a period of significant volcanic activity and an M6.1 earthquake. Since 2000, the coefficients have recovered gradually, suggesting their correlation with the activity of Iwate volcano. The coefficients of P-waves at these stations are large compared to those of S-waves, suggesting that temporal change in the crustal structure beneath these stations occurred in elastic properties to which S-waves are sensitive, such as rigidity, related to magmatic and/or INDEX seismic activity in and around the volcano. TERMS: 0935 Exploration Geophysics: Seismic methods (3025); 7280 Seismology: Volcano seismology (8419); 8015 Structural Geology: Local crustal structure. Citation: Yamawaki, T., T. Nishimura, and H. Hamaguchi (2004), Temporal change of seismic structure around Iwate volcano inferred from waveform correlation analysis of similar earthquakes, Geophys. Res. Lett., 31, L24616, doi:10.1029/2004GL021103.
1. Introduction [2] Significant seismic activity and associated crustal deformation have been observed since February 1998 at Iwate volcano [Tanaka et al., 2002; Miura et al., 2000; Nakamichi et al., 2003], northeastern Japan (Figure 1). An M6.1 earthquake occurred southwest of the volcano on September 3, 1998. Nishimura et al. [2000], Matsumoto et al. [2001], and Nakamura et al. [2002] noted temporal changes in seismic velocity and heterogeneity of the crustal structure through analyses of seismic waves excited by two active experiments that were carried out one month before and two month after the M6.1 earthquake. However, the interval between the two experiments is only three months, rendering it necessary to obtain additional data for investigating the temporal changes before and after the 1998 activity. [3] In this article, earthquakes radiating similar seismic waves from the same locations are employed as natural control sources [e.g., Poupinet et al., 1984, 1996; Ellsworth et al., 1992] to examine the temporal changes of the crustal Copyright 2004 by the American Geophysical Union. 0094-8276/04/2004GL021103$05.00
structure due to magma and/or hydro-magmatic intrusions into the shallow crust beneath Iwate volcano. The use of similar earthquakes has previously been applied to detect temporal changes around fault zones [e.g., Poupinet et al., 1984; Ellsworth et al., 1992] and active volcanoes [e.g., Poupinet et al., 1996]. The primary difference between our study and these predecessors is that the target area is fairly distant from hypocenters of similar earthquakes and that many events with large azimuthal variation are used. In northeastern Japan, many similar earthquakes have been observed at the subducting Pacific Plate boundary [Hamaguchi and Hasegawa, 1975; Igarashi et al., 2003; Uchida et al., 2003]. It is possible to evaluate separately the structure in terms of P- and S-wave responses. We perform cross-correlation analysis of the seismic waveforms of similar earthquakes and compare the spatiotemporal variation in waveform similarity to the volcano’s activity.
2. Data and Analysis [4] A total of 73 groups of similar earthquakes (Figure 1) observed in the period between 1995 and 2002 were selected from the data reported by Igarashi et al. [2003] and Uchida et al. [2003]. Each group consists of 2 to 20 earthquakes with magnitudes ranging from 2.1 to 4.8. From these groups, 1121 event pairs were selected, where each pair had a magnitude differences of 0 to 1.5 (most less than 0.3). Short-period seismic waveforms recorded by vertical-component seismometers at 30 stations within approximately 80 km of the summit of Iwate volcano were analyzed. All the stations were operated with a sampling frequency of 100 Hz, and are maintained by the Research Center for Prediction of Earthquakes and Volcanic Eruptions, Tohoku University. [5] The waveform similarity was quantitatively evaluated by calculating the cross-correlation coefficients of P- and S-waves at each station. First, a 4 – 8 Hz bandpass filter was applied to each waveform. Then 5-second waveforms starting at P- and S-wave onsets were extracted from the waveform of the earlier event. Onsets of P-waves were picked by eye and those of S-waves were estimated from the travel pffiffiffi times of P-waves based on an assumption of Vp/Vs = 3. We used only waveforms with S-P times longer than 5 s. Cross-correlation coefficients were estimated by aligning the extracted waveforms to the waveforms of the later event so that the coefficient was maximized. Pairs of waveforms with coefficients of less than 0.6 were discarded to avoid potential misalignment or dissimilar source processes.
L24616
1 of 4
L24616
YAMAWAKI ET AL.: TEMPORAL CHANGE OF SEISMIC STRUCTURE
L24616
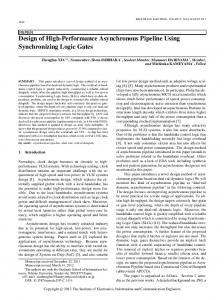
Figure 3 for the locations.) sorted by epicentral distances. The pair occurred on May 13, 1998, and on March 20, 1999, representing a temporal separation of about 10 months. Stations FD2 and ANS exhibit nearly identical pairs of waveforms and their coefficients are larger than 0.97 both for P- and S-waves. On the other hand, stations IKG and GNB exhibit some difference in waveforms, and their coefficients are smaller than other stations.
3. Spatial Variation of Cross-Correlation Coefficients
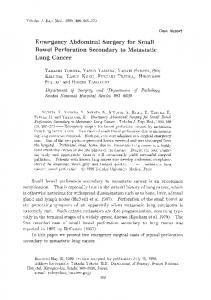
Figure 1. Distribution of similar earthquakes (stars) used in the study and seismic stations (squares). Summit of the Mt. Iwate is indicated by an open triangle. Location of the surveyed area in Japan is shown in the inset.
[8] The cross-correlation coefficients of S-waves were calculated for each pair of similar earthquakes at each station. The coefficients at most stations are distributed between 0.9 and 1.0, with average coefficients of 0.96 to 0.98. The average for all stations (hCi) is 0.972. The
[6] The following criteria were then applied to ensure that only data with excellent repeatability were selected for the pairs of similar earthquakes: (1) Waveform data satisfying a P-wave signal-to-noise ratio of greater than 5 are available at more than 10 stations, and (2) more than 5 stations have cross-correlation coefficients larger than 0.95 both for P- and S-waves. These criteria reduce the number of the usable similar earthquake groups to 47 and number of pairs to 371. We infer that the source locations of similar earthquakes coincide with one another within 100 –200 m which is one quarter wavelength of S-waves at 4 – 8 Hz. [7] Figure 2 shows examples of filtered waveforms from a pair of similar earthquakes observed at 4 stations (See
Figure 2. Example of seismograms for a pair of similar earthquakes that occurred on May 13, 1998 (A) and March 20, 1999 (B). Seismograms at 4 stations are listed according to the epicentral distances. See Figure 3 for the locations. The time windows applied for estimating cross-correlation coefficients of P- and S-waves are indicated by arrows, and the coefficients are given in parentheses beside the arrows.
Figure 3. Spatial distribution of averaged cross-correlation coefficients calculated for S-waves at each station. Positive and negative differences between each station average and average of the entire data set (hCi = 0.972) are indicated by the magnitude of open and solid circles, respectively. Station codes are attached to each circle. The summit of Iwate volcano is indicated by an open triangle. (a) All stations. (b) Local map of Iwate volcano area. Notable crustal activities that occurred in 1998 in this area are also shown. The two shaded ellipsoids represent the seismogenic zones of volcanic earthquakes from February to August 1998. The line segment and diamond denote the location of a dike and a spherical pressure source, respectively [Tohoku University, 2003]. The star and broken rectangle show the epicenter and plane view of the dip-slip fault of the M6.1 earthquake, respectively.
2 of 4
L24616
YAMAWAKI ET AL.: TEMPORAL CHANGE OF SEISMIC STRUCTURE
L24616
difference of �0.09, attributable to many similar earthquake pairs having large negative differences as large as �0.27. Station GNB, located on the mountain slope close to station IKG, also displays a large difference of �0.02.
4. Temporal Change of Cross-Correlation Coefficients [9] The temporal changes of cross-correlation coefficients were investigated for pair of similar earthquakes with occurrence intervals ranging from 0.5 to 1.5 years. Figures 4a and 4b show the results for stations having large and small average coefficients. The coefficients observed at stations distant from the volcano range from 0.85 to 1.0 and are less scattered throughout the entire period from 1995 to 2002 (Figure 4a). On the other hand, the coefficients for stations southwest of the volcano exhibit a wider range in the same period, with a clear temporal change (Figure 4b). The coefficients at IKG are in the range between 0.85 and 1.0 prior to 1998, and decrease to 0.75– 0.9 in the period from 1998 to 1999. After 2000, the coefficients increase again to 0.8 – 1.0. Station GNB shows a slight decrease in the maximum coefficient around 1998. Stations OGM, OYU, NNG and NAM, where we observed relatively large negative differences in Figure 3, do not show notable temporal changes.
5. Discussion
Figure 4. Temporal changes in S-wave cross-correlation coefficients at (a) stations far from the volcano and (b) stations southwest of the volcano. Horizontal lines indicate cross-correlation coefficients for each pair of similar earthquakes. The left and right ends of each horizontal line indicate the time at which the pair of similar earthquakes occurred. The number of pairs plotted is shown beside the station code in parentheses. (c) Daily number of earthquakes around Iwate volcano. (d) Cumulative volume increase of dike (broken line) and spherical pressure sources (solid line) indicated in Figure 3b. difference between the average cross-correlation coefficients and hCi at each station is shown in Figure 3. At most of the stations located far from the volcano or to the north and east of the volcano, the differences fall in the range of ±0.01. However, at stations located to the west or southwest of the volcano, large negative differences are obtained (Figure 3b). Station IKG, located on the mountain slope 5 km southwest of the summit, exhibits a large
[10] Figure 3b shows the locations of the volcanic pressure sources detected by the tiltmeters, strainmeters and the global positioning system (GPS) network [Tohoku University, 2003], the epicenters of volcanic earthquakes [Tanaka et al., 2002], and the fault zone of the M6.1 earthquake [Miura et al., 2000]. Stations IKG and GNB are very close to these significant sources of crustal activity, suggesting that the degradation of waveform similarity is related to the volcanic activity. [11] As shown in Figure 4, the temporal changes correlate well with the activity of Iwate volcano, typically recognized as a persistent high rate of seismicity lasting for more than 1 year from 1998 (Figure 4c) and an accumulated volume change of volcanic pressure sources (Figure 4d) [Tohoku University, 2003]. [12] If these changes were due to a small difference in hypocenter locations of similar earthquakes, the observed coefficients should be lowered at many stations in a wide area. What we observed is, however, local degradation of
Figure 5. Latitudinal dependence of cross-correlation coefficients at station IKG (a) before and (b) after 1998. Circles show latitude of the pair of similar earthquakes and calculated coefficients used in Figure 4. Dashed line indicates the latitude of station IKG.
3 of 4
L24616
YAMAWAKI ET AL.: TEMPORAL CHANGE OF SEISMIC STRUCTURE
L24616
smaller coefficients for S-waves than for P-waves. As the coefficients of S-waves at these stations are relatively small compared to those of P-waves, it is considered that elastic properties to which S-waves are more sensitive, such as the rigidity of the rocks, underwent temporal change in response to the volcanic activity, possibly related directly to magmatic and/or hydro-magmatic activity.
Figure 6. Comparison between average cross-correlation coefficients for P- and S-waves at each station (circles). Solid line indicates the case where the averages for P- and S-waves are the same, and the dashed lines indicate deviation of ±0.04 from this average. The data are labeled with the codes of stations southwest of the volcano as shown in Figure 4b. the coefficients at two stations that are located close to one another. Therefore, the degradation is considered to be due to temporal changes of the crustal structure close to the volcano. [13] Figure 5 shows the relation between the crosscorrelation coefficients at station IKG and the latitude of similar earthquakes. Almost all the coefficients for the pairs of similar earthquakes before 1998 are larger than 0.95. However, after 1998, some of the coefficients for the pairs occurring just east of the volcano indicate small values less than 0.8. Since the seismic waves arriving at IKG from these pairs propagate parallel to the strike of the most active zone (see Figure 3), we infer that the observed small crosscorrelation coefficients mainly originate from the structural changes beneath the volcano. [14] The observed coefficients appear to be independent of the magnitude of the similar earthquakes. Regarding criteria for selection of similar earthquakes, although we chose crosscorrelation coefficient of P- and S-waves, other criteria such as cross-correlation coefficient at a specific station also produced a similar result. Cross-correlation coefficients within the frequency band of 2 – 4 Hz show similar spatial and temporal changes to those between 4 – 8 Hz, but it is difficult to examine the coefficients at other frequency bands because of low signal-to-noise ratios of waveforms and/or waveform dissimilarity at high frequencies. [15] Although the cross-correlation coefficients of P-waves were also examined, the spatial and temporal changes were not as pronounced as for the S-waves. However, comparing the coefficients between P- and S-waves provides additional constraints on the changes of the crustal structure. Figure 6 shows the average coefficients of P- and S-waves at each station. At most stations, the values fall within the ±0.04 margin around the identical value (solid line). However, the coefficients at station IKG deviate from the solid line. Station GNB also indicates
[16] Acknowledgments. The authors would like to thank all members of the Research Center for Prediction of Earthquakes and Volcanic Eruptions of Tohoku University for their continuous contribution to the collection of high-quality earthquake data and for valuable discussions. Special thanks are due to Toshihiro Igarashi, Naoki Uchida, Satoru Tanaka, Sadato Ueki, Minemori Sato and Satoshi Miura for providing hypocentral parameters for similar and local earthquakes, as well as the locations of volcanic pressure sources. Constructive comments and helpful suggestions by two anonymous reviewers helped greatly to improve the manuscript. This study was supported in part by the National Project for Prediction of Volcanic Eruptions and a scientific grant (No. 13440128) from the Ministry of Education, Culture, Sports, Science and Technology (MEXT) of Japan.
References Ellsworth, W. L., A. T. Cole, G. C. Beroza, and M. C. Verwoerd (1992), Changes in crustal wave velocity associated with the 1989 Loma Prieta, California, earthquake, Eos Trans. AGU, 73(43), Fall Meet. Suppl., 360. Hamaguchi, H., and A. Hasegawa (1975), Recurrent occurrence of the earthquakes with similar wave forms and its related problems (in Japanese with English abstract), J. Seismol. Soc. Jpn., 28, 153 – 169. Igarashi, T., T. Matsuzawa, and A. Hasegawa (2003), Repeating earthquakes and interplate aseismic slip in the northeastern Japan subduction zone, J. Geophys. Res., 108(B5), 2249, doi:10.1029/2002JB001920. Matsumoto, S., K. Obara, K. Yoshimoto, T. Saito, A. Ito, and A. Hasegawa (2001), Temporal change in P-wave scatterer distribution associated with the M6.1 earthquake near Iwate volcano, northeastern Japan, Geophys. J. Int., 145, 48 – 58. Miura, S., S. Ueki, T. Sato, K. Tachibana, and H. Hamaguchi (2000), Crustal deformation associated with the 1998 seismo-volcanic crisis of Iwate volcano, northeastern Japan, as observed by a dense GPS network, Earth Planets Space, 52, 1003 – 1008. Nakamichi, H., H. Hamaguchi, S. Tanaka, S. Ueki, T. Nishimura, and A. Hasegawa (2003), Source mechanisms of deep and intermediate-depth low-frequency earthquakes beneath Iwate volcano, northeastern Japan, Geophys. J. Int., 154, 811 – 828. Nakamura, A., A. Hasegawa, N. Hirata, T. Iwasaki, and H. Hamaguchi (2002), Temporal variations of seismic wave velocity associated with 1998 M6.1 Shizukuishi earthquake, Pure Appl. Geophys., 159, 1183 – 1204. Nishimura, T., N. Uchida, H. Sato, S. Tanaka, and H. Hamaguchi (2000), Temporal changes of the crustal structure associated with the M6.1 earthquake on September 3, 1998, and the volcanic activity of Mount Iwate, Japan, Geophys. Res. Lett., 27, 269 – 272. Poupinet, G., W. L. Ellsworth, and J. Frechet (1984), Monitoring of velocity variations in the crust using earthquake doublets: An application to the Calaveras fault, California, J. Geophys. Res., 89, 5719 – 5731. Poupinet, G., A. Ratdomopurbo, and O. Coutant (1996), On the use of earthquake multiplets to study fractures and the temporal evolution of an active volcano, Ann. Geofis., 39(2), 253 – 264. Tanaka, S., H. Hamaguchi, S. Ueki, M. Sato, and H. Nakamichi (2002), Migration of seismic activity during the 1998 volcanic unrest at Iwate volcano, northeastern Japan and with reference to P and S wave velocity anomaly and crustal deformation, J. Volcanol. Geotherm. Res., 113, 399 – 414. Tohoku University (2003), Seismic activity and crustal deformation at Iwate volcano in the period from June 2001 to September 2002 (in Japanese), Rep. Coord. Comm. Predict. Volcanic Eruptions, 83, pp. 6 – 13, Sendai, Japan. Uchida, N., T. Matsuzawa, A. Hasegawa, and T. Igarashi (2003), Interplate quasi-static slip off Sanriku, NE Japan, estimated from repeating earthquakes, Geophys. Res. Lett., 30(15), 1801, doi:10.1029/2003GL017452. ����������������������
H. Hamaguchi, T. Nishimura, and T. Yamawaki, Research Center for Prediction of Earthquakes and Volcanic Eruptions, Graduate School of Science, Tohoku University, Sendai 980-8578, Japan. (yamawaki@aob. geophys.tohoku.ac.jp)
4 of 4