Accepted Manuscript Methods Matter: Testing Competing Models for Designing Short-scale Big-Five Assessments Gabriel Olaru, Michael Witthöft, Oliver Wilhelm PII: DOI: Reference:
S0092-6566(15)30013-1 http://dx.doi.org/10.1016/j.jrp.2015.09.001 YJRPE 3493
To appear in:
Journal of Research in Personality
Received Date: Revised Date: Accepted Date:
23 February 2015 31 August 2015 2 September 2015
Please cite this article as: Olaru, G., Witthöft, M., Wilhelm, O., Methods Matter: Testing Competing Models for Designing Short-scale Big-Five Assessments, Journal of Research in Personality (2015), doi: http://dx.doi.org/ 10.1016/j.jrp.2015.09.001
This is a PDF file of an unedited manuscript that has been accepted for publication. As a service to our customers we are providing this early version of the manuscript. The manuscript will undergo copyediting, typesetting, and review of the resulting proof before it is published in its final form. Please note that during the production process errors may be discovered which could affect the content, and all legal disclaimers that apply to the journal pertain.
1
Big Five Short Scale Construction
Methods Matter: Testing Competing Models for Designing Short-scale Big-Five Assessments Gabriel Olaru Universität Ulm Michael Witthöft Johannes Gutenberg-Universität Mainz Oliver Wilhelm Universität Ulm
Author Note All statements expressed in this article are the authors' and do not reflect the official opinions or policies of the Universität Ulm, Johannes Gutenberg-Universität Mainz or any of the authors' host affiliations. Correspondence concerning this article should be addressed to:
[email protected].
2
Big Five Short Scale Construction
Abstract Many psychological instruments are psychometrically inadequate because derived person-parameters are unfounded and models will be rejected using established psychometric criteria. One strategy towards improving the psychometric properties is to shorten instruments. We present and compare the following procedures for the abbreviation of self-report assessments on the Trait Self-Description Inventory in a sample of 14,347 participants: (a) Maximizing Reliability/Main Loadings, (b) Minimizing Modification Indices/Cross Loadings, (c) the PURIFY Algorithm in Tetrad, (d) Ant Colony Optimization, and (e) a Genetic Algorithm. Ant Colony Optimization was superior to all other methods in improving the model fit of short scales. We conclude that in lengthy inventories Ant Colony Optimization currently represents the most purposeful and versatile method for developing psychometrically sound brief personality scales.
Keywords: Short Scale, Item Selection, Personality, Maximizing Main Loadings, Modification Index, Purify, Ant Colony Optimization
3
Big Five Short Scale Construction 1. Introduction Limited time, resources, or participants’ willingness (or capability) to complete extensive questionnaires (with many items per construct) appear one of the reasons driving a recent trend towards developing short form assessments of pivotal psychological phenomena (see e.g., Donnellan, Oswald, Baird, & Lucas, 2006; Gosling, Rentfrow, & Swann, 2003;
Ramstedt, & John, 2007; Saucier, 1994). A second reason is related to psychometric problems typically associated with long, comprehensive self-report instruments. Typically, the application of stringent measurement criteria to self-report measures of broad constructs, such as the Big Five Factor (BFF) model, suggests that the measures are psychometrically inadequate (Borkenau & Ostendorf, 1990). In the simplest case, one score is derived from any given measure because the items are supposed to measure just one trait. It is then sound to postulate and test a factor model that specifies only one latent factor. This factor is then expected to exhaustively account for the covariance structure of all items. However, when tested with strict methods such as confirmatory factor analysis (CFA) or item response theory (IRT) these models suffer from inadequate psychometric properties and are often rejected. When faced with the problem of poor model fit, one is left with the choice between ignoring the problem, questioning the adequacy of applying strict psychometric measurement criteria (Borkenau & Ostendorf, 1990; Church & Burke, 1994; Vassend & Skrondal, 1997), or deriving a short-scale solution that does meet various stringent psychometric criteria (Kano & Harada, 2000; Schulze & Roberts, 2006). In this paper we test and evaluate competing psychometric approaches to the derivation of short-scale solutions with the goal of identifying a best approach of maximizing model fit. First, we summarize five psychometric methods for shortening psychological selfreport measures. Next, we will compare and evaluate these procedures based on a large data set. Finally, the best approach to improving model fit will be applied to derive a short-scale solution for the BFF – including facet level distinctions. 1.1 Review of Previous Short-Form Assessments of the Big Five
Big Five Short Scale Construction A variety of BFF short-scale solutions is available and we will briefly review these
4
and the procedures used to derive them. The NEO-FFI (Costa & McCrae, 1989) is a 60-item short form of the well-known NEO-PI (Costa & McCrae, 1985). Costa and McCrae attempted to derive a representative measure of the BFF by maximizing the convergent validity of the short-scale factors with the corresponding factors of the NEO-PI. Costa and McCrae (1989) factor analyzed all 180 items of the NEO-PI and selected items based on their correlations with validimax factor scores on a sample of 983 persons. The twelve items with the highest main loading were selected for each of the five factors. Saucier (1994) derived the Mini-Markers from Goldberg’s (1992) Unipolar Big Five Markers. In addition to reducing the testing time, Saucier also wanted to increase the userfriendliness of the questionnaire by removing the hard to understand items. Saucier intended to keep the internal consistency at a level comparable to the full scale by selecting homogenous items. He did so by extracting five principal components with varimax rotation and subsequently selecting items with the intention to increase factor purity (only items with main loadings twice as high as their highest cross loading were selected). The resulting shortscale consists of 40 items, with 8 items per factor. Since there was a demand for still shorter BFF measures, Rammstedt and John (2007) derived a 10-item short-scale from the relatively short 44-item Big Five Inventory (John, Donahue, & Kentle, 1991). Again, a crucial objective of the item selection procedure was to maximize convergent validity with the original scale while maintaining simple structure. Therefore, items were selected based on their correlation with their corresponding factor in the full scale, as well as their main-loading compared to cross-loadings. Donnellan et al. (2006) aimed to find a balance between short completion time and adequate psychometric properties of the measurement. The main goals were to maintain a high internal consistency and construct breadth, while also minimizing correlations between the Big Five factors to maintain distinct scales. Items with the highest “discrimination score” (i.e., difference between main loading and mean of cross-loadings) were selected. Based on this procedure, 20 items were selected from the 50-item International Personality Pool – Five
Big Five Short Scale Construction 5 Factor measure (Goldberg, 1999), forming the Mini-IPIP. The 5 factor structure of the MiniIPIP was tested using CFA, which resulted in a mediocre fit (CFI = .88; RMSEA = .07). 1.2 Extant Short-Form Assessments of the Big Five: A Critique The issue of model fit was not addressed in the development of these short scales and was only evaluated for the Mini-IPIP. Maximizing the main loadings was a central requirement of the item selection procedures in the development of all of the aforementioned short scales, often with the goal of maximizing convergent validity with the full scale. Obviously, this procedure implies that the initial compilation of items has a distinct status of capturing the core of what we are interested in – despite evidence that corresponding models for such broad compilations usually do not hold once strict measurement criteria are applied (e.g., Church & Burke, 1994; McCrae, Zonderman, Costa, Bond, & Paunonen, 1996). Recent publications on shortened measures recommend caution when using shortened scales, particularly when the length is reduced to one or two items per construct, because of the loss in measurement precision and the increase in Type 1 and Type 2 error (e.g., Credé, Harms, Niehorster, & Gaye-Valentine, 2012; Kruyen, Emons, & Sijtsma, 2012, 2013a, 2013b; Schipolowski, Schroeders, & Wilhelm, 2014). While we share these concerns, we argue that the concern of loss in measurement precision is irrelevant if the initial compilation of items is not a valid representation of the underlying construct. For widely used measures, such as the IPIP measures, the NEO-PI-R, or the BFI, it has not been shown that the measures adhere to strict measurement criteria. To our knowledge, there is also no widely used general personality measure for which items were sampled from an a priori specified item domain. In other words – compilations of items, as they are included in general personality measures, are not epistemologically distinct or manifest a gold standard towards which relations should be maximized. From our perspective it is not only essential to find five factors in adequate samples of persons, but it is also crucial that the measurement model presumably describing the BFF has decent fit in order to justify the scores that are used to describe persons. Summing up a collection of items that has salient loadings on one factor and simple structure in a rotated solution is psychometrically hardly
Big Five Short Scale Construction acceptable as justification for a scale. Even if the domain from which items were sampled
6
were well-known and exhaustively described – a condition that is certainly not met in any area of traditional self-report studies – just summing up somewhat similar items is not suited to describe the relative standing of persons on fundamental personality dimensions. Therefore, we conclude that the correlation with the total score of the full scale is a questionable metric for convergent validity. BFF measurements have their origin in lexical analysis, or some related strategy that also involves selecting items from a larger pool. Further selection, targeted on removing items with undesirable attributes, can be used to achieve a BFF model structure that adheres to strict psychometric standards. A noteworthy application of this procedure can be found in the Openness Conscientiousness Extraversion Agreeableness Neuroticism Index Condensed (OCEANIC; Schulze & Roberts, 2006), a short form based on the Trait-Self Description Inventory (TSDI; Christal, 1994; Tupes & Christal, 1961). Schulze and Roberts selected the 60 items with the highest loading on their corresponding BFF, based on the principal component extraction with varimax rotation performed by Christal (1994). These items were additionally selected under the condition of retaining at least two items per facet. The remaining 60 items were reworded and the response options rescaled. Stepwise Exploratory Factor Analysis (Kano & Harada, 2000) was then applied to increase model fit for a simple 5factor model. During this selection iteration, at least one item per facet had to be retained. When tested with a CFA, the remaining 45 items yielded a remarkably good model fit for a self-report instrument of that length (CFI = .880, RMSEA = .051). Since we also used the TSDI as a starting point for deriving personality short scales, and pursued similar goals (i.e., improving model fit and maintaining facet structure), the OCEANIC will be used as a reference for our final personality short scale. However, similar to other efforts to derive short forms of BFF measures, the facet level is neglected in the OCEANIC. As a consequence, important aspects of the BFF vanish from short forms – partly as a function of the selection mechanisms that are applied.
Big Five Short Scale Construction 7 1.3 Review of the Big Five and its Measurement via the Trait-Self Description Inventory The emergence of five broad personality factors has been one of the most important developments in personality research. These so-called “Big Five” (Goldberg, 1990) include Extraversion, Neuroticism, Conscientiousness, Agreeableness, and Openness. They were first established by Tupes and Christal (1961) as five robust factors recurring in the analysis of eight data sets involving different personality instruments. Since then, the BFF model has proven to be a robust and valid representation of personality across cultures and countries (see e.g., DeRaad, 2002, McCrae & Terracciano, 2005; Schmitt, Allik, McCrae, & Benet-Martinez, 2007), lifespan (Roberts & DelVecchio, 2000; Roberts, Walton, & Viechtbauer, 2006) and different sources and samples (Digman & Takemoto-Chock, 1981). A lot of effort has been invested into understanding the structure of the BFF. Being established and developed primarily and dominantly with principal component analysis and varimax rotation (e.g., Tupes & Christal, 1961), they were implicitly assumed to show no overlap at all. Yet, correlations of nontrivial magnitude between some of the factors, particularly Extraversion and Neuroticism or Extraversion and Openness are well replicated and widely accepted (see e.g., Goldberg, 1990; Costa, McCrae & Dye, 1991; Costa & McCrae, 1992). The factors capture very broad and general traits so that they are best conceptualized as higher-order factors on top of more specific lower-order factors – sometimes labeled facets. The exact nature of the facets is still debatable and varies from study to study and from instrument to instrument (Christal, 1994; Costa & McCrae, 1995; John & Srivasta, 1999; DeYoung, 2007; Soto & John, 2009). A lot of effort was devoted to measuring more specific aspects of personality by deriving facets or first-order factors of the BFF (Christal, 1994; Costa & McCrae, 1995; DeYoung, 2007; John & Srivasta, 1999; Soto & John, 2009). Considering that there are some stronger correlations between the higher order factors (see above), not surprisingly the affiliations of some of the derived facets is still somewhat controversial. One of the goals of this article is to present a BFF short scale that captures the construct range represented in the long form of the BFF measure we used while improving adherence of the questionnaire to strict psychometric criteria. We will briefly outline the
Big Five Short Scale Construction importance and nature of each specific factor as represented in the TSDI (Christal, 1994;
8
Tupes & Christal, 1961). Extraversion in the TSDI measures the facets Shy and Bashful, Talkative, Socially Active, Assertive, and Unsociable. It covers the two central aspects Gregariousness and Assertiveness (see DeYoung et al., 2007), but lacks facets that have also been suggested as core aspects of Extraversion elsewhere such as Impulsiveness (e.g. Eysenck, 1991), Excitement Seeking (e.g. Costa & McCrae, 1992) or Positivity (e.g. Tellegen, 1985). Neuroticism is the most strongly represented factor in the TSDI. This is not surprising, since the construct has proven to be very relevant to the clinical field as predictor for mental disorders (De Raad, 2000) and was an essential part of many important personality measures such as the PEN (cf. Eysenck, 1991), the “Big Two” (Wiggins, 1968), and the early version of the NEO-Questionnaire (McCrae & Costa, 1985). The TSDI’s Neuroticism facets, Nervous and Stressed Out, Worrying, Irritable, and Envious and Jealous, overlap strongly with the NEO-PI-R (Costa & McCrae, 1992) and PEN (Eysenck, 1992) facet structures. Conscientiousness receives most of its attention in the domain of industrial and organizational psychology (Barrick & Mount, 1991; Poropat, 2009). The TSDI’s representation of this construct brakes down into the facets Efficient and Dependable, Hard Working, and Organized. All three facets were found in nearly every effort in the last two decades to assess the constructs underlying Conscientiousness (see Roberts et al., 2014). However, the fourth most important Conscientiousness-facet Self-Regulation is arguably not covered. Agreeableness is the TSDI’s second largest factor, covering the facets Warm and Sympathetic, Friendly, Considerate, Cold and Insensitive, and Helpful. Digman and Takemoto-Chock’s (1981) analyzed six different personality data sets and selected Friendly Compliance vs. Hostility Noncompliance - also covering Cooperation and Empathy – as most appropriate labels for Agreeableness. These are obviously very similar to the facets found in the TSDI. However, the TSDI lacks a representation of honesty and humility, facets that are
Big Five Short Scale Construction clearly represented in newer personality questionnaires (e.g. Costa & McCrae, 1992) but
9
might also be interpreted as a sixth important personality factor (Lee & Ashton, 2004). The most controversial of the BFF is the fifth factor, variously labeled as Culture (Norman, 1963), Intellect (Goldberg, 1990), or Openness (Costa & McCrae, 1985). Initially, this debate was focused on the question, whether intelligence is a part of personality or not (see e.g., Cattell, 1943). Even when being defined as Openness to Experience, the fifth factor is substantially correlated with general intelligence (Ackerman & Heggestad, 1997). It is however the aspects of intellect that primarily accounts for this relationship (Wilhelm, Schulze Schmiedek, & Süß, 2003). Whether culture constitutes the core aspect of Openness is still debated (see e.g. Saucier & Ostendorf, 1999; Woo et al., 2013). In the TSDI, the facets Philosophical, Scientific Interest, Creative, Reflective and Cultured are distinguished reflecting all core aspects of the fifth factor. The TSDI (Christal, 1994) is a well validated Big Five Instrument based on the research of Tupes and Christal (1961) for the US Air Force (see e.g., Davies, Stankov, & Roberts, 1998; Schulze & Roberts, 2006). Based on a large collection of about 3000 items from personality measures they derived a measure with 163 items (Christal, 1994). These items - 64 of them being personality descriptive adjectives and 99 of them being behavioral statements - were compiled based on Exploratory Factor Analysis (EFA). The TSDI nicely reflects contents and facets of the BFF personality dimensions as they are currently used. It is particularly important in personality psychology because it primed subsequent research on the BFF model substantially. We used our 2003 German adaptation of the TSDI1. In order to obtain a coherent measurement method, it is only based on the 99 behavioral statements of the original TSDI. Participants were asked to indicate their agreement with each statement on Likert-type response scales ranging from 1 (very strongly disagree) to 7 (very strongly agree). Since the German adaptation of the TSDI lacks the 64 personality descriptive adjectives, some of the TSDI facets were underidentified. Behavioral statement items with no remaining facet 1
Available upon request from the authors
Big Five Short Scale Construction affiliations were assigned to remaining facets based upon EFA and theoretical evaluation.
10
Subsequently, 14 facets from the original version were retained. The TSDI facets are listed in Table 1. 1.4 Rationale for Present Study We chose five selection methods representing both classical and new approaches in constructing short scales. The first four approaches to short-scale construction we examined included: (a) Maximizing reliability/main loadings, (b) Minimizing modification indices/cross loadings, (c) the PURIFY Algorithm in Tetrad, and (d) Ant Colony Optimization. After comparing the four aforementioned procedures, the most promising was compared to the Genetic Algorithm (GA) presented in Yarkoni (2010) that has already been used in abbreviating the Psychopathic Personality Inventory-Revised (Eisenbarth, Lilienfeld, & Yarkoni, 2014). The rationale behind every method is explained in the following. 1.4.1 Maximize Main Loadings Hitherto used procedures can be seen as variants of a procedure we label “Maximize Main Loadings” (MML). There are several implicit assumptions if this approach is applied in psychological assessment. First, selecting items with high main loadings will identify items central to the factor and therefore increase convergent validity with the long scale. Second, shortening scales by means of MML will result in a homogenous item structure with high inter-item correlations. Therefore it is assumed that despite decreasing the number of items precision of a measurement instrument might be maintained. The utility of this method is often evaluated using Cronbach’s (1951) alpha (α). It still is the most frequently used measure of internal consistency or unidimensionality. Yet, α estimates do not assess or test the underlying factor structure and are thus not indicating the test’s unidimensionality (Schmitt, 1996). Alpha-values essentially reflect the proportion of the inter-item covariances at the test variance, and therefore represent a measure of the interrelatedness of the items (Sijtsma, 2009). Additionally, α systematically underestimates reliability because it is based on the unrealistic assumption that all items are τ-equivalent (Novick, & Lewis, 1967). In this study, we use McDonald’s (1999) omega (
;see also
Big Five Short Scale Construction 11 Revelle & Zinbarg, 2009), which is a measure of factor saturation for unidimensional models. It assumes tau (i.e., τ)-congenerity and is therefore more accurate in estimating reliability. 1.4.2 Modification Indices In structural equation model (SEM) context, all parameters that are not included in the theoretical model are fixed to zero. Modification Indices (MIs), or Lagrange Multipliers, are estimates of the decrease in chi-square (i.e.
that will result from freeing those fixed
parameters. Summing up the MIs for each manifest variable will result in an estimate of improvement in
if a specific item is removed. Eliminating the item with the highest sum of
MIs will substantially decrease
and improve other descriptive goodness-of-fit statistics (for
more details, please see Jöreskog & Sörbom, 1989). 1.4.3 Purify A method for finding pure and unidimensional submodels is the PURIFY search algorithm implemented in Tetrad V (Glymour et al., 2014). In pure and unidimensional measurement models, all model-implied tetrads are zero and are therefore labelled "vanishing tetrads" (Bollen & Ting, 2000). If the tetrads do not equal zero, the implied pure model structure is impure and might need to be changed (i.e. by removal of indicators). Starting with a measurement model declared as pure, PURIFY will test all tetrads for deviations from zero. Indicators violating the assumption of vanishing tetrads are then excluded iteratively until a pure and unidimensional measurement model is identified. 1.4.4 Ant Colony Optimization Ant Colony Optimization (ACO; Marcoulides & Drezner, 2003) is a probabilistic algorithm inspired by the behavior of ants in search for food. Ants are successful in finding the shortest route from their colony to the target by the use of pheromones. Ants leave trails of pheromones that then attract other ants to their route. On shorter routes, Ants will travel faster between their goals and therefore pheromone levels will increase quicker and evaporate more slowly than on longer routes. Over time, more ants will follow the higher pheromone accumulation on shorter routes, until the shortest route is identified (Deneubourg, 1983). In our case, ACO imitates this procedure in order to find the best fitting short form. ACO
Big Five Short Scale Construction 12 simulates the equivalent of pheromone levels for all items. In the first iteration, a number of randomly generated short models are tested and compared. Subsequently, the pheromone levels of items used in the models with the best fit are increased, therefore increasing the probability of those items to be picked in later iterations. This process is repeated until a specific criterion (e.g., CFI > .90) or a given number of iterations are reached. One advantage of ACO is its flexibility to include more than one selection criterion (e.g., reliability, descriptive fit indices, and relationship to external variables). ACO has been developed to cope with a large number of potential combinations that cannot be analyzed in a reasonable amount of time with the use of optimal algorithms. ACO will not analyze all possible solutions, but instead uses a heuristic to converge to a high-quality solution over the course of several iterations. However, due to the heuristic nature of the search procedure, ACO is not guaranteed to find a single optimal solution and may result in different outcomes in separate runs (for more details, see Leite, Huang & Marcoulides, 2008). 1.4.5 Genetic Algorithm The GA presented by Yarkoni (2010) aims towards reducing item redundancy so several scales can be measured with a small number of items. In practice, the algorithm maximizes the squared correlation between the total score of the abbreviated scale and the full scale. An item loss function can be modified via the two parameters item cost and variance cost to find the best balance between a short inventory sharing less of the variance with the full scale and a longer inventory correlating stronger with the full scale. The parameter for drawing items is partly sequential, “inheriting” the best items over the course of several iterations called generations, and partly stochastic, by including random permutations, referred to as mutation and recombination (for more details, see Eisenbarth, Lilienfeld, & Yarkoni, 2014; Yarkoni, 2010). 1.4.6 Summary of Study Rationale The main goal of this study was to compare competing approaches for deriving short scales of the BFF. We used a large data set of an established BFF questionnaire (the TSDI) for these comparisons. A main decision rule was improvement in model-fit. We also compared
Big Five Short Scale Construction 13 the method’s impact on the reliability of its facets, as well as construct validity evidence (i.e., both factor saturation
and the correlation between facets were assessed). Additionally, we
examined congruence in terms of which items were eventually selected across methods. In contrast to previous classical BFF short-scale construction procedures, we decided against assessing correlation with the long scale. We did this because the model of the full scale did not hold when strict measurement criteria were applied. Replicability and generalizability of the solutions were examined by splitting the sample in two halves. Finally, the best method was used to identify a BFF short scale with adequate psychometric qualities representing all facets in a higher-order factor model and compared to the results yielded by the GA.
2. Method 2.1 Sample Over a period of 3 years a total of 14,347 participants were recruited. The questionnaire was available online as an internet script. The following exclusion criteria were administered for removing invalid cases (number of cases in parenthesis): participants with more than 10% missing values (n=135), cases with implausible intra-individual variance lower than 1 or higher than 8 (n=14), participants younger than 14 or older than 70 (n=136) because they were outside of our targeted age range, repetitions of completions – identified through identical email address and biographical information (n=183), and participants using the same response category for over 66% of the questions (n=170). The analysis of the Mahalanobis distance from the centroid in SPSS Amos, based on complex models, did not result in further removal of cases. Thus, the final sample contains 13,709 cases (8,757 females and 4,755 males). The mean age is 25 years (SD= 9.30). Missing data for individual responses were calculated using the multiple imputation algorithm (5 iterations) in SPSS. In order to conduct a split-half-analysis, the sample was randomly divided; the exploration sample contains 6858 persons, the replication sample 6851.
Big Five Short Scale Construction 2.2 Analyses
14
All item-selection procedures were applied on each of the BFF separately. The models specified 2-3 correlated primary factors (representing the facets). Item selection was conducted under the condition of maintaining the facet structure. Thus, the number of items for each facet was fixed to a minimum of three. The minimum of items for all models containing three primary factors was set to ten, due to issues with several nine item solutions (i.e., no solution could be found by PURIFY; facet structure could not be maintained when using stepwise approaches). In a second step, the best method to improve model fit was applied to the full 99-item form, with five correlated second order and 14 first order factors. 2.2.1 Maximizing Main Loadings Maximizing Main Loadings was performed in SPSS AMOS 21 with maximumlikelihood (ML) estimation. In order to maintain a high ω with a decreasing number of items, the mean item loading has to be increased over the course of iterations. To account for changes in the loading structure when removing variables, we computed the main loading for all models with one item removed, instead of simply removing the item with the lowest loading. The model with the highest mean loading was then selected as the new starting point for removing items. This procedure was then repeated until the predefined number of items was reached. 2.2.2 Modification Indices Modification Indices were computed in SPSS Amos 21 with ML estimation. All MIs were summed with a Visual Basic script in Microsoft Excel. The item yielding the highest sum of MIs was removed. MIs were then re-computed and the procedure repeated. 2.2.3 PURIFY PURIFY searches for discrepancies between model-implied and observed tetrads. There is no option of directly limiting the number of removed items. Since PURIFY is an automated search algorithm, selection cannot be conducted stepwise. Therefore, the α-level for testing vanishing tetrads was modified in order to obtain models for every number of items. Because of the relatively big sample size, a large number of tetrads did not vanish. Thus
Big Five Short Scale Construction 15 PURIFY had issues identifying models with a large number of items for most of the factors. No model could be identified for Agreeableness. 2.2.4 Ant Colony Optimization We used R (R Development Core Team, 2008) and Mplus 7 (Muthén & Muthén, 2008) to conduct ACO. R was used to adjust pheromone levels and select items for the short scales. The sampled models were estimated in Mplus. The output generated by Mplus was analyzed in R in order to update pheromone levels and hence item selection probabilities. Our adaptation of ACO is based on the R-script used and provided by Leite, Huang and Marcoulides (2008). Our goal was to find the best fitting model concerning CFI and RMSEA. In a combined criterion the aim was set to maximize the difference between CFI and RMSEA (CFI-RMSEA). This criterion was also used to increase pheromone levels for the items in the best solution. To reduce the impact of early generated models, which should be worse than latter models in ACO, pheromone levels were increased proportionally to the number of the current iterations. The probability of selecting less useful items was decreased by implementing pheromone evaporation. This was accomplished by multiplying pheromone levels for all items at the end of each iteration with 0.9. Hence, pheromone levels for the items in the best solution were updated with the following equation:
Enhancing evaporation increases the weight of new solutions compared to previous ones, but also slows down accumulation of pheromones over the course of iterations. Increasing the pheromone multiplier will greatly enhance the weight of new found models and speed up the accumulation of pheromones, which will then result in a faster convergence to a final solution. There is only small empirical knowledge about any potential optimal value for these parameters, and creating guidelines for varying contexts might be more than difficult. We varied the pheromone multiplier over several runs and retained 0.2 for our final analysis, because it yielded relatively stable results. We modified iterations and ants for every item number by applying a reversed parabola function, trying to adapt our parameters to the increase and later decrease of possible solution numbers. X is the number of items to be
Big Five Short Scale Construction 16 selected and H corresponds to half of the full item number of the factor to be analyzed, where the highest solution number is to be expected.
While varying parameters, we found a ratio of 3 to 2 (ants to iterations) guarantee the best balance of quality and convergence time. Results over different runs were relatively stable, yielding the same best result in approximately 80% to 100% of all runs. 2.2.5 Genetic Algorithm The GA was only applied to the full 99-item scale. The number of items per scale were fixed to 3 and the number of Generations was set to 1000. Based on Eisenbarth and colleagues’ (2014) recommendations, item cost parameters were varied in order to find the best solution. For values ranging from 0.1 to 0.9, 0.2 yielded both the best R² and alpha and was hence used in the analysis. 2.2.5 Procedure for the Comparison of Solutions We applied all methods with the goal of improving model fit as high as possible, while also maintaining the facet structure. The solutions were compared by goodness-of-fit (as indicated by CFI and RMSEA), factor saturation ω , facet correlations, and computing the congruence of selected items. A baseline for goodness-of-fit criteria was computed by randomly selecting 10,000 item samples per item number and calculating the 0.01, 0.5 and 0.99 quantile for the CFI and RMSEA Values of all 10,000 models. This was done in order to allow for an assessment of fit improvement over purely random selection procedures. The quantiles can be interpreted as borders of the confidence interval for the model fit parameters. The parallelism of confidence intervals and significance tests allows us to make conclusions on the significance of increase in model fit (i.e. procedures yielding better results than the .99 quantile (CFI) or lower that the .01 quantile (RMSEA) increase model fit significantly at the p < .01 level). A brute force search of the best model as a baseline was not feasible because of the sheer number of models.
Big Five Short Scale Construction 17 Computation times for all methods depend on the complexity of the CFA models. Our fully automated MML procedure required around 15 minutes to process one factor. ACO ran approximately a full workday for each factor, including each item number and several runs for comparison reasons. Note that ACO is usually applied for finding a model for a predefined item number, which could be achieved in around half an hour. MIs required around two hours of manual analyses per factor. PURIFY’s computation time ranged in the seconds, but the algorithm required experimentation with different alpha values and implementing the results into CFA, which resulted in approximately one hour of analysis. Of course, these are only rough guidelines, since computation time will increase with an increasing number of parameters to be estimated.
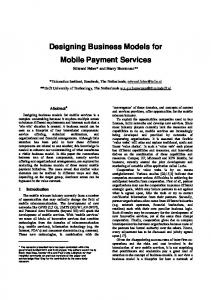
3. Results 3.1 Comparison of Short-scale Solutions by Goodness-of-Fit Indices CFI values across the reduced-item models are depicted in Figure 1. CFI values for the starting models range from .79 (Openness) to .88 (Conscientiousness) and hence are below suggested values for descriptive fit statistics (Hu & Bentler, 1999). ACO resulted in the highest CFI values in 96% of all generated models during the selection process. The most common method, MML, was worst in increasing the CFI, being below the .99 quantile of random selection in close to all cases. The change in RMSEA values for all personality factors across the reduced-item models is shown in Figure 2. It is noteworthy that for three factors MML did not decrease the RMSEA value beyond the mean RMSEA of a random selection of items. ACO, however, yielded the lowest RMSEA for 91% of all item numbers and yielded RMSEA values always below the .01 quantile. The ACO algorithm showed less of an improvement on the RMSEA estimate (best RMSEA for 91% of models) compared with the CFI (best CFI for 96% of models). This is because in order to make ACO account for both CFI and RMSEA, we programmed ACO to maximize the difference between CFI and RMSEA, thus overemphasizing CFI. Considering
Big Five Short Scale Construction 18 that CFI increased around five times as much as the RMSEA decreased during item removal, a more appropriate function may have been CFI – 5*RMSEA. Alternately, values could have been z-standardized, in order to emphasize both goodness-of-fit statistics equally. However, given that the RMSEA reached acceptable values earlier than the CFI, we think that the particular compromise of optimizing CFI and RMSEA applied here was appropriate. To assess the advantages of the stochastic approach applied in ACO over sequential methods, we modified our MML algorithm to also maximize the difference between CFI and RMSEA. This gives us the possibility of assessing the usefulness of the algorithm independent of the loss function or maximization parameter, with the only difference being the item drawing function. Not surprisingly, results for the first iteration did not differ between these procedures. However, the sequential approach reduces its selection possibilities with every step and hence will reach local optima at some point. This pattern can be seen across all factors: ACO outperforms the sequential algorithm on Extraversion after removing 6 items, on Neuroticism after removing 9 items, on Conscientiousness after removing 3 items, on Agreeableness after removing 6 items, and on Openness after removing 3 items. The results of the sequential algorithm differ only slightly from the results achieved by removing items based on MIs, which is a sequential approach for minimizing the χ² value. This is equivalent to maximizing the difference between CFI and RMSEA, since both Goodness-ofFit indices are χ² dependent. Thus, we decided against including the sequential algorithm in further analysis. 3.2 Comparison of Solutions by Facet Correlation Latent factor correlations for the facets range from .46 (Considerate – Helpful) to .86 (Nervous and Stressed Out – Depressed) in the starting models. Because these latent facet correlations considerably differ from perfect associations of 1.00, the existence of lower-order facet is empirically clearly supported. A representation of the latent factor correlations between the facets is displayed in Figure 3. The choice of method has a substantial influence on the underlying facet structure. For example, MML’s choice of homogenous items systematically decreased the latent facet correlations. This is particularly worrying since the
Big Five Short Scale Construction common variance thus decreased from .49 down to .15 for Irritable and Depressed. This
19
might negatively affect construct validity. Since ACO draws item samples for every item number separately, some criteria may change substantially between neighboring item numbers (e.g., correlation Irritable - Depressed). However, this seems to have been an exception in our analyses. Nonetheless, ACO is able to restrict these variations if so desired. 3.3 Comparison of Solutions by Factor Saturation Factor saturations of the facets at the beginning and the end of the item selection procedure are shown in Table 2. As expected, MML was the best method in maintaining high factor saturation levels. PURIFY resulted in the lowest overall values and often reached critically low internal consistency. 3.4 Comparison of Solutions by Consensus The consensus between the remaining items during the process of removal is shown in Figure 4. Even though all procedures arguably improve model fit, identical solutions between any pair of methods are rarely found. We conclude that the choice of method is not trivial, since the competing procedures will deliver short scales which will differ substantially in most cases. One notable exception from this lack of congruence was the Conscientiousness factor. This factor only includes 14 items in its full form, and therefore selection possibilities are strongly restricted. 3.5 Split-Half Analysis In order to assess chance dependence of the procedures, all methods were also applied on the replication sample. This was done twofold: First, models generated in the exploration sample were estimated on the replication sample. This procedure gives us unbiased estimates of model fit, since the model in the exploration sample may be overfitted. We then applied all methods to the replication sample to further assess the sample specificity of our methods. Goodness-of-fit statistics and congruence of the items selected across the two samples are shown in Table 3. Even in the second sample, the replicated models found by MI and ACO range in the top one percent of goodness-of-fit statistics. Stepwise selection methods are more stable over different samples and result in close to equal solutions in both samples. Despite
Big Five Short Scale Construction 20 ACO leading to strongly varying models when applied to both samples, the models generated in the exploration sample are still superior to all other methods when replicated on the second sample. Furthermore, exploration on the second sample additionally supports ACO’s superiority over the other procedures in increasing model fit. Concerns regarding the sample specificity of ACO can thus be rejected and the generalizability of ACO models over different samples was supported. 3.6 The 42-Item Big Five Short-Scale ACO was the best method to identify short-scale solution across the criteria we applied. Therefore, we applied ACO on the full 99-item BFF scale in order to find the best short-scale solution containing all factors and all facets while reaching the best possible goodness-of-fit statistics. In the previous analysis, the difference in model fit to sequential methods increased over the course of item removal. We expected a similar pattern in the analysis of the full scale. Applying the sequential algorithm maximizing CFI-RMSEA to the full scale and comparing it to the ACO solution supported these assumptions. The underlying model was a higher order model with five correlated secondary order factors (BFF) and 14 primary order factors (facets). The full scale achieved a CFI = .719 and RMSEA = .051 (replication sample: CFI = .724 and RMSEA = .051) and suffered from negative residuals. As before, maintaining the facet structure was a precondition for the selection process. Hence, all facets had to be represented by at least three items. In order to fulfill this condition, we aimed at finding the best-fitting 42-item short scale. ACO was run 30 times and the best model was selected. The resulting short scale achieved a CFI = .891 and a RMSEA = .043 on the exploration sample. To provide unbiased estimation, we applied the model to the replication sample and obtained a CFI = .887 and RMSEA = .044. These results support the generalizability of the model for different samples. Our model has slightly better Goodnessof-Fit Values than the OCEANIC (CFI = .88; RMSEA = .51), which has a comparable number of items but no higher-order model structure. The mean factor loading of items in the present data (replication sample) was .67. These relatively high loadings are partly resulting from the facets higher specificity and hence higher factor saturations relative to the broad BFF.
Big Five Short Scale Construction 21 Loadings of first-order factors (facets) on second-order factors (BFF) had a mean of .79. The Neuroticism factor had the highest loadings from its first-order factors. To our knowledge this is the first confirmatory model using a higher-order factor model to represent the BFF and prominent lower-order factors. The loading structure empirically supports their distinctive character. A simplified representation of the 42-item model is shown in Figure 5. We also applied the GA to the full 99 item scale. The resulting model yielded a CFI = .759 and a RMSEA = .063 (on the replication sample: CFI = .778 and RMSEA = .062). The mean factor loading was .64 and the mean loading of first order factors on second order factors was .81. The correlation pattern was similar to the ACO model. The main optimization criterion of the GA is the convergent validity with the full scale, and though we do not fully agree with this procedure, correlations with the full scales are reported in Table 4. The GA yielded higher correlations with the full scale for nearly all abbreviated scales. However, the difference is relatively small, with the mean correlation for the GA being .92 and .90 for the ACO solution. The values of around .90 are similar to findings from other Personality short scales (e.g., Saucier, 1994; Donnellan et al., 2006; Eisenbarth, Lilienfeld, & Yarkoni, 2014). 4. General Discussion The purpose of this article was to present and compare competing methods of item selection for creating brief personality scales. This is highly relevant for individual differences research because short scales are becoming increasingly important and long forms generally fall short of adhering to stringent measurement criteria. The competing methods we applied included both extant and new procedures for the development of brief personality assessments. We were able to demonstrate that the most common method for shortening psychological measurement instruments is the least adequate procedure. It is particularly problematic that MML performed by chance in improving goodness-of-fit. We question the capacity of MML to reach an acceptable model fit with less favorable starting conditions, which are arguably more the rule than the exception for self-report measures. Systematically reducing common variance between facets confronts the researcher with an additional
Big Five Short Scale Construction 22 theoretical problem. Obviously, the invariance of the solution and therefore the nature of the latent variables we consider is at stake here. The original broad constructs are narrowed down during the selection with MML and the validity of the remaining construct measurement is severely threatened, with factor inter-correlations changing precipitously. When evaluating models based on cut-off criteria for goodness-of-fit statistics (e.g., Hu & Bentler, 1999), some methods do not reach acceptable levels of model fit. Others differ in the number of items removed before they do so. The TSDI is a thoroughly developed BFF measurement, which was developed and evaluated in many steps using large samples. The result of this extensive investment of labor is a fairly good model fit for any of the BFF. Even with these favorable starting conditions, MML was not able to reach acceptable fit in some cases or increase model fit significantly at all. We therefore encourage researchers strongly to consider alternative procedures. Particularly since the selected items showed poor congruence across methods, the choice of procedure appears not trivial. 4.1 Comparison to the OCEANIC Scale Our findings demonstrate that with the use of ACO, BFF short scales with fully maintained facet structures and relatively good model fit can be derived. In contrast to the OCEANIC scale (Schulze & Roberts, 2006), the selection procedures applied here retain a first-order level below the big-five factors. Covering facets in addition to the broad BFF allows for a better representation of the underlying structure of personality. When using the BFF as a predictor of external variables, facets that are theoretically related to these variables provide a higher predictive validity than the corresponding BFF (MacCann, Duckworth, & Roberts, 2009). In the development of the OCEANIC, two thirds of the TSDI items were discarded using main loadings based on EFA. Whereas the difference in model fit between MML and ACO was large in our study, particularly for the absolute fit (i.e., RMSEA), it is relatively small between our final personality short-scale and the OCEANIC. Both BFF short scales have great advantages. Whereas considerable effort was put into rewording the original TSDI items and restructuring the response scales for the OCEANIC, our personality short scale
Big Five Short Scale Construction 23 benefits from using current methodologies, which allowed us to maintain a first-order level below the BFF. 4.2 Further Applications of ACO and GA In this study, ACO has set the benchmark for item selection procedures, exceeding the other procedures in finding the best model fit in close to 100% of all cases. We have applied ACO to a self-report personality instrument in order to find the best fitting short-scale under the constraint that the model structure is retained. ACO is a function that links psychometric criteria to sampling probabilities. ACO does not limit researchers in their choice of psychometric criteria to be optimized and is of course also suitable to other psychological domains (i.e., maximal effort data or life-data, since the code can be easily modified). The results unequivocally show the utility of ACO in optimizing model-fit for a longer self-report scale. Alternatively, we could have applied ACO in order to select items that simultaneously maximize the internal consistency and predictive validity of a measurement of maximal behavior, while also maintaining adequate model fit. As ACO can be adapted for a broad variety of model structures, arranging the primary and secondary order factors orthogonally, in a nested instead of higher-order model, we could have improved model fit further. In future studies, we intend to apply ACO in a variety of settings to evaluate its utility in broadly varying assessment contexts. The GA applies similar rules as ACO and can also be easily modified to maximize any given criterion. We cannot yet derive conclusions about the difference in the drawing function of GA relative ACO, and currently assume that under otherwise similar conditions both functions are equally purposeful in finding the best short scale. As expected, GA achieved a higher total score correlation between the abbreviated and full scale than ACO. However, in this version, the GA implicitly presupposes that the total score of the long scale is a valid representation of the underlying construct – and this assumption does not hold for broad selfreport dimensions. Across different studies on personality inventories, including the present investigation, these assumptions could not withstand strict psychometric testing with CFA methodology. Similar to MML, the RMSEA value increased compared to the full scale,
Big Five Short Scale Construction 24 showing that misfit per parameter has actually increased during the selection process. The difference in correlation with the full scale between the ACO and GA models are relatively small, whereas difference in model fit can be seen as nontrivial. Taken together, we encourage researchers that use one form or another of non-sequential drawing functions consider implementing model fit as a maximization criterion, particularly if there is doubt about model conformity with the full scale. 4.3 Implications for Construct Validity Evidence While we agree that the short scale should essentially capture what the full scale did, in the present case one motivation was to derive abbreviated scales that do adhere to strict measurement standards – based on item collections that do not. Another way to illustrate our point is to consider the part-whole dependence in the correlation between full and abbreviated scale. In the traditional part-whole correction this dependence is removed by computing the correlation between retained and removed items. However, items were removed if they were psychometrically insufficient. On the one hand, the relation between retained and removed items is not instrumental for questions concerning convergent validity. On the other hand, we acknowledge that we share the implicit assumption that the initial item sample was drawn from a big five measure and we assume that the abbreviated set also constitutes a BFF measure. We think this assumption is justified because we tried to maintain the first order structure during item removal. 4.4 Comparison to Big Data Analytics On a more general level ACO and GA bridge the gap to even more complex problems with larger solution spaces commonly encountered in Big Data analysis. The large number of predictors is not suitable for classical approaches and force researchers to apply mechanical learning techniques (e.g., random forests, tabu search, other genetic algorithms) to find the optimal predictors for a specific outcome. This is somewhat similar to the issue tackled here. Whereas our first three methods may not be applicable to highly complex Big Data evaluations, ACO and GA can both be applied. It is because of their previous use in shortscale construction of self-report assessments that we chose them over other methods to be
Big Five Short Scale Construction applied here. Other Big Data procedures might also be efficient to tackle the problems
25
discussed here – or even allow addressing similarly pervasive psychometric problems such as exploration of the model structure (for relevant approaches see Bishop, 2006; James, Witten, Hastie, & Tibshirani, 2013). However, while Big Data does not necessarily ask for an interpretable model but just seeks the highest predictive power independent of theoretical considerations, this is not the case here. Our methods have been applied to a theoretically founded model and aim at maintaining the underlying structure – therefore only a fraction of Big Data procedures can reasonable be applied in the present case. We will address two concerns typically arising in Big Data analytics that also affect the analysis described in this article, in particular ACO and GA. The first one is finding a reasonable compromise between model complexity and fit (Myung, 2006). The second concern is that the items retained in the selection process might reflect capitalization on chance. In other words, the results might be highly sample specific (or overfitted) and hence generalization beyond the current sample might not be justified. Unlike the typical situation in Big Data analysis, the first concern is not much of an issue in the present study, because the procedures recommended here do not sacrifice parsimony for model fit. Based on prior evidence, the methods applied here postulate a priori expectations concerning personality factors and seek to eliminate items from an initial pool (where little is usually known about the sampling process for the initial pool). This situation is the usual starting point for all broad personality inventories: Insufficient fit. The reduction in degrees of freedom might thus also be seen as weeding out inadequate indicators – thereby refining the process of sampling on an empirical level. However, this is only the case when the methods applied are successful at removing the worst fitting items, as RMSEA values for MML indicate that this procedure is not always able to improve model fit relatively to the loss in degrees of freedom (whereas the random selection shows that CFI values generally increase when removing items). We hence recommend comparing RMSEA values of the derived short-scales to the full scale. Researchers applying ACO for different purposes, e. g. finding the number of estimated parameters that fit the model best, should feel encouraged to include fit indices that are more
Big Five Short Scale Construction 26 sensible to model complexity, for instance penalty functions (for more information see James et al., 2013). The second concern – chance capitalization - was addressed by studying out-of-sample generalizability and also robustness of the solution we propose in a reasonably large sample. The results remained very stable in an independent sample of equal size and showed a significant improvement over chance even in the second sample. Obviously, this conclusion might be at stakes if the data are less dependable and/or numerous. In those cases, Bootstrapping might be a powerful tool to reduce the variance of these statistical learning methods, further enhancing out-of-sample generalizability (for more information see James et al., 2013). 5. Conclusion When constructing short scales, researchers implicitly or explicitly draw two decisions: How to select items samples and what selection criteria to use. More often than not, the wrong decisions were made. The classical approach of selecting items stepwise based on their main loadings has proven to be purposeful in increasing reliability, but highly problematic concerning several aspects of construct validity. Also note that stepwise selection will result in a strong influence of the selection sequence. ACO gives researchers both the possibility to directly draw item samples for a predefined number of items and to rely on more than one psychometric criterion. For example, these could be model fit and factor saturation, in order to address both validity and reliability of the scale. If the scale is used for prediction purposes, one can also focus on increasing the relation with external variables. We demonstrated ACO’s purposefulness in optimizing model fit for a self-report personality instrument. In sum, ACO is a very flexible algorithm that can be easily modified, hence researchers should feel encouraged to find their own preferred settings and use ACO in varying contexts. It is up to future studies, which we are in the midst of conducting, to decide its utility under different conditions.
27
Big Five Short Scale Construction Acknowledgments
We would like to thank Richard D. Roberts and Sally Olderbak for their contribution to this article. The authors declared no potential conflicts of interest with respect to the research, authorship, and/or publication of this article. The authors received no financial support for the research, authorship, and/or publication of this article.
28
Big Five Short Scale Construction References
Ackerman, P. L., & Heggestad, E. D. (1997). Intelligence, personality, and interests: Evidence for overlapping traits. Psychological Bulletin, 121, 219-245. Bishop, C. M. (2006). Pattern recognition and machine learning. New York: Springer. Bollen, K. A., & Ting, K. F. (2000). A tetrad test for causal indicators. Psychological Methods, 5(1), 3. Borkenau, P., & Ostendorf, F. (1990). Comparing exploratory and confirmatory factor analysis: A study on the 5-factor model of personality. Personality and Individual Differences, 11(5), 515-524. Christal, R. E. (1994). The Air Force Self-Description Inventory. Final R&D status report. Armstrong Laboratory, Brooks AFB, Texas. Church, A. T., & Burke, P. J. (1994). Exploratory and confirmatory tests of the big five and Tellegen's three-and four-dimensional models. Journal of Personality and Social Psychology, 66(1), 93. Costa, P. T. Jr., & McCrae, R. R. (1985). The NEO Personality Inventory manual. Odessa, FL: Psychological Assessment Resources. Costa, P. T., & McCrae, R. R. (1988). Personality in adulthood: a six-year longitudinal study of self-reports and spouse ratings on the NEO Personality Inventory. Journal of Personality and Social Psychology, 54(5), 853. Costa, P. T. Jr., & McCrae, R. R. (1989). The NEO-PI/NEO-FFI manual supplement. Odessa, FL: Psychological Assessment Resources. Costa Jr, P. T., McCrae, R. R., & Dye, D. A. (1991). Facet scales for agreeableness and conscientiousness: a revision of the NEO personality inventory. Personality and Individual Differences, 12(9), 887-898. Costa, P. T., Jr., & McCrae, R. R. (1992). Revised NEO personality inventory (NEO-PI-R) and NEO five-factor inventory (NEO-FFI) professional manual. Odessa, FL: Psychological Assessment Resources.
Big Five Short Scale Construction 29 Costa Jr, P. T., & McCrae, R. R. (1995). Domains and facets: Hierarchical personality assessment using the Revised NEO Personality Inventory. Journal of Personality Assessment, 64(1), 21-50. Credé, M., Harms, P., Niehorster, S., & Gaye-Valentine, A. (2012). An evaluation of the consequences of using short measures of the Big Five personality traits. Journal of Personality and Social Psychology, 102(4), 874. Cronbach, L. J. (1951). Coefficient alpha and the internal structure of tests. Psychometrika, 16(3), 297-334. Deneubourg, J. L., Pasteels, J. M., & Verhaeghe, J. C. (1983). Probabilistic behaviour in ants: A strategy of errors? Journal of Theoretical Biology, 105(2), 259–271. De Raad, B. (2000). The Big Five Personality Factors: The psycholexical approach to personality. Hogrefe & Huber Publishers. DeYoung, C. G., Quilty, L. C., & Peterson, J. B. (2007). Between facets and domains: 10 aspects of the Big Five. Journal of Personality and Social Psychology, 93(5), 880. Digman, J. M., & Takemoto-Chock, N. K. (1981). Factors in the natural language of personality: Re-analysis, comparison, and interpretation of six major studies. Multivariate Behavioral Research, 16(2), 149-170. Donnellan, M. B., Oswald, F. L., Baird, B. M., & Lucas, R. E. (2006). The mini-IPIP scales: Tiny-yet-effective measures of the Big Five factors of personality. Psychological Assessment, 18(2), 192. Eisenbarth, H., Lilienfeld, S. O., & Yarkoni, T. (2015). Using a genetic algorithm to abbreviate the Psychopathic Personality Inventory–Revised (PPI-R). Psychological Assessment, 27(1), 194.Eysenck, H. J. (1991). Dimensions of personality: 16, 5 or 3?— Criteria for a taxonomic paradigm. Personality and Individual Differences, 12(8), 773-790. Eysenck, H. J. (1992). Four ways five factors are not basic. Personality and Individual Differences, 13(6), 667-673. Glymour, C., Scheines, R., Spirtes, P., & Ramsey, J. (2014). The TETRAD project: Causal models and statistical data. www.phil.cmu.edu/projects/tetrad/current
Big Five Short Scale Construction Goldberg, L. R. (1990). An alternative" description of personality": the big-five factor
30
structure. Journal of Personality and Social Psychology, 59(6), 1216. Goldberg, L. R. (1992). The development of markers for the Big-Five factor structure. Psychological Assessment, 4(1), 26. Gosling, S. D., Rentfrow, P. J., & Swann Jr, W. B. (2003). A very brief measure of the BigFive personality domains. Journal of research in Personality, 37(6), 504-528. Graziano, W. G., Habashi, M. M., Sheese, B. E., & Tobin, R. M. (2007). Agreeableness, empathy, and helping: A person× situation perspective. Journal of Personality and Social Psychology, 93(4), 583. Hu, L. T., & Bentler, P. M. (1999). Cutoff criteria for fit indexes in covariance structure analysis: Conventional criteria versus new alternatives. Structural Equation Modeling: A Multidisciplinary Journal,6(1), 1-55. James, G., Witten, D., Hastie, T., & Tibshirani, R. (2013). An introduction to statistical learning. New York: Springer. John, O. P. (1990). The “Big Five” factor taxonomy: Dimensions of personality in the natural language and in questionnaires. In L. A. Pervin (Ed.), Handbook of Personality: Theory and Research (S. 66–100). New York: Guilford Press. John, O. P., Donahue, E. M., & Kentle, R. L. (1991). The big five inventory—versions 4a and 54. Berkeley: University of California, Berkeley, Institute of Personality and Social Research. John, O. P., & Srivastava, S. (1999). The Big Five trait taxonomy: History, measurement, and theoretical perspectives. Handbook of Personality: Theory and Research, 2(1999), 102-138. Kano, Y., & Harada, A. (2000). Stepwise variable selection in factor analysis. Psychometrika, 65(1), 7-22. Kruyen, P. M., Emons, W. H., & Sijtsma, K. (2012). Test length and decision quality in personnel selection: When is short too short? International Journal of Testing, 12(4), 321344.
Big Five Short Scale Construction 31 Kruyen, P. M., Emons, W. H., & Sijtsma, K. (2013a). Assessing individual change using short tests and questionnaires. Applied Psychological Measurement, 20(10), 1-16. Kruyen, P. M., Emons, W. H., & Sijtsma, K. (2013b). On the shortcomings of shortened tests: A literature review. International Journal of Testing, 13(3), 223-248. Jöreskog, K. G., & Sörbom, D. (1989). LISREL 7: A guide to the program and applications (Vol. 2). Chicago: Spss. Lee, K., & Ashton, M. C. (2004). Psychometric properties of the HEXACO Personality Inventory. Multivariate Behavioral Research, 39(2), 329-358. Leite, W. L., Huang, I. C., & Marcoulides, G. A. (2008). Item selection for the development of short forms of scales using an ant colony optimization algorithm. Multivariate Behavioral Research, 43(3), 411-431. MacCann, C., Duckworth, A. L., & Roberts, R. D. (2009). Empirical identification of the major facets of conscientiousness. Learning and Individual Differences, 19(4), 451-458. Marcoulides, G. A., & Drezner, Z. (2003). Model specification searches using ant colony optimization algorithms. Structural Equation Modeling, 10(1), 154-164. McCrae, R. R., & Terracciano, A. (2005). Universal features of personality traits from the observer's perspective: data from 50 cultures. Journal of Personality and Social Psychology, 88(3), 547. McCrae, R. R., Zonderman, A. B., Costa Jr, P. T., Bond, M. H., & Paunonen, S. V. (1996). Evaluating replicability of factors in the Revised NEO Personality Inventory: Confirmatory factor analysis versus Procrustes rotation. Journal of Personality and Social Psychology, 70(3), 552. McDonald, R. P. (1999). Test Theory: A Unified Treatment. Mahwah, NJ: Erlbaum. Muthén, L. K., & Muthén, B. O. (2008). Mplus (Version 5.1). Los Angeles, CA: Muthén & Muthén. Myung, I. J. (2000). The importance of complexity in model selection. Journal of Mathematical Psychology, 44(1), 190-204.
Big Five Short Scale Construction 32 Norman, W. T. (1963). Toward an adequate taxonomy of personality attributes: Replicated factor structure in peer nomination personality ratings. The Journal of Abnormal and Social Psychology, 66(6), 574. Novick, M. R., & Lewis, C. (1967). Coefficient alpha and the reliability of composite measurements. Psychometrika, 32(1), 1-13. Poropat, A. E. (2009). A meta-analysis of the five-factor model of personality and academic performance. Psychological Bulletin, 135, 322-338. R Development Core Team (2008). R: A language and environment for statistical computing. R Foundation for Statistical Computing, Vienna, Austria. ISBN 3-900051-07-0, URL http://www.R-project.org. Ramstedt, B., & John, O. P. (2007). Measuring personality in one minute or less: A 10-item short version of the Big Five Inventory in English and German. Journal of Research in Personality, 41(1), 203-212. Revelle, W., & Zinbarg, R. E. (2009). Coefficients alpha, beta, omega, and the glb: Comments on Sijtsma. Psychometrika, 74(1), 145-154. Saucier, G. (1994). Mini-markers: A brief version of Goldberg's unipolar Big-Five markers. Journal of Personality Assessment, 63(3), 506-516. Saucier, G. & Ostendorf, F. (1999). Hierarchical subcomponents of the Big Five personality factors: A cross-language replication. Journal of Personality and Social Psychology, 76, 613–627. Schmitt, N. (1996). Uses and abuses of coefficient alpha. Psychological Assessment, 8(4), 350. Schmitt, D., Allik, J., McCrae, R. R., & Benet-Martinez, V. (2007). The geographic distribution of Big Five personality traits: Patterns and profiles of human self–description across 56 nations. Journal of Cross-Cultural Psychology, 38, 173–212. Schmi, K. (2009). On the use, the misuse, and the very limited usefulness of Cronbach’s alpha. Psychometrika, 74(1), 107-120.
Big Five Short Scale Construction 33 Soto, C. J., & John, O. P. (2009). Ten facet scales for the Big Five Inventory: Convergence with NEO PI-R facets, self-peer agreement, and discriminant validity. Journal of Research in Personality, 43(1), 84-90. Tupes, E.C., & Christal, R.C. (1961). Recurrent Personality Factors Based on Trait Ratings (USAF ASD Technical Report, 61-97). U.S. Air Force, Lackland Air Force Base, Texas. Vassend, O., & Skrondal, A. (1997). Validation of the NEO Personality Inventory and the five‐factor model. Can findings from exploratory and confirmatory factor analysis be reconciled? European Journal of Personality, 11(2), 147-166. Wiggins, J. S. (1968). Personality structure. Annual review of psychology, 19(1), 293-350. Wilhelm, O., Schulze, R., Schmiedek, F., & Süß, H. M. (2003). Interindividuelle Unterschiede im typischen intellektuellen Engagement. Diagnostica, 49(2), 49-60. Woo, S.E., Chernyshenko, O.S., Longley, A., Zhang, Z-Z., Chiu, C-Y., & Stark, S.E. (2013). Openness to experience: Its lower-level structure, measurement, and cross-cultural equivalence. Journal of Personality Assessment. Yarkoni, T. (2010). The abbreviation of personality, or how to measure 200 personality scales with 200 items. Journal of Research in Personality, 44(2), 180-198.
Big Five Short Scale Construction
34
Table 1 Facets of the TSDI Facet E-Shy and Bashful E-Talkative* E-Socially Active E-Assertive E-Unsociable* N-Nervous and Stressed Out N-Worrying (Depressed) N-Irritable N-Envious and Jealous* C-Efficient and Dependable* C-Hard Working C-Organized A-Warm and Sympathetic A-Friendly A-Considerate A-Cold and Insensitive* A-Helpful
Example “I am a very shy person.” “Talkative” “I like parties, where there are a lot of people.” “I have a lot of influence over others.” “Withdrawn” “I get rattled when I am under time pressure.” “I am often sad and depressed.” “Sometimes I get so upset, I get sick at my stomach.” “Envious” “Steady” “When I get an assignment, I always do my best.” “I like to keep all my belongings neat and organized.” “Affectionate” “I am considered by others to be a very friendly person.” “I try to be kind to everyone I know.” “Unkind” “I get a lot of pleasure in helping others with their problems.” O-Philosophical (Intellectual) “I have a lot of intellectual curiosity.” O-Scientific Interest “I would enjoy being a theoretical scientist.” O-Creative* “Innovative” O-Reflective “I spend a lot of time in meditation and deep thought.” O-Cultured* “I enjoy visiting art museums.” Note: *Facets that are not represented in the German Adaptation; Names of relabeled facets in the German Adaptation are written in parentheses. The first letter indicates the corresponding Big Five Factor: E = Extraversion, N = Neuroticism, C = Conscientiousness, A = Agreeableness, O = Openness
35
Big Five Short Scale Construction Table 2 Factor saturation
for the full and abbreviated scales
Full
MML
MI
PURIFY
ACO
E-Social
.866 (8)
.8 (3)
.739 (3)
.738 (4)
.738 (4)
E-Shy
.835 (6)
.818 (4)
.818 (4)
.719 (3)
.719 (3)
E-Assertive
.611 (4)
.636 (3)
.637 (3)
.64 (3)
.64 (3)
N-Depressed
.889 (11)
.837 (4)
.646 (3)
.624 (3)
.822 (4)
N-Nervous
.832 (9)
.82 (3)
.723 (4)
.811 (5)
.753 (3)
N-Irritable
.807 (8)
.745 (3)
.623 (3)
.548 (3)
.744 (3)
C-Hard Working
.841 (8)
.627 (3)
.752 (3)
.752 (3)
.752 (3)
C-Organized
.765 (6)
.779 (3)
.634 (3)
.634 (3)
.634 (3)
A-Considerate
.867 (7)
.774 (3)
.785 (3)
-
.848 (4)
A-Helpful
.842 (7)
.876 (4)
.847 (4)
-
.787 (3)
A-Friendly
.748 (5)
.728 (3)
.728 (3)
-
.727 (3)
O-Intellectual
.749 (8)
.623 (3)
.602 (3)
.56 (4)
.589 (3)
O-Scientific
.769 (7)
.726 (4)
.734 (4)
.523 (3)
.722 (4)
O-Reflective
.716 (5)
.691 (3)
.437 (3)
.691 (3)
.691 (3)
Note: The first letter indicates the corresponding Big Five Factor: E = Extraversion, N = Neuroticism, C = Conscientiousness, A = Agreeableness, O = Openness; Item numbers are written in parenthesis
36
Big Five Short Scale Construction Table 3 Replication and Exploration in both samples
Extraversion
Conscient.
Neuroticism
Openess
Sample 1
Sample 2
Sample 2
Exploration
Replication
Exploration
CFI
RMSEA
CFI
RMSEA Consensus
CFI
RMSEA
.99 quan.
.965
.055
.961
.058
.961
.058
MML
.957
.068
.959
.068
100%
.959
.068
MI
.972
.051
.972
.053
100%
.972
.053
PURIFY
.974
.047
.967
.054
90%
.968
.053
ACO
.974
.047
.967
.054
60%
.970
.048
.99 quan.
.995
.025
.995
.025
.995
.025
MML
.933
.111
.921
.109
100%
.921
.109
MI
.998
.020
.997
.023
100%
.997
.023
PURIFY
.998
.020
.997
.023
71%
.993
.028
ACO
.998
.020
.997
.023
67%
.997
.018
.99 quan.
.970
.047
.972
.045
.972
.045
MML
.962
.067
.967
.063
90%
.962
.066
MI
.983
.036
.981
.038
70%
.984
.031
PURIFY
.975
.038
.978
.036
64%
.993
.022
ACO
.996
.017
.993
.023
70%
.996
.017
.99 quan.
.940
.058
.944
.057
.944
.057
MML
.950
.056
.950
.057
90%
.953
.060
MI
.956
.047
.952
.050
70%
.957
.049
PURIFY
.917
.065
.921
.061
82%
.920
.062
ACO
.963
.045
.963
.045
90%
.966
.044
37
Big Five Short Scale Construction Agreeableness
.99 quan.
.968
.058
.967
.058
.967
.058
MML
.927
.092
.937
.087
100%
.937
.087
MI
.981
.043
.977
.049
70%
.985
.041
ACO
.984
.041
.983
.044
80%
.985
.041
Note: MML = Maximizing Main Loadings; MI = Modification Indices; ACO = Ant Colony Optimization. Models generated in the first sample (Exploration) were tested on the second sample (Replication). Results were compared to independently generated models in the second sample (Exploration). PURIFY was not able to generate models for Agreeableness. The row labeled “.99 quan.” represents the .99 quantile of CFI and .01 quantile of RMSEA values
in
10,000
randomly
drawn
item
samples
38
Big Five Short Scale Construction Table 4 Total score correlations between abbreviated and full scale Extraversion So
SB
As
Neuroticism De
NS
Ir
Conscient.
Agreeableness
Ha
Co
O
He
Openness
Fr
In
Sc
Re
GA
.94
.94
.96
.91
.91
.88
.90
.92
.94
.92
.94
.87
.91
.92
ACO
.90
.94
.92
.91
.91
.85
.88
.92
.92
.91
.93
.85
.88
.89
Note: Reported are part-whole dependent total score correlations. GA = Genetic Algorithm; ACO = Ant Colony Optimization; Letters represent the corresponding Big Five Factor facet: So = Socially Active; SB = Shy and Bashful; As = Assertive; De = Depressed; NS = Nervous and Stressed Out; Ir = Irritable; Ha = Hard Working; O = Organized; Co = Considerate; He = Helpful; Fr = Friendly; In = Intellectual; Sc = Scientific Interest; Re = Reflective
Figure 1. CFI for all Big Five factors during item selection MML = Maximizing Main Loadings; MI = Modification Indices; ACO = Ant Colony Optimization; Random represents the .01, .5 and .99 quantile of CFI in 10,000 randomly drawn item samples
Figure 2. RMSEA for all Big Five factors during item selection MML = Maximizing Main Loadings; MI = Modification Indices; ACO = Ant Colony Optimization; Random represents the .01, .5 and .99 quantile of CFI in 10,000 randomly drawn item samples
Figure 3. Latent factor correlation during item selection MML = Maximizing Main Loadings; MI = Modification Indices; ACO = Ant Colony Optimization
Figure 4. Consensus between item samples during selection MML = Maximizing Main Loadings; MI = Modification Indices; ACO = Ant Colony Optimization
Figure 5. Model structure of the 42-item personality short scale So = Socially Active; SB = Shy and Bashful; As = Assertive; De = Depressed; NS = Nervous and Stressed Out; Ir = Irritable; Ha = Hard Working; O = Organized; Co = Considerate; He = Helpful; Fr = Friendly; In = Intellectual; Sc = Scientific Interest; Re = Reflective
Big Five Short Scale Construction
39
Highlights We compared classical and current item selection procedures on a personality measure. Item selection can be used to improve testing time and psychometric properties. Classical item selection procedures were insufficient in improving model fit. Ant Colony Optimization can be used to derive psychometrically adequate short scales.