Testing for multivariate normality via univariate tests: A case study using lead isotope ratio data. M. J. BAXTER1 & N. H. GALE2 , 1Department of Mathematics, ...
Jour nal of Applied Statistics, Vol. 25, No. 5, 1998, 671± 683
Testing for multivariate normality via univariate tests: A case study using lead isotope ratio data
M. J. BAXTER 1 & N. H. GALE 2 , 1Department of Mathematics, Statistics and Operational Research, The Nottingham Trent University, UK and 2Isotrace Laborator y, Oxford, UK
Samples from ore bodies, mined for copper in antiquity, can be characterized by measurements on three lead isotope ratios. Given suý cient samples, it is possible to estimate the lead isotope ® eldÐ a three-dimensional constr uctÐ that characterizes the ore body. For the purposes of estimating the extent of a ® eld, or assessing whether bronze artefacts could have been made using copper from a particular ® eld, it is often assumed that ® elds have a trivariate nor mal distribution. Using recently published data, for which the sample sizes are larger than usual, this paper casts doubt on this assumption. A variety of tests of univariate nor mality are applied, both to the original lead isotope ratios and to transfor mations of them based on principal component analysis; the paper can be read as a case study in the use of tests of univariate normality for assessing multivariate normality. This is not an optimal approach, but is suý cient in the cases considered to suggest that ® elds are, in fact, `non-nor mal’ . A direct test of multivariate normality con® rms this. Some implications for the use of lead isotope ratio data in archaeology are discussed. SUMMARY
1 Introduction This paper presents a case study of methods for testing for normality in univariate, bivariate and trivariate cases. The main focus is on tests of univariate normality, and tests of this sort adapted to the study of multivariate normality. The study was motivated by a problem that arises in the statistical analysis of lead isotope data Correspondence: M . J. Baxter, Department of M athem atics, Statistics and Operational Research, The Nottingham Trent U niversity, Nottingham NG11 8N S, U K. Tel: 0115 9418418 ext. 3161 ; Fax: 0115 9486690 ; E-mail: mjb@ m aths.ntu.ac.uk. 0266-476 3/98/050671-1 3 $7.00
199 8 Carfax Publishing Ltd
672
M. J. B axter & N. H. Gale
and the archaeological application of this analysis. The background to this problem is discussed in Section 2. The statistical problem is one of testing for trivariate normality. If the data are not drawn from a trivariate normal distribution, then this will often be evident in one or two dimensions, so that tests of univariate and bivariate normality are also sensible. Tests of univariate normality are discussed in Section 3, and tests of multivariate normality are discussed in Section 4. Two data sets are examined in Section 5. In both cases, there is no evidence that the univariate marginals are `non-normal’ ; however, once a suitable univariate direction for viewing the data is selected, there is strong evidence of non-normality. This implies that the population data cannot be trivariate normal. The results from this approach will be contrasted with those obtained from direct testing of bivariate and trivariate normality. This evidence of non-normality is at variance with assertions in the literature that lead isotope data are normal, and raises possible doubts about the use in lead isotope studies of statistical procedures that assume normality. The implications are discussed brie¯ y in the concluding Section 6. 2 Lead isotope analysis The use of lead isotope analysis in archaeology is discussed in Gale (1989), Gale and Stos-Gale (1989), Sayre et al. (1992), and Stos-Gale and Gale (1994). In this paper, the data sets examined are for galena (PbS) ores, from which lead and silver artefacts could have been made in antiquity. Much current interest in lead isotope studies concentrates on copper ores and the artefacts derived from them. The primary ores of copper always contain some lead (Pb) and, in this case, it is the comparison of the isotopic compositions of the traces of lead in the copper ores with those of copper or bronze artefacts that is of interest. The statistical questions are identical to those involved in studying lead isotope analyses of lead± silver ores. This interest arises because of the possibility that this analysis oþ ers for the successful provenancing of metal artefacts. Ore bodies may be characterized by the proportions of four lead isotopes: 2 04Pb, 2 06Pb, 2 07Pb, 2 08 Pb. These are constrained to sum to 100%, so that the measurements for a single sample de® ne a point in a three-dimensional space. It is conventional in archaeology to use the three ratios 208 Pb / 206 Pb, 207 Pb / 20 6Pb and 2 06 Pb / 204Pb. For a single ore body, measurements on n samples may be used to estimate the `lead isotope ® eld’ for that body, which is a three-dimensional construct. If artefacts found in the archaeological record were made using ore from a single source, and if candidate sources have a well-characterized ® eld, then there is the hope that the provenance of an artefact can be determined with reasonable con® dence from its lead isotope signature. The possibility of doing this requires that candidate sources have reasonably distinct ® elds; where they do not, it is still possible to rule out some ore bodies as potential sources. Successful provenancing allows wider issues, such as the nature of trade relationships, to be addressed. Controversies about the analysis and interpretation of lead isotope ratios encompass a number of statistical issues. A recent summary of some of these issues is provided by Budd et al. (1995) and the discussion following, together with Scaife et al. (1996) and Stos-Gale et al. (1997). Some analysts assume that lead isotope ® elds have a trivariate normal distribu-
Univariate tests for multivariate normality
673
tion, and it is this assumption that is investigated here. Normality is used, for example, to justify the construction of con® dence ellipsoids based on bivariate pairs of ratios to indicate the extent of a ® eld. Another use is in probability calculations, based on the Mahalanobis distance, to assess whether or not an artefact might be made from an ore from a particular ® eld. The issue of normality, if addressed explicitly at all, is usually dealt with in passing and is often simply assumed. W here the question has been addressed, it has usually been with univariate graphs, such as histograms and probability plots often based on small numbers of data, and on analysis of the univariate ratios. The analyses to be reported in Section 5 suggest that con® dence in the normality of lead isotope data may be misplaced. Possible reasons for the disparity are suggested in Section 6.
3 Statistical methodology: Univariate tests This paper examines a number of methods for testing normality, and illustrates their use on data for two lead isotope ® elds for which n is comparatively large relative to the sample sizes usually available. A sensible ® rst step is to examine the individual ratios for univariate normality. Apart from graphical approaches, a large number of formal tests are available, seven of which have been used here. The tests used are as follows: (1) (2) (3) (4) (5) (6) (7)
the Shapiro± Wilk statistic W; the modi® ed Anderson± Darling statistic A*; D’ Agostino’ s statistic D; the D’ Agostino± Pearson chi-squared statistic K 2 ; the sample skewness b 11 /2 ; the sample kurtosis b 2 ; the QH * statistic proposed by Chen and Shapiro (1995).
The choice of the ® rst six statistics was based on recommendations in D’ Agostino (1986), who provides tables of critical values. The W statistic is perhaps the most widely recommended in the literature, with comparatively high power relative to a wide range of alternatives, and was calculated here using an approximation of Royston (1992). The D statistic is a more readily computed approximation to W, while QH * is a recently introduced statistic based on similar ideas to W that is also readily computed and is claimed to have similar power. D’ Agostino et al. (1990) strongly recommend the use of K 2 , b 11 /2 and b 2 . These last two statistics test for speci® c kinds of departure from normality, whereas the other tests are omnibus tests. The statistics may also be applied to linear functions of the data, and this is investigated in Section 5.
4 Statistical methodology: Multivariate tests Methods for assessing multivariate normality are reviewed by Cox and Small (1978); D’ Agostino (1986, pp. 409 ± 413); Gnanadesikan (1977, pp. 161 ± 195); Koziol (1986); Looney (1995); Mardia (1980); Romeu and Ozturk (1993); and Seber (1984, pp. 148 ± 155).
674
M. J. B axter & N. H. Gale
Let X be an n 3 p data matrix with the i th row x i . Denote the mean x i by xÅ and the estimated covariance matrix by S. For two rows x i and xj , de® ne d 2i j 5
(x i 2
xÅ )Â S 2
1
(xj 2
xÅ )
Measures of multivariate skewness and kurtosis can be de® ned as
b 1, p 5
b 2, p 5
n
R
d 6i j
i, j 5
1
n2 n
R
d 4ii
i5
1
n
and tested for signi® cant departures from normality (Mardia, 1970, 1974, 1975). Asymptotically, we have that T3 5
nb 1, p /6
is chi-squared distributed under the hypothesis of multivariate normality, with p( p + 1)( p + 2) /6 degrees of freedom. The statistic T4 5
n[b* 2, p 2
6b 2, p + 3p( p + 2)] /24
where
b* 2, p 5
R
n
d 8i j
i, j 5
1
n2
also has an asymptotic chi-squared distribution under the hypothesis of normality. Since T 3 and T 4 are independent under normality, their sum T 5 T 3 + T 4 can be used as an omnibus test of normality; this is the statistic derived by Mardia and Kent (1991). For p 5 2 and p 5 3, i.e. the cases of interest here, T 3 has four and 10 degrees of freedom, respectively, while T 4 has ® ve and 15 degrees of freedom. The test just mentioned is invariant with respect to the coordinate system used for the data. Another general approach to testing for multivariate normality involves the combination of marginal tests for normality. Such an approach is coordinate dependent, but can be applied after initial transformation of the axes. Several approaches of this sort are based on the Shapiro± W ilk statistic for univariate marginals. Royston (1983), for example, de® nes zi 5
f (W i )
for i 5 1, . . . , p, where the z i terms are normalized versions of the Shapiro± W ilk statistic, W i , with f (.) based on transformations given by Royston (1982). The proposed test statistic has the form H5
( )R e p
p
ki 1
Univariate tests for multivariate normality where ki 5
675
{ [ ]} U
2
1
U (2
zi )
2
2
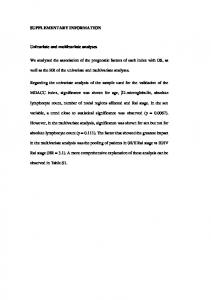
Here, U 2 1 (.) is the inverse of the standard normal distribution, and k i is approximately distributed as v 2e , where the eþ ective degrees of freedom e has to be estimated using procedures given by Royston (1983). If the marginals are uncorrelated, as would be the case after transformation to principal components, then e 5 p. In this paper, the skewness and kurtosis statistics were used, as were T 4 and T 5 T 3 + T 4 . Royston’s H was applied to the original variables and to their principal component scores. All tests were applied to all bivariate pairs of variables, as well as to the full trivariate data sets. These formal tests were complemented with several of the graphical approaches described in the references at the start of this section, but these are not reported for reasons of space. 5 Applications Stos-Gale et al. (1996) have published lead isotope data for a number of ores in the Aegean, and two of these data sets are examined here. The ® rst set consists of measurements for 62 galenas from Kea in the Cyclades; the second set is for 37 galenas from Seriphos, which is also in the Cyclades. The Kea data are from several ore deposits; those from Seriphos are from a single deposit. The focus is on the performance of the formal tests of normality. It has been suggested (Leese, 1992) that using logarithmically transformed ratios may be more appropriate; however, this was found to make little diþ erence. Practitioners nearly always use the untransformed ratios, and these will also be used here. 5.1 Analysis of the Kea data Figure 1 shows a bivariate plot of the 208 Pb /2 06 Pb ratio against the 20 7Pb / 206 Pb ratio. It was noted from inspection of this and other bivariate plots that some scatters were roughly ellipsoidal, except for the visual suggestion of an `edge’ , corresponding to `truncation’ of the ellipse parallel to one of its axes. By orthogonally rotating the axes of the original plot to coincide with the axes of the ellipse, and carrying out tests of univariate normality along the directions de® ned by the new axes, there is a much greater chance of formally detecting non-normality. A quick way of de® ning a rotation is to undertake a principal component analysis on pairs of (unstandardized) ratios, and then to carry out tests on the principal component scores obtained. Inspection of Fig. 1 suggests that the second component is most likely to indicate non-normality. The principal component analysis does not necessarily select an `optimal viewpoint’ in any sense, but proved to be eþ ective. Columns 2 ± 4 in Table 1 show the results of the seven univariate tests applied to the ratios for Kea. None of these results is signi® cant at the 5% level. Carrying out a principal component analysis on the `208 /206’ and `207 /206’ ratios, and testing the second component for normality gives the results shown in the ® nal column of Table 1. The Shapiro± Wilk statistic of 0.9433 is signi® cant at 0.7%; the Anderson± Darling statistic of 1.13 is signi® cant at 1%; b 11 /2 5 2 0.70 is signi® cant at 5%; the K 2 test is signi® cant at 7%; and the QH * test is signi® cant
676
M. J. B axter & N. H. Gale
F IG. 1. Bivariate plot of Kea 207 /206 and 208 /206 ratios. Labels indicate from which of eight ore deposits the data com e.
TABLE 1. Tests of univariate norm ality for the Keos data Isotope ratios Test W A* D K2 b 11 /2 b2 QH * 2
2
208 /206
207 /206
206 /204
0.9799 0.329 0.945 2.631 0.204 2.274 0.044
0.9864 0.320 0.158 0.698 0.239 2.782 0.077
0.9926 0.197 1.041 1.152 0.147 3.346 0.108
2
2
2
2
2
2
2
PCA 0.9433 1.132 0.942 5.282 0.703 2.768 0.103
Note: The colum n for PCA is based on the second com ponent in a principal component analysis of the 208 /206 and 207 /206 data.
at 1%. For the principal component scores for the 208 /206 and 207 /206 ratios, Royston’ s H was signi® cant at 2%; otherwise, none of the multivariate tests for any of the bivariate data was signi® cant at the 5% level. For the full trivariate data sets, T 3 , T 4 and T were signi® cant at 4%, 3% and 0.5%, respectively, assuming that asymptotic results are reasonable for n 5 62. Royston’ s H, applied to the principal component scores, was not signi® cant at the 15% level. The principal component that is indicative of non-normality is of the form 2 0.15y 1 + 0.99y 2 , where y 1 is the 208 /206 ratio and y2 is the 207 /206 ratio. It was noted in Section 4 that this is not guaranteed to be an `optimal’ choice, and replacing 2 0.15 by 2 0.2 produces a value for W that is signi® cant at 0.2%, and
Univariate tests for multivariate normality
677
F IG. 2. Adaptive kernel density estim ate for the Kea data of 2 0.2y 1 + 0.99 y2 , where y 1 is the 208 /206 ratio and y 2 the 207 /206 ratio.
values for the Anderson± Darling and QH * statistics that are signi® cant at 0.5%. Since the view selected is data dependent, such signi® cance levels are not strictly valid; nevertheless, it is still clear that the statistics are strongly indicative of nonnormality. Figure 2 shows an adaptive kernel density estimate for 2 0.2y1 + 0.99y 2 . To construct the estimate, the procedure described in Silverman (1986, p. 100) was followed, using the Sheather± Jones `solve the equation’ approach (Wand & Jones, 1995, pp. 74± 75) to select a pilot estimate. The method was implemented using MATLAB routines described by (and available from) Beardah and Baxter (1996). The density is bimodal with a longish tail to the right and a sharp `cliþ ’ to the left, corresponding to the edge evident in Fig. 1. The possibility that the modes might be associated with data from diþ erent ore deposits was examined, but it is apparent, on inspection of Fig. 1, that this is not the case. In summary, there appears to be evidence that the Kea data have a non-normal distribution. The strongest evidence for this comes from the W, A* and QH * statistics, applied after choosing a direction in which to view the data; Royston’ s H applied to one of the bivariate pairs; and T obtained using all the data.
5.2 Analysis of the Seriphos data The results of the analyses for Seriphos are presented in Table 2. As with the Kea data, none of the statistics for the individual ratios shows evidence of non-normality at the 5% level. Graphical analyses for all pairs of ratios suggested that the 208 /206 and 206 /204 ratios were most non-normal. If the directional test is applied to this pair and the scores on the second component
678
M. J. B axter & N. H. Gale TABLE 2. Tests of univariate norm ality for Seriphos data Isotope ratios Test W A* D K2 b 11 /2 b2 QH * 2
2
208 /206
207 /206
206 /204
0.9911 0.150 0.251 0.063 0.025 2.584 0.122
0.9711 0.393 0.533 0.024 0.004 2.798 0.060
0.9742 0.246 0.527 0.727 0.020 2.317 0.068
2
2
2
2
PCA 0.8858 1.687 2 5.405 13.984 1.203 5.060 0.2013
Note: The colum n for PCA is based on the second com ponent in a principal component analysis of the 208 /206 and 206 /204 data.
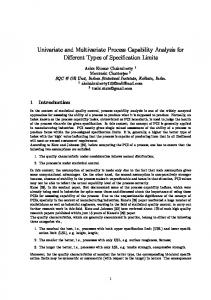
examined, the results in the ® nal column of Table 2 are obtained. The ® rst ® ve statistics and QH * are all highly signi® cant (better than 0.5%), while the kurtosis statistic is signi® cant at about 2%. For the principal component scores from this pair of ratios, Royston’ s H is signi® cant at 0.5%, while b 1, p is signi® cant at 2.5% and T is signi® cant at 1.5%. No other bivariate pairs are signi® cant at 5% using any of the multivariate tests. For the full trivariate data set, Royston’ s H applied to the principal components was signi® cant at 1%, and the other tests were all signi® cant at about this level or better. In particular, T 5 55.3 was signi® cant at the 0.5% level but, with n 5 37, the asymptotic results used to obtain this may not be strictly valid. A plot of the 208 /206 and 206 /204 ratios (Fig. 3) suggests several points (such as 14, 31 and 32 above, and (possibly) 9 and 37 below the main scatter) that look unusual. Removing these in various combinations does not change the conclusions about non-normality.
F IG. 3. Bivariate plot of Seriphos 208 /206 and 206 /204 ratios. Labels give the index of the points.
Univariate tests for multivariate normality
679
F IG. 4. Adaptive kernel density estim ates for the Seriphos data for the second com ponent from a principal com ponent analysis of the 208 /206 and 206 /204 ratios.
Figure 4 shows an adaptive kernel density estimate of the scores on the second principal component. There is a sharp concentration of data at about 0.365, corresponding to the points that lie close to a line that connects points 12 and 34 in Fig. 3. The long tail to the left-hand side of Fig. 4 corresponds to the scatter in the direction of the upper left-hand corner of Fig. 3. The `cliþ ’ to the right-hand side of Fig. 4 is less sheer than that in the corresponding ® gure for Kea, because of points 9, 37, 35 and 1. The evidence of non-normality here is compelling. Results from analyses of the two data sets show a number of interesting features that are now considered.
5.3 A comparison between tests Both data sets are interesting in that they are examples where there is no evidence that the marginals are non-normal, but there is strong evidence of bivariate or trivariate non-normality. To try and understand why some of the univariate tests produced much stronger evidence of non-normality than did others, a small power study was undertaken. In both analyses, there is visual evidence from the bivariate plots and kernel density estimates of an `edge’ in the data; on this basis, a singly truncated normal distribution was used as the alternative to normality. It is recognized that a model of this type oversimpli® es geochemical reality and is not entirely consistent with the bimodality evident in Fig. 2; nevertheless, it agrees at least qualitatively with ® eld geometries that have been suggested, and the results prove to be interesting. For the simulations that follow, 10 000 observations were generated for a
680
M. J. B axter & N. H. Gale TABLE 3. Perform ance of six tests for 5% truncation Test n
QH *
W
A*
b 11 /2
K2
D
20 40 60 80
0.08 0.12 0.21 0.31
0.06 0.12 0.19 0.25
0.06 0.10 0.11 0.15
0.05 0.09 0.13 0.16
0.04 0.10 0.13 0.20
0.06 0.10 0.10 0.12
TABLE 4. Perform ance of six tests for 15% truncation Test n
QH *
W
A*
b 11 /2
K2
D
20 40 60 80
0.14 0.39 0.63 0.78
0.16 0.35 0.59 0.76
0.12 0.22 0.39 0.68
0.12 0.20 0.36 0.53
0.11 0.19 0.29 0.40
0.08 0.08 0.10 0.10
TABLE 5 Perform ance of six tests for 25% truncation Test n
QH *
W
A*
b 11 /2
K2
D
20 40 60 80
0.26 0.55 0.85 0.95
0.26 0.56 0.80 0.95
0.20 0.38 0.65 0.82
0.16 0.36 0.57 0.72
0.15 0.29 0.43 0.62
0.09 0.11 0.12 0.17
univariate normal distribution. After ordering the data, samples of size n were randomly selected 1000 times, with the value of the seven statistics listed in Section 4 being calculated for each of the 1000 replications. This was carried out for n 5 10, 20, 40, 60, 80, 100, and for 0%, 5%, 10%, 15%, 20% and 25% truncation, and a subset of the results for n 5 20, 40, 60, 80, and 5%, 15% and 25% truncation follow. Tables 3 ± 5 show the proportion of times that each test rejected the hypothesis of normality. The W and QH * tests are comparable, and clearly superior over the range of sample sizes (10 ± 100) and degree of truncation (5%± 25%) studied. Next best, for truncation in excess of about 10%, is the Anderson± Darling test, followed by b 11 /2 and K 2 . D’ Agostino’ s D test performs very poorly. For sample sizes of 20± 30 or less, none of the tests is very powerful, even with truncation as much as 25%. It is the W and QH * tests that produce the strongest evidence of non-normality in the analyses reported in Sections 5.1 and 5.2. For the data sets used here, the simply applied `directional’ approach, applying univariate tests to component scores based on bivariate pairs of ratios, proved eþ ective. Given the multiple testing involved, and the fact that the procedure selected was partly data dependent, the exact signi® cance levels quoted must be viewed with a degree of circumspection. Nevertheless, the evidence for nonnormality is convincing. For the record, it may be worth noting that our approach was initially motivated by inspection of bivariate plots of the Kea data, but was
Univariate tests for multivariate normality
681
then applied to other data sets, including that for Seriphos, without being in¯ uenced by data-based considerations. In other words, a `general’ approach was used for the Seriphos data that did not depend on prior data inspection. Royston’ s (1983) test applied to the original variables did not show any evidence of non-normality, re¯ ecting the fact that none of the marginals shows any evidence of non-normality. W hen applied to principal component scores, based on bivariate pairs and the full data set, evidence of non-normality was forthcoming. This was clear for the Seriphos data in two and in three dimensions, with a particular pair (the 208 /206 and 206 /204 ratios) being responsible. For the Kea data, the 208 / 206 and 207 /206 pair provided evidence of non-normality, but the trivariate analysis did not. This emphasizes the coordinate-dependent nature of Royston’ s approach (and, by implication, other approaches dependent on a principal component transformation). In general, there is no reason to expect a `view’ selected via principal component analysis to be the best view for detecting non-normality. In the present case, the addition of a third variable changes the form of the components that were suggesting non-normality in two dimensions. The results illustrate a point made by Royston (1983) and others, that an analysis of a subset of the variables may be more eþ ective at demonstrating non-normality than might the use of the full data set. In general, the non-normality of a p-variate distribution can be established either by showing that the marginal distribution of q < p variables is non-normal, or by showing that a linear combination of q < p variables is non-normal. If all p variables are included in a test and ( p 2 q) have, for practical purposes, normal marginals, then this can `dilute’ the evidence for non-normality available from the other q variables. The omnibus test developed by Mardia and Kent (1991) was strongly suggestive of trivariate non-normality, particularly for the Seriphos data, as were the various components of their statistic. This observation is subject to the assumption that the use of their asymptotic results is reasonable for the sample sizes used here. Further investigation is needed, perhaps, although it is unlikely to modify the conclusions about the Seriphos data. For bivariate pairs of ratios, only T and T 3 for one of the Seriphos pairs suggested signi® cance at better than 5%, and this was suggested less strongly than by the directional tests and Royston’ s H. The relative merits of the diþ erent univariate tests applied to transformed data, Royston’ s H and the diþ erent multivariate skewness- and kurtosis-based statistics are diý cult to assess. The ® rst two approaches are sensitive to the transformation used and, if the transformation used is data dependent, then this means that the signi® cance levels obtained are not strictly valid. Signi® cance levels for the last approach assume that asymptotic results apply. A very limited power study based on 200 replications for samples of size 40 and 60, selected from truncated distributions mimicking the properties of the data in Fig. 1, suggested that the better univariate directional tests were about twice as powerful as the bivariate skewness statistic. This may explain why the univariate tests produced stronger evidence for non-normality than did the skewness test; but it is also the case that the univariate tests could be expected to perform well, given the study design, and further investigation is needed. In general, it seems sensible to apply more than one approach, since diþ erent methods can emphasize non-normality in diþ erent circumstances. Signi® cance levels need to be viewed with a degree of caution. In any event, and particularly where results appear to con¯ ict, follow-up graphical analyses are important to tr y to establish the nature of any suggested non-normality.
682
M. J. Baxter & N.H. Gale
6 Discussion The results reported here are at variance with the common assumption in much of the literature on lead isotope analysis, that fields have a trivariate normal distribution. Several reasons can be suggestid for the discrepancy between the present and previous findings. One reason may be that most fields previously examined have, indeed, had a normal distribution; however, a more likely reason may be that sample sizes have not been adequate to detect non-normality. The methods used, such as inspection of histograms and the use of probability plots with the three ratios, may also not have been optimal. Interestingly, for the two ore deposits examined in detail here, none of r$e ratios exhibited non-normality, even though there was strong evidence of bivariate non-normality. As was indicated in Section 2,: there is considerable debate about how lead isotope data should be treated, and it is likely that the protagonists in this debate will continue to differ. The mairi implication of this paper is that those who advocate the use of multivariate / statistical methods need to be wary of the consequences of non-normality for Jhe methods they use. What these consequences are is not yet clear.
Acknowledgements The referees for this paper are thanked for constructive comments on an earlier draft that led to a shortened and improved presentation.
REFERENCES BEARDAH, C. C. & BAXTER, M. J. (1996) T& archaeological use of kernel density estimates, Internet /beardah). Archaeology, 1 , 5.1. (http://intarch.ac.uk/jo+rnal/issuel BUDD,P., POLLARD, A. M., SCAIPE,B. & THOMAS, R. G. (1995) Oxhide ingots, recycling and the Meditcrranean metals trade, Journal of ~editerraneanArchaeologv, 8, pp. 1-32. S. S. (1995) An alternative test for normality based on normalized spacings, CHEN,L. & SHAPIRO, Yournal of Statistical Computation and Simulation, 53, pp. 269-287. N. J. H. (1978) Tcsting multivariate normality, Uionzetrika, 65, pp. 263-272. Cox, D. R. & SMALL, D'AGOSTINO, R. B. (1986) Tests for the normal distribution. In: M. A. STBIBHENS & R. B. D'AGOSTINO (Eds), Goodness-of-fit Techniques, pp. 367-419 (New York, Dekker). D'AGOSTINO, R. B., BELANGER, A. & D'AGOSTINO, R. B., JR (1990) A suggestion for using powerful and informal tests of normality, American Statistician, 44, pp. 31 6-321. GALE,N. H. (1989) Lead isotope studies applied to provenance studies: a brief review. In: Y. MANIATIS (Ed.), Archaeometry, pp. 469-502 (Amsterdam, Elsevier). Z. A. (1989) Bronze Age archacometallurgy of the Mediterranean: the GALE,N. H. & STOS-GALE, impact of lead isotope studies: In: R. 0. ALLEN(Ed.), Archaeological Chemistry IV, pp. 159-198 (Washington, DC, American Chemical Society). GNANADESIKAN, R. (1 997) Statistical Data Analysis of Multivariate Observations (New York, Wiley). KOZIOL,J. A. (1986) Assessing multivariate normality-a compendium, Comnzunications in StatisticsTheory and Methods, 15, pp. 2763-2783. ; LEESE,M. N. (1992) Evaluating lead isotope data: comments 11, Archaeometry, 34, pp. 318-322. LOONEY,S. W. (1995) How to use tests for univariate normality to assess multivariate normality, The American Statistician, 49, pp. 64-70. MARDIA, K. V. (1970) Measures of multivariaje skewness and kurtosis with applications, Biometrika, 57, pp. 519-530. MARDIA, K. V. (1974) Applications of some measures of multivariate skewness and kurtosis for testing normality and robustness studies, Sankhya B{36, pp. 115-128. MARDIA, K. V. (1 975) Assessment of multinormality and the robustness of Hotelling's T 2test, Applied Statistics, 24, pp. 163-17 1.
Univariate tests for multivariate normality
683
M ARDIA, K. V. (1980 ) Tests of univariate and m ultivariate norm ality. In: P. R. K RISHNAIAH (Ed.), H andbook of Statistics, Vol. 1, pp. 279 ± 320 (N ew York, North-Holland). M ARDIA, K. V. & K ENT, J. T. (1991 ) Rao score tests for goodness of ® t and independence, B iometr ika, 78, pp. 355 ± 363. R OMEU, J. L. & O ZTURK, A. (1993) A comparative study of goodness-of-® t tests for multivariate norm ality, Jour nal of M ultivariate A nalysis, 46, pp. 309 ± 334. R OYSTON, J. P. (1982 ) An extension of Shapiro and W ilk’ s W test for norm ality to large sam ples, A pplied Statistics, 31, pp. 115 ± 124. R OYSTON, J. P. (1983) Som e techniques for assessing multivariate norm ality based on the Shapiro± W ilk W, Applied Statistics, 32, pp. 121 ± 133 . R OYSTON, J. P. (1992) Approxim ating the Shapiro± W ilk W-test for non-norm ality, Statistics and Computing, 2, pp. 117 ± 119 . S AYRE, E. V., YENER, K. A., J OEL, E. C. & B ARNES, I. L. (1992) Statistical evaluation of the presently accum ulated lead isotope data from Anatolia and surrounding regions, Archaeometr y, 34, pp. 73 ± 105 . S CAIFE, B., B UDD, P., M CD ONNELL, J. G., P OLLARD, A. M. & T HOMAS, R. G. (1996 ) A reappraisal of statistical techniques used in lead isotope analysis. In: S. D EMIRCI , A. M. O ZER & G. D. S UMM ERS (E ds), Archaeometr y 94: Proceedings of the 29th International Symposium on A rchaeometry, Ankara, 9± 14 M ay 1994, pp. 301 ± 307 (Ankara, Tubitak). S EBER, G. A. F. (1984) M ultivariate Obser vations (N ew York, W iley). S ILVERMAN, B. W. (1986) Density Estimation (L ondon, Chapm an and Hall). S TOS-G ALE, Z. A. & G ALE, N. H . (1994) M etals. In: A. B. K NAPP & J. F. C HERRY (E ds), Provenience Studies and B ronze Age Cyprus, pp. 92 ± 121 (M adison, W I, Prehistory Press). S TOS-G ALE, Z. A., G ALE, N. H . & A NNETTS, N. (1996) Lead isotope data from the Isotrace laboratory, Oxford: Archaeometr y data base 3, ores from the Aegean, part 1, Archaeometry, 38, pp. 381 ± 390. S TOS-G ALE, Z. A., M ALIOTIS, G., G ALE, N. H. & A NNETTS, N. (1997) Lead isotope characteristics of the Cyprus copper ore deposits applied to provenance studies of copper oxhide ingots, Archaeometr y, 39, pp. 83 ± 123. W AND, M. P. & JONES, M . C. (1995) Ker nel Smoothing (London, Chapm an and H all).