Dec 13, 2014 - corresponding to a temperature of 416 ± 5 °C. This result implies that an arbitrary ... Keywords: Carbonaceous material, Metapelite, Degree of ...
Journal of Mineralogical and Petrological Sciences, Volume 109, page 279–285, 2014
TECHNICAL NOTE
Testing for robustness on estimation of graphitization degree by Raman spectroscopy Hayato UMEDA* and Masaki ENAMI** *
Department of Earth and Planetary Sciences, Nagoya University, Nagoya 464–8601, Japan ** Center for Chronological Research, Nagoya University, Nagoya 464–8602, Japan
A Raman geothermometer, which utilizes the degree of graphitization of carbonaceous material, has been widely applied to estimate the recrystallization temperature of metapelite. This study evaluates the degree of graphitization of carbonaceous material, which is affected by several factors, and tests the robustness of the Raman carbonaceous material geothermometer defined by the R2 [= D1/(G + D1 + D2) area ratio] value. The main results are as follows. (1) Laser radiation over 6 mW at the sample surface caused a significant decrease in the R2 value, owing to the local increase in surface temperature of the carbonaceous material, and thus gave an overestimation of the recrystallization temperature. On the contrary, laser irradiation of 2 mW showed no distinct alteration of the spectrum during continuous analyses up to 120 s. (2) Carbonaceous materials occurring as matrix and inclusion phases in silicate minerals in a thin section showed no significant difference in R2 value. (3) The average R2 value of 10 samples collected from an outcrop at a scale of 2–3 m was 0.483 ± 0.012, corresponding to a temperature of 416 ± 5 °C. This result implies that an arbitrary sample can likely represent the R2 value of the entire outcrop from which the sample was collected. (4) No distinct alteration of the R2 value around a shear zone width of 1–1.5 m was measured in the metapelites. The degree of graphitization of carbonaceous material was not noticeably altered by deformation during exhumation and local fracturing. Moreover, the Raman analysis of the carbonaceous material under the appropriate laser power condition can estimate the peak metamorphic temperature of rocks regardless of scale from thin section to outcrop. Keywords: Carbonaceous material, Metapelite, Degree of graphitization, Geothermometer, Raman spectroscopy
INTRODUCTION The structure of carbonaceous material systematically changes from disordered material at low temperatures to fully ordered graphite at high temperatures, and it is interpreted to record temperature conditions at peak metamorphism (e.g., Pasteris and Wopenka, 1991; Jehlička and Bény, 1992; Wopenka and Pasteris, 1993). Early research indicates that the degree of graphitization determined by Raman spectroscopic analysis has been developed as a geothermometer (e.g., Beyssac et al., 2002). The Raman spectra of amorphous carbonaceous materials at low–grade metamorphic conditions are identified by five characteristic bands including G (~ 1580 cm−1), D1 (~ 1350 cm−1), D2 (~ 1620 cm−1), D3 (~ 1520 doi:10.2465/jmps.131211 M. Enami, enami@nagoya–u.jp Corresponding author
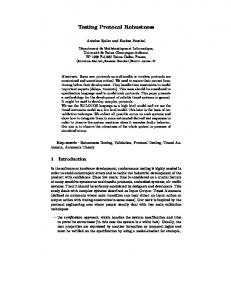
cm−1), and D4 (~ 1250 cm−1) (Fig. 1), where G and D denote bands of fully ordered graphite and disordered carbonaceous material (or defect), respectively. With increasing degrees of graphitization, the Raman intensities of the D3 and D4 bands gradually decrease until the D4 band ultimately disappears. Subsequently, the D3 band also becomes unobservable at temperatures higher than 400–450 °C (Beyssac et al., 2002). The relative intensities of the D1 and D2 bands compared with those of the G band also decrease with increasing metamorphic temperature (e.g., Jehlička and Bény, 1992; Wopenka and Pasteris, 1993), and the Raman spectrum of carbonaceous material shows only a single steep G band under temperatures higher than approximately 650 °C (Beyssac et al., 2002; Aoya et al., 2010). To estimate peak metamorphic temperature, Beyssac et al. (2002) employed the parameter R2 defined as D1/ (G + D1 + D2) area ratio and proposed the following
H. Umeda and M. Enami
280
Intensity
Observed spectrum D1 G
D2 D4
1000
1200
D3 1400
1600
1800
Wavenumber (cm -1)
Figure 1. Peak deconvolution of carbonaceous material in the first–order region of Raman spectrum. This sample (ASU25) was collected from the chlorite zone of the Sanbagawa belt, Asemi–gawa region, central Shikoku. Labels G and D1–D4 denote bands of fully ordered graphite and disordered carbonaceous material (or defect), respectively.
equation as a Raman spectroscopy of carbonaceous material (RSCM) thermometer for regional metamorphic rocks in the range of 330–640 °C: T ð� CÞ ¼ �445 R2 þ 641 ð�50 � CÞ: Aoya et al. (2010) confirmed that the parameter R2 proposed by Beyssac et al. (2002) can be applied to temperature estimations for both regional and contact metamorphic rocks, and they proposed improved RSCM geothermometer. Rahl et al. (2005) combined the parameter R2 with a parameter R1 defined as (D1/G)H, which indicates the intensity ratio of the D1 and G bands, and they proposed a geothermometer applicable to temperatures as low as 100 °C. Area ratios RA1 = (D1 + D4)/(D1 + D2 + D3 + D4 + G) and RA2 = (D1 + D4)/(D2 + D3 + G) (Lahfid et al., 2010), the width of the D band including D1 and D2 (ΓD) (Busemann et al., 2007), and full width at half maximum (FWHM) of D1 and D2 bands (Kouketsu et al., 2014) were also employed as RSCM geothermometers for low– to medium–grade metapelites of 100– 400 °C. The RSCM thermometry is currently recognized as an empirical equation for estimation of peak metamorphic temperature and has been used extensively for various types of low– to medium–grade metamorphic rocks. However, a lack of understanding remains for sample preparation and analytical conditions, which may affect the estimation of peak temperature. These factors include (i) damage to the structure of carbonaceous material induced by sample polishing (Nemanich and Solin, 1979; Pasteris, 1989), (ii) magnification of the microscope objective lens with different numerical apertures (Aoya et al., 2010) and (iii) incident angle of the laser beam relative to the crystallographic orientation of the carbonaceous material (e.g., Katagiri et al., 1988; Aoya et al.,
2010). In this study, to avoid damages that occur during polishing, measurements were obtained on grains sealed within minerals unless otherwise stated. The issues stated in points (ii) and (iii) above were studied in detail by Aoya et al. (2010), who concluded that the difference in numerical apertures has no significant effect on temperature estimation. Moreover, they reported that the orientation effect is significant, particularly on well–crystalized carbonaceous material, and that the average R2 value is likely ~ 0.03. Some issues may remain that must be considered for enhancing the practicality of the RSCM geothermometer. These factors include (1) the relationship among the irradiation time of the laser and the Raman spectral pattern and temperature estimation, (2) variations in degrees of graphitization in a thin section owing to the difference in mode of occurrence of the carbonaceous material, (3) evaluation of the degree of graphitization among samples collected from an outcrop, and (4) the effect of sample deformation on the degree of graphitization. These issues are analyzed and discussed in this study. ANALYTICAL PROCEDURES A Raman spectrum of carbonaceous material was obtained using Raman microspectroscopy (Thermo Fisher Scientific Almega XR) with a grating of 2400 lines/mm. The instrument is equipped with a 532 nm Nd–YAG laser, a charge–coupled device (CCD) detector (256 × 1024 pixels), and an automated confocal microscope (Olympus BX51). The objective is an Olympus LMplan Fl–BD 50X with a numerical aperture of 0.5. The spatial resolution is 1–2 µm. Room temperature was maintained at 22 ± 1 °C. The spectrometer was calibrated by monitoring the position of the plasma lines of a Ne lamp. The irradiation laser power at the sample surface was changed using Neutral Density (ND) filters of 16, 25, 30, 40, 50, 65, 80, and 100%. The Raman spectrum of the first–order region (1000 and 1750 cm−1) was deconvoluted using the PeakFit v4.12 computer program and was then separated into five bands labeled G, D1, D2, D3, and D4 according to the Voigt profile for optimizing amplitude. Figure 1 shows an example of a peak deconvolution applied to carbonaceous material in a metapelite (ASU25) collected from the chlorite zone of the Sanbagawa belt in the Asemi–gawa (River Asemi) region, central Shikoku (33°46′55′′N, 133°33′25′′E) (Higashino, 1990). The degree of graphitization was determined on the basis of the R2 parameter of Beyssac et al. (2002) and was converted to the crystallization temperature with calibration by using a 532 nm laser proposed by Aoya et al. (2010):
Robustness of estimation of GD by Raman spectroscopy
281
50
�
2
�
Peak intensity of G band (cps)
T ð CÞ ¼ 221:0 ðR2Þ � 637:1ðR2Þ þ 672:3 ð�30 CÞ:
RESULTS AND DISCUSSION Appropriate measurement conditions
30
20
10
0 0
10
20
30
40
50
60
Irradiation laser power (mW)
Figure 2. Relationship between laser power (LP) and intensity of the G band (IG) obtained by 30 s analysis for sample AM01 from the former Amo mine, Gifu Prefecture.
Lp (mW)
2, 6, 53,
R2
T (°C)
0.394, 456 0.322, 490 0.227, 513
Intensity
Carbonaceous material is optically opaque and absorbs more energy of visible–light laser than common silicate minerals. Therefore, the Raman spectrum of carbonaceous material may change in varying degrees as a result of crystallinity damage or heating caused by the irradiation of a visible–light laser. Thus, the effects of laser irradiation on the Raman spectrum should be considered. In this study, the relationships between the Raman spectrum and the power of the primary laser beam were determined by using a graphite chip (sample AM01) and carbonaceous material in a metapelite sample (AS1914) employing a dataset obtained by accumulation of three 10 s measurements. Sample AM01, which was collected from the (former) Amo mine, Gifu Prefecture, is a fully ordered graphite, showing a single G band peak by micro–Raman spectroscopy; we used its polished slab for measurement. Measurements using irradiation laser power (Lp) of 1 mW at the sample surface had a very low signal to noise (S/N) ratio and showed no significant G band. Thus, the relationship between the intensity of the G band (IG) and LP was measured for LP higher than 2 mW. The IG increased linearly with an increase in LP up to approximately 6 mW, followed by a gradual decrease in the IG/LP value at higher LP conditions (Fig. 2). Sample AS1914, collected from the garnet zone grade of the Sanbagawa belt in the Asemi–gawa region (33°49′45′′N, 133°33′1′′E), is composed mainly of garnet, chlorite, phengite, albite, quartz, and carbonaceous material. Figure 3 shows the relationship between the Raman spectrum of carbonaceous material in this sample and LP. With an increase in LP, the Raman spectrum showed an increase in peak intensity and a decrease in the intensity ratio of the peaks of the D1 and G bands (ID1/IG). Moreover, these peaks shifted toward lower wavenumbers. Such anomalous temperature dependence of Raman spectra of carbonaceous material has been well documented by previous studies (e.g., Zouboulis and Grimsditch, 1991; Raravikar et al., 2002). Kagi et al. (1994) revealed a systematic correlation of the E2g frequency of graphite and the laser power caused by the laser–induced heat effect, and they recommended employment of sufficiently low laser power to prevent severe laser heating. An alternative determination factor for the change in Raman spectra with increasing LP is detec-
40
1200
1300
1400
1500
1600
1700
Wavenumber (cm -1)
Figure 3. Relationship between the R2 value and laser power obtained by 30 s analysis for sample AS1914 from the garnet zone grade of the Sanbagawa belt in the Asemi–gawa region, central Shikoku.
tion of local damage to graphite at the measured point. Niwase (1995) studied the influence of irradiation energy on graphite structures in detail and showed that the I1353/ I1580 value and FWHM1580, where the subscripts imply two main peaks corresponding to D1 and G, increase with increasing irradiation energy and further with increasing irradiation damage. This finding does not sufficiently explain the systematic decrease in ID1/IG value with increasing LP, as shown in Figure 3. Additionally, the change in spectra was shown in the present study to be reversible through repeated analyses using high– and low–LP. Therefore, the systematic changes in the Raman spectra and peak intensities shown in Figures 2 and 3 are likely due to the degree of heating and are not attributed to irreversible structural changes in the carbonaceous material. Thus, maintaining low laser power irradiation is the most important factor when the RSCM geothermometer is used for temperature estimation, as reported by
H. Umeda and M. Enami
282 (a)
Temperature (°C)
(b)
R2 value
0.2
0.3
0.4
120s Irradiation time (s)
Figure 4. Relationships between the (a) Raman spectrum or (b) estimated R2 value and measurement duration at a laser power of around 2 mW at the sample surface for sample AS1919 from the albite–biotite zone grade of the Sanbagawa belt in the Asemi–gawa region, central Shikoku.
60s
30s
10s 600
800
1000
1200
1400
1600
1800
Wavenumber (cm -1)
Kagi et al. (1994). The changes in Raman spectrum observed in the Sanbagawa metapelite resulted in a decrease in R2 value and an apparent increase in estimated temperature from 456 °C (R2 = 0.394) to 513 °C (R2 = 0.227) for LP = 2 mW and 53 mW, respectively. The equilibrium temperature condition of the garnet zone in the Asemi–gawa region, from which the sample was collected, is up to 470 °C (Enami et al., 1994; Wallis et al., 2000), and that of AS1914 has been estimated to be 460 °C by garnet– chlorite Mg–Fe geothermometer (Taguchi, personal communication, 2013). Thus, our temperature estimation by using an RSCM geothermometer with an LP of 2 mW is consistent with the temperature estimated using the conventional methods; those estimated with an LP of more than 6 mW have distinctly higher values. The relationship between IG and LP suggests that irradiation laser power of more than 6 mW may severely affect spectra measurements of carbonaceous material and inevitably interfere with the estimation of graphitization. Previous studies also employed similar irradiation power between 1–5 mW for their measurements (Beyssac et al., 2002; Aoya et al., 2010; Lahfid et al., 2010; Kouketsu et al.,
2014). Therefore, the following measurements were all conducted around 2 mW LP at the sample surface. Figure 4 shows the relationship among the Raman spectrum (Fig. 4a), estimated R2 value (Fig. 4b), and measurement duration. The data were obtained through analysis of a Sanbagawa metapelite (sample AS1919) collected from the albite–biotite zone grade of the Asemi– gawa area, central Shikoku (33°50′5′′N, 133°3′2′′E). The major constituent minerals of the sample are biotite, garnet, chlorite, phengite, albite, quartz, and carbonaceous material. Continuous laser irradiation up to 120 s caused no obvious alteration in the spectrum (Fig. 4a). The estimated R2 value increased slightly from 0.253 to 0.264 during irradiation for 30 s and then showed a fairly constant value of 0.269 ± 0.002 during irradiation from 30 s to 120 s (Fig. 4b). The R2 decrease during the initial 30 s corresponds to a decrease of 5 °C in the estimated temperature. The temperature estimations by analyses from 30 s to 120 s are fairly constant with an average value of 517 ± 1 °C, which is consistent with the temperature conditions of the albite–biotite zone estimated by conventional geothermometers (470–590 °C: Enami et al., 1994; Wallis et al., 2000). Therefore, continuous analyses over several tens of seconds with an LP of 2 mW had no significant effect on the temperature estimation. Relationship between modes of occurrence of carbonaceous material and degree of graphitization The relationship between the crystallographic orientation of carbonaceous material and the incident direction of the laser beam also have a significant effect on Raman spectra, particularly in the case of well–ordered synthetic graphite (e.g., Katagiri et al., 1988; Compagnini et al., 1997). However, Aoya et al. (2010) examined regional and contact metamorphic rocks recrystallized under various temperatures, and concluded that there was no significant difference in R2 value and other parameters,
Robustness of estimation of GD by Raman spectroscopy 30
(N=100)
Inclusion in Quartz Albite Biotite
25
In matrix
20
Frequency
which is possibly attributed to the crystallographic orientation. Nakamura and Akai (2013) determined that the crystallite sizes of carbonaceous material, or relative stacking sizes of the hexagonal sheets, in regional and contact metamorphic rocks were up to 70 nm and 100 nm, respectively. The random distribution of such fine crystals likely canceled the orientation effect to give a relatively constant R2 value. The crystallite size of carbonaceous material in the Sanbagawa metapelites is estimated as