quantitative variables, the exploratory analysis of spatial qualitative variables is ... this context that the hypothesis of spatial independence of qualitative data is ...
Testing for Spatial Association of Qualitative Data Using Symbolic Dynamics
Manuel Ruiz, Fernando López Facultad de C.C. de la Empresa Dpto. Métodos Cuantitativos e Informáticos Universidad Politécnica de Cartagena Antonio Páez Centre for Spatial Analysis School of Geography and Earth Sciences McMaster University Published in Journal of Geographical Systems doi:10.1007/s10109-009-0100-1 Abstract. Qualitative spatial variables are important in many fields of research. However, unlike the decades-worth of research devoted to the spatial association of quantitative variables, the exploratory analysis of spatial qualitative variables is relatively less developed. The objective of the present paper is to propose a new test (Q) for spatial independence. This is a simple, consistent, and powerful statistic for qualitative spatial independence that we develop using concepts from symbolic dynamics and symbolic entropy. The Q test can be used to detect, given a spatial distribution of events, patterns of spatial association of qualitative variables in a wide variety of settings. In order to enable hypothesis testing, we give a standard asymptotic distribution of an affine transformation of the symbolic entropy under the null hypothesis of independence in the spatial qualitative process. We include numerical experiments to demonstrate the finite sample behaviour of the test, and show its application by means of an empirical example that explores the spatial association of fast food establishments in the Greater Toronto Area in Canada. Keywords. Spatial independence, qualitative variables, symbolic dynamics, entropy, fast food
0
1 Introduction The concept of spatial autocorrelation is central to any effort to understand the spatiality of phenomena, and to build spatial theory and models (Griffith 1999; Miller 2004). From its origins in mathematical statistics (Geary 1954; Krishna Iyer 1949; Moran 1948) the notion of autocorrelation has animated, and in turn been given lasting currency by, quantitative geography, spatial analysis, and spatial statistics (Getis 2008). It is from these disciplines that the analysis of map patterns has diffused throughout, starting with the work of quantitative geographers (e.g., Dacey 1968), to Cliff and Ord (1973, 1981) and Ripley (1981), through the texts of Anselin (1988), Griffith (1988), Haining (1990), and Cressie (1993). Now, spatial autocorrelation analysis is used to support research in an ever increasing sphere of cogent disciplines. A vast majority of work in spatial analysis has historically been concerned with the analysis of variables of a continuous and interval nature. It is thus interesting to note that in fact the first attempt to describe maps from a statistical point of view, was made in reference to qualitative variables (Dacey 1968; Moran 1948), specifically black and white colored (or later k-colored) maps, and only in second place to continuous variables (Cliff and Ord 1973; Geary 1954; Moran 1950). The reason for this historical development seems clear. Linear regression for the multivariate analysis of continuous variables was, until relatively recent times, the instrument of choice for statistical analysis of spatial data. In turn, the analysis of map patterns was, almost from the beginning, meant to serve as a diagnostic tool for the analysis of residuals in linear regression (see Geary 1954, pp. 115-116 and again p. 144). Despite the traditional focus on continuous variables in spatial analysis, there are numerous situations where qualitative variables are the focus of research, and it is in this context that the hypothesis of spatial independence of qualitative data is important. Besides early work with join count statistics (e.g., Cliff and Ord 1981; Dacey 1968; Upton and Fingleton 1985), and some more recent work by Boots (2003), not much research has been devoted to this class of problems in an exploratory setting, even if spatial modeling techniques for qualitative data have seen significant progress in recent years (e.g., Bhat and Sener 2009; Chakir and Parent 2009; Dubin 1995; McMillen 1992; Paez 2006; Robertson et al. 2009; Wang and Kockelman 2009). The objective of this paper is to propose a new statistic for the exploratory analysis of spatial qualitative/nominal data. The statistic is meant to identify whether neighbouring values of a spatial qualitative variable tend to be more similar or dissimilar than would be expected by chance. The approach proposed to test this hypothesis of spatial independence for qualitative variables is based on principles drawn from symbolic dynamics. Symbolic dynamics has been used for the investigation of non-linear dynamic systems (Hao and Zheng 1998) and provide an ideal set of tools for representing discrete processes. We use these tools to derive a new statistic, termed Q, parting from a function of symbolic entropy. In addition, we discuss the theoretical properties of the proposed statistic and investigate its finite sample behaviour by means of an extensive set of numerical experiments. Finally, we illustrate the usefulness of the Q statistic empirically with a case study that explores the spatial association of various fast food establishment types, namely Pizza, Hamburger, and Sandwich establishments, in the Greater Toronto Area eein Canada. In the concluding section, we discuss a number of valuable features of our statistic, and directions for future research.
1
2 Background As noted above, the study of autocorrelation of qualitative variables was among the earliest forms of spatial analysis, but from the start meant to support the use of linear regression for continuous variables. Some early applications confirm this connection, as for example the analysis that Haining (1978) conducted for crop failures in Nebraska and Kansas. While the premise that crop failures formed one or more regional clusters had been previously advanced (e.g., Hewes 1965), application of a contiguity measure by Haining (1978) provided the statistical evidence necessary to confirm the visual appraisal of crop failure patterns. An intriguing feature of this study is the conversion of an interval variable (percentage failure) to a nominal variable by taking values below or above the mean, or in other words, the categorization of a continuous variable. This is not a lonely example of such practice of discretizing continuous variables, and other instances include Chuang and Huang’s (1992) assessment of the level of noise in digital images that converted grey scale radiological images to black and white patterns, or Goldsborough’s (1994) study of algal enumeration, whereby overall mean density was used to classify units as “dense” or “sparse”. One can only speculate as to the reasons why continuous variables were converted to nominal variables in these studies, since the fact that reduction to a nominal variable involves some serious information loss was not lost in these authors (see Chuang and Huang 1992, p. 367). From a computational standpoint, there are indications that as late as 1992, the process of counting joins required to calculate autocorrelation statistics was still fraught with difficulties and plagued with errors (Ghent et al. 1992). Relative simplicity may have also been a factor. In any case, it is clear that a vast majority of research efforts were indeed devoted to the development of statistics for continuous variables to serve the needs imposed by the extended use of regression analysis. As a result, it is conventional in contemporary spatial analytical practice to use statistics appropriate for continuous variables at the global (Moran’s I, Geary’s c, variographic analysis) or local level (Anselin 1995; Getis and Ord 1993). There are multiple examples of research where the focus is in fact a qualitative variable. In integrated chip manufacturing, for instance, the spatial structure of nonfunctional chips in wafers is recognized as a way to provide useful information about the manufacturing process. In this case, chips in a wafer are classified as “good” or “bad” (e.g., Taam and Hamada 1993, p. 150), and the objective is to determine whether defects are randomly or non-randomly scattered. Nominal data are also found in plant pathology, as in De Jong and De Bree’s (1995) study of spatial patterns of disease in commercial fields of leek, where the variable of interest is a health status binary classification (“healthy” and “infected”). Likewise, Real and McElhany (1996) discuss the use nominal variables when these are the disease status of plants. In veterinary science, Mannelli et al. (1998) have studied swine fever in Sardinia using municipal level data following a binary classification scheme defined as “outbreak” and “unaffected”. In evolutionary biology, spatial variation in fitness was examined by Stratton and Bennington (1996) in an experiment implemented to infer natural selection processes that operate in space through the assessment of spatial variations in genotype distribution. In this experiment, data collected after a random initial distribution of seeds was analyzed to elucidate whether plants that carry identical genetic markers are spatially associated, and the classification was defined by means of identity, that is, patterns of association of plants with the same genetic markers (e.g., if there are three markers, then AA, Aa, aa). In separate research, Epperson and Alvarez-Buylla (1997) also investigate the spatial structure of nominal variables based on joins for two genotypes. Bell et al. (2008) are interested in spatial patterns of injury. In this 2
investigation, join count statistics are used to describe the spatial co-occurrence of injuries by assault or intentional self-harm, with the results suggesting that assault injuries sustained by males who resided in neighbouring areas were more frequent than expected purely by chance. Self-harm injuries did not display the same strength of spatial pattern. The intention of the statistic proposed in this paper is to support analysis in research that makes use of qualitative variables, such as the examples above.
3 Symbolization of a spatial process with discrete outcomes Development of the Q statistic is based on the application of symbolic dynamics concepts. Symbolic dynamics is an approach, developed in the field of mathematics for the study of dynamical systems (Hao and Zheng 1998) that consists of modelling a dynamic system by means of a discrete set consisting of sequences of abstract symbols obtained for a suitable partition of the state space. The basic idea behind symbolic dynamics is to consider a space in which the possible states of a system are represented, and each possible state corresponds to one unique point in the state space. This space can then be partitioned into a finite number of regions and each region can be labelled by an alphabetical letter. In this regard, symbolic dynamics is a coarse-grained description of dynamics. Even though coarse-grained methods lose a certain amount of detailed information, some essential features of the dynamics may be kept, including periodicity and dependencies, among others (for an overview of these concepts see Hao and Zheng 1998). If the process is inherently discrete to begin with, then symbolic dynamics provide an ideal tool for its study. In order to implement symbolic dynamics concepts the symbols for a process must be defined, or in other words, the process needs to be symbolized. In principle, there is no reason to anticipate that symbolization procedures will be unique given a spatial process, and in fact it is possible to conceive of several possible ways to symbolize a process. Therefore the general framework proposed here can be adapted to the necessities of specific problems, and just as is the case with connectivity matrices in spatial modelling, it is generally possible to incorporate substantive understanding of the process of interest in order to refine the symbolization procedure. This is a feature that lends great flexibility to our approach. In order to ensure broad applicability of the statistic proposed, in this paper we propose a general, all-purpose symbolization procedure which allows us to capture the dependencies of a discrete process in geographical space. Let us begin by defining a discrete spatial process { X s }sS , where S is a set of geographical coordinates that denote the locations of events. These locations are given and fixed. Further, denote by A {a1 a2 … ak } the set of possible values that X s can take, for all s S . Clearly, there are k different categories in this notation, which could be “black”/”white” or “yes”/”no” (k=2), “AA”/”Aa”/”aa” if there are three genetic markers (k=3), and so on. In other words, observations are made at spatially discrete locations, and the outcome of the process is discrete as well. A natural way to symbolize such a process is to embed it in an m-dimensional space as follows: X m (s0 ) ( X s0 X s1 … X sm1 ) for s0 S
(1)
where s1, s2,..., sm-1 are the m-1 nearest neighbours of s0. We will call this m-dimensional space an m-surrounding. A key to symbolizing the process is to define the criteria that determine which spatial events are the neighbours of s0. To this end, we propose a definition of neighbours based on proximity (i.e. nearest neighbour criterion). Whenever 3
two neighbours are equidistant, then the polar coordinates ( i0 i0 ) of si are considered, taking s0 as the origin. This implies that the m-1 nearest neighbours will be those events satisfying the following two conditions that ensure the uniqueness of X m ( s) for all sS : (a)
The distance of the m-1 neighbours from s0 satisfies the condition that 10 20 … m0 1 ; and
(b)
In the case of a tie in terms of the distance from s0, (i.e. if i0 i01 ) then precedence goes to the smaller angle (i.e. i0 i01 ).
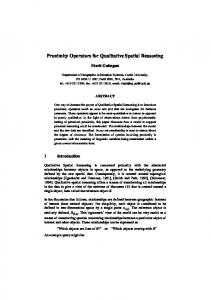
The set of the m-1 nearest neighbours is denoted as Ns {s1 s2 … sm1} . Since an m-surrounding X m ( s) consists of m observations, and there are k possible values that each observation can take, there are km distinct combinations of values for an msurrounding. We will denote each of these unique combinations by an abstract symbol, say i, and will define {1 2 … k m } as the set of all possible symbols. Furthermore, we will say that a location s is of i -type if and only if X m (s) i . As an illustration of the symbolization procedure, consider a simple spatial system consisting of a regular hexagonal tessellation as shown in Fig. 1, and a process with two possible outcomes (k=2). The outcomes are shown in the figure in dark color when they are class 1 and light color when they are of class 2. Taking m=6 as the size of the m-surrounding, this gives a total of 26=64 different combinations of values, or symbols (1 through 64), as listed in Table 1. Please note that a hexagonal tessellation is used only for illustrative purposes. The symbolization procedure is equally applicable to regular and irregular distributions of observations, and to points as well as areas.
Fig. 1. Simple spatial system and process with two types of outcomes. Since in a hexagonal tessellation the distance from s0 is the same for all 6 contiguous spatial units, and keeping in mind that polar coordinates begin at an angle of 0 in the positive direction of the x axis in Cartesian coordinates, it should be clear that neighbours are arranged in order of increasing angle from the origin of the polar coordinate system. Then, referring again to Fig. 1, we say that location s1 is of symbol 13, since X m (s1 ) (1,1, 2, 2,1,1) , whereas location s2 is of symbol 34, since X m (s2 ) (2,1,1,1,1, 2) . It is important to note that while the number of classes k is determined by the 4
nature of the process, the size of the m-surrounding is not, which gives some flexibility to the analyst to explore various alternatives, however bounded by the necessity to satisfy some minimum conditions required to ensure desirable statistical properties, as discussed more fully below. Table 1. List of symbols for k=2, m=6 1 =(1,1,1,1,1,1)
17 =(1,2,1,1,1,1)
33 =(2,1,1,1,1,1)
49 =(2,2,1,1,1,1)
2 =(1,1,1,1,1,2)
18 =(1,2,1,1,1,2)
34 =(2,1,1,1,1,2)
50 =(2,2,1,1,1,2)
3 =(1,1,1,1,2,1)
19 =(1,2,1,1,2,1)
35 =(2,1,1,1,2,1)
51 =(2,2,1,1,2,1)
4 =(1,1,1,1,2,2)
20 =(1,2,1,1,2,2)
36 =(2,1,1,1,2,2)
52 =(2,2,1,1,2,2)
5 =(1,1,1,2,1,1)
21 =(1,2,1,2,1,1)
37 =(2,1,1,2,1,1)
53 =(2,2,1,2,1,1)
6 =(1,1,1,2,1,2)
22 =(1,2,1,2,1,2)
38 =(2,1,1,2,1,2)
54 =(2,2,1,2,1,2)
7 =(1,1,1,2,2,1)
23 =(1,2,1,2,2,1)
39 =(2,1,1,2,2,1)
55 =(2,2,1,2,2,1)
8 =(1,1,1,2,2,2)
24 =(1,2,1,2,2,2)
40 =(2,1,1,2,2,2)
56 =(2,2,1,2,2,2)
9 =(1,1,2,1,1,1)
25 =(1,2,2,1,1,1)
41 =(2,1,2,1,1,1)
57 =(2,2,2,1,1,1)
10 =(1,1,2,1,1,2)
26 =(1,2,2,1,1,2)
42 =(2,1,2,1,1,2)
58 =(2,2,2,1,1,2)
11 =(1,1,2,1,2,1)
27 =(1,2,2,1,2,1)
43 =(2,1,2,1,2,1)
59 =(2,2,2,1,2,1)
12 =(1,1,2,1,2,2)
28 =(1,2,2,1,2,2)
44 =(2,1,2,1,2,2)
60 =(2,2,2,1,2,2)
13 =(1,1,2,2,1,1)
29 =(1,2,2,2,1,1)
45 =(2,1,2,2,1,1)
61 =(2,2,2,2,1,1)
14 =(1,1,2,2,1,2)
30 =(1,2,2,2,1,2)
46 =(2,1,2,2,1,2)
62 =(2,2,2,2,1,2)
15 =(1,1,2,2,2,1)
31 =(1,2,2,2,2,1)
47 =(2,1,2,2,2,1)
63 =(2,2,2,2,2,1)
16 =(1,1,2,2,2,2)
32 =(1,2,2,2,2,2)
48 =(2,1,2,2,2,2)
64 =(2,2,2,2,2,2)
Once the symbolization of the process has been defined, it is possible to calculate the frequency of each symboli, which is simply the number of locations s that are of i -type: n i {s S X m (s) i }
(2)
where denotes the cardinality of a set. Since this frequency is defined for each of km symbols, under the conditions above, the relative frequency of a symbol can be easily computed as: p( ) p
{s S s is of type} S
(3)
whereby S denotes the cardinality of the set S (the total number of symbolized observations). Now, under this setting, we can define the symbolic entropy of the spatial process { X s }sS for an embedding dimension m 2 . This entropy is defined as the Shanon’s entropy of the k m distinct symbols as follows:
h(m) p ln( p )
(4)
5
Symbolic entropy, or h(m) , is the information contained in comparing the msurroundings defined for the spatial process. Notice that when one symbol, say i , tends to dominate the process then p i 1 and p j 0 for all j≠i, which implies that
p i ln( p i ) 0 and p j ln( p j ) 0 and therefore h m 0 . Furthermore, when the
values of the qualitative variable are identically and independently distributed, all k m symbols should appear with equal frequency, in which case we have that p i 1/ k m for all i. The entropy function is then bounded between 0 h m ln k m , where the
lower bound indicates a tendency for only one symbol to occur (i.e. there is a tendency towards patterning in the distribution of the values of the qualitative variable), and the upper bound corresponds to a completely random system (i.i.d. spatial sequence). As an illustration, consider the situation illustrated in Fig. 2, with k=2 and m=3, which means that there are 23 8 symbols. The left panel shows a random distribution of the values of the qualitative variable. The histogram of the frequency of each of eight symbols verifies that all symbols appear with similar frequency. The right panel shows the case where the values are distributed non-randomly and two symbols tend to appear with more frequency than the rest. Rarely will the frequency of symbols be identical, and the question that emerges is whether departures from this are significant. In other words, do some symbols appear with more or less frequency than what would be expected by chance alone? The results needed to statistically test this hypothesis are derived next.
Fig. 2. Random and non-random distributions of values of qualitative variable (k=2) and frequency of symbols 6
4 Construction of the independence test In this section, we construct a spatial independence test for a discrete qualitative spatial variable. We also prove that an affine transformation of the symbolic entropy defined in Eq. (4) is asymptotically 2 distributed. Let { X s }sS be a discrete spatial process and m be a fixed embedding dimension. In order to construct a test for spatial independence in { X s }sS , we consider the following null hypothesis: H 0 { X s }sS is spatially independent, against any other alternative. Now, for a symbol i , we define the random variable Z i s as follows: Z i s
1 0
if X m ( s) i
(5) otherwise
that is, we have that Z i s 1 if and only if s is of i -type, Z i s 0 otherwise. Then
Z i s is a Bernoulli variable with probability of “success” p i , where “success” means that s is of i -type. It is straightforward to see that: n
p i 1
i
1
(6)
Let us assume that set S is finite and of order R (the number of symbolized locations). Then we are interested in knowing how many s ’s are of i -type for all symbols i . We construct the following variable to this end:
Y i Z i s
(7)
sS
The variable Y i can take the values {01 2… R} . Notice that not all the variables Z i s are independent (due to the overlapping of some m -surroundings), and therefore Y i is not exactly a binomial random variable. Nevertheless, the sum of dependent Bernoulli variables can be approximated to a binomial random variable whenever (see Soon 1996): (i) (ii)
Dependencies among the indicators are weak; and The probability of the indicators to occur is small.
Condition (ii) is satisfied by the way the symbols have been constructed, since in this case, under the null hypothesis, the probability of success of the indicators Z s is small ( p 1/ k m ). Condition (i), on the other hand can usually be satisfied only if the events are distributed in a regular array, and the size of the m-surrounding is relatively small, in which case the overlaps are minor. More generally, when the size of the msurrounding is large, or when their spatial arrangement is irregular, this condition becomes more difficult to maintain, if we consider all the indicators Z s for all s S . Additional steps are therefore needed to ensure that the dependencies among the indicators Z s are weak. 7
In order to attain a good binomial approximation, we consider a subset of locations S S with controlled overlap, so that the dependencies among the indicators Z s are weak for s S . Use of a subset of locations will cause a loss of information,
and this loss will be greater in the measure that set S is smaller. A reasonable balance therefore must be struck between strongly dependent indicators and too much loss of information. In order to control the amount of overlap among the Bernoulli variables, we can take as S those coordinates in S such that for any two coordinates si s j S the sets of nearest neighbours of si and s j are at most r (a small enough positive integer) if they intersect: 0 if non-overlapping N si N s j r otherwise
(8)
We call this integer r the degree of overlap of the spatial process { X s }sS . We now turn to a method to select the set S satisfying the above condition. Let us define the set S recursively as follows. First chose a location s 0 S at random and fix an integer r with 0 r m . Let N s 0 {s10 s20 … sm0 1} be the set of nearest neighbours to 0 0 s 0 , where the si ’s are ordered by distance to s 0 . Let us call s1 smr 1 and define A0 {s 0 s10 … sm0 r 2 } . Take the set of nearest neighbours to s1 , namely
N s1 {s11 s12 … s1m1} , in the set of locations S
A0 and define s 2 s1mr 1 . Now for
i 1 we define s i smi 1r 1 where smi 1r 1 is in the set of nearest neighbours to s i 1 , N s0i1 {s1i 1 s2i 1… smi 11} , of the set S {ij10 Aj } . Continue this process while there are
locations to symbolize. In the end, we have constructed a set of locations: S {s 0 s1… s R}
(9)
such that the variable Y i Z s can be approximated to a binomial distribution for a sS
i
suitable choice of r . Notice that the maximum number of locations that can be symbolized with an overlapping degree r is R Nmmr 1 , where the operator [ x] denotes the integer part of a real number x . Given the above considerations, we can now state the following results (the proof can be found in the Appendix). Theorem 1 Let { X s }sS be a qualitative discrete spatial process with S N . Let A {a1 a2 … ak } be the set of possible values that X s can take, for all s S . Let r be the overlapping degree of { X s }sS and R [ Nmmr ] 1 , where [ x] denotes the integer part of a real number x . Let {1 2 … k m } be the set of symbols defined in Section 2. Let ij the number of times that class a j appears in symbol
i
and q j P( X a j ) .
Denote by h(m) the symbolic entropy defined in Eq. (2) for a fixed embedding dimension m 2 with m . If the spatial process { X s }sS is independent, then:
k n Q m 2 R i i 1 R m
k
j 1
ij
ln q j h m
(10)
8
is asymptotically k2m 1 distributed. Note that if { X s }sS is also identically distributed, in other words, each value of the 1 variable appears with equal frequency, then q j and therefore Eq. (10) reduces to: k
Q(m) 2R Ln(k m ) h(m) .
(11)
Let be a real number with 0 1 . Let 2 be such that: P( k2m 1 2 )
(12)
Then, to test: H 0 { X s }sS is spatially independent, the decision rule in the application of the Q(m) test at a 100(1 )% confidence level is: If Q(m) 2 then reject H 0 Otherwise do not reject H 0
(13)
5 Properties of the Q(m) test Next, we prove that the Q(m) test is consistent for a wide variety of spatially dependent processes. This is a valuable property since the test will reject asymptotically the assumption of spatial independence whenever there is spatial dependence within the msurrounding. By spatial dependence of order less than or equal to m we mean that, whatever the structure of the spatial process is, there exists dependence between the random variable located at point s and its m -surrounding or a part of it. We will denote by Q(m) the estimator of Q(m) . The proof of the following theorem can be found in the Appendix. Theorem 2 Let { X s }sS be a discrete spatial process, and m 2 with m limPr(Q(m) C ) 1
. Then: (14)
R
under spatial dependence of order smaller than or equal to m for all 0 C C . Thus, the test based on Q(m) is consistent against all spatial dependence of order less than or equal to m. Conversely, since the dependence detected by the test is at most of order m, if the dependence structure of the process is of order larger than m, then it will not be present in every m -surrounding and therefore the symbols may not capture it. Since Theorem 2 implies Q(m) with probability approaching one under spatial dependence of order less than or equal to m, then upper-tailed critical values are appropriate. As previously noted, from a practical point of view, the researcher has to decide upon the embedding dimension m in order to compute symbolic entropy and therefore, to calculate the Q(m) statistic. While this affords some flexibility, there are also some conditions that must be observed in order to guide a decision. Note that the number of locations that are symbolized (R) should be larger than the number of symbols ( k m ) in order to have at least the same number of m-surroundings as symbols have been defined ( i i 1 k m ). When the 2 distribution is applied in practice, and all the expected frequencies are larger than or equal to five the limiting tabulated 2 distribution gives, 9
as a rule, the value 2 with an approximation sufficient for ordinary purposes (see chapter 10 of Rohatgi 1976). For this reason, it is strongly advisable to work with at least 5k m symbolized observations.
6 Finite sample behaviour of Q(m) In this section, we examine the finite sample behaviour of the Q(m) test. This is to establish the power and size of the statistic under various levels of spatial association, sample size, size of the m-surrounding, and degree of overlap. In addition, we explore the potential impact of boundary effects. 6.1 Size and Power of the Test in Finite Samples To investigate the power and size of the test, we conduct an extensive set of numerical experiments. Let us begin with some considerations regarding the data generating process used for the experiments. In order to obtain categorical random variables with controlled degrees of spatial dependence, we have designed a two-stage data generating process. Firstly, we simulate autocorrelated data using the following model: Y ( I W)1
(15)
where ~ N 0,1 , I is the N N identity matrix, is a parameter of spatial dependence, and W is a connectivity matrix that determines the set of spatial relationships among points. The process, therefore, is based on the auto-normal model. Alternative models for the data generation process were considered (e.g., the autologistic) but the auto-normal provides the best alternative for controlling the frequency of each categorical value in the simulations. In the second step of the data generation process, the continuous spatially autocorrelated variable Y is used to define a discrete spatial process as follows. Let bij be defined by: p(Y bij )
i with i