Nov 14, 2017 - measures, and applications in frame of the Super-Resolution theory are presented. ..... the mean-squared error by RaoâBlackwell theorem.
arXiv: 1706.00679
Testing Gaussian Process with Applications to Super-Resolution Jean-Marc Azaïs• , Yohann De Castro?∗ and Stéphane Mourareau◦ •
Institut de Mathématiques de Toulouse Université Paul Sabatier, 118 route de Narbonne, 31062 Toulouse, France ?
Laboratoire de Mathématiques d’Orsay Univ. Paris-Sud, CNRS, Université Paris-Saclay, 91405 Orsay, France ∗
Équipe MOKAPLAN INRIA, 2 rue Simone Iff, 75012 Paris, France ◦
Laboratoire d’Analyse et de Mathématiques Appliquées Univ. Paris-Est, Champs sur Marne, 77454 Marne La Vallée, France Abstract: This article introduces exact testing procedures on the mean of a Gaussian process X derived from the outcomes of `1 -minimization over the space of complex valued measures. The process X can thought as the sum of two terms: first, the convolution between some kernel and a target atomic measure (mean of the process); second, a random perturbation by an additive (centered) Gaussian process. The first testing procedure considered is based on a dense sequence of grids on the index set of X and we establish that it converges (as the grid step tends to zero) to a randomized testing procedure: the decision of the test depends on the observation X and also on an independent random variable. The second testing procedure is based on the maxima and the Hessian of X in a grid-less manner. We show that both testing procedures can be performed when the variance is unknown (and the correlation function of X is known). These testing procedures can be used for the problem of deconvolution over the space of complex valued measures, and applications in frame of the Super-Resolution theory are presented. As a byproduct, numerical investigations may demonstrate that our grid-less method is more powerful (it detects sparse alternatives) than tests based on very thin grids. MSC 2010 subject classifications: Primary 62E15, 62F03, 60G15, 62H10, 62H15; secondary 60E05, 60G10, 62J05, 94A08. Keywords and phrases: Hypothesis Testing, Gaussian Process, Kac-Rice formula, Super-Resolution.
Preprint version of November 14, 2017
1. Introduction 1.1. Grid-less spike detection through the “continuous” LARS New testing procedures based on the outcomes of `1 minimization methods have attracted a lot of attention in the statistical community. Of particular interest is the so-called “Spacing test ”, that we referred to as S ST , based on the Least-Angle Regression Selection (LARS), that measures the significance of the addition of a new active variable along the LARS path, see [16, Chapter 6] for further details. Specifically, one is testing the relative distance between consecutive “knots ” of the LARS, for instance λ1,P and λ2,P . The first knot λ1,P is the maximal correlation between a response variable and P predictors. The second knot λ2,P is then the correlation between some residuals and P − 1 predictors, and so on. This approach is now well 1
Azaïs, De Castro and Mourareau/1
INTRODUCTION
2
referenced among the regularized methods of high-dimensional statistics and it can be linked to minimizing the `1 -norm over P coordinates, see for instance [16, Chapter 6]. In this paper, we focus on `1 -minimization over the space of signed measures and we ask for testing procedures based on these solutions. Indeed, in deconvolution problems over the space of measures [7]—e.g., Super-Resolution or line spectral estimation [8, 14, 12, 20, 11, 3]—one may observe a noisy version of a convolution of a target discrete measure by some known kernel and one may be willing to infer on the discrete measure. In this case, testing a particular measure is encompassed by testing the mean of some “correlation” process, see Section 5 for further details. In particular, remark that there is an uncountable number of predictors—while there were P predictors previously when inferring on vectors of RP —since we are looking at correlations between a response variable and vectors indexed by a continuum, say [0, 2π). For instance, assume that one observes some moments (or Fourier coefficients) of some discrete measure on the torus [0, 2π) and one is willing to infer on its support. A strategy would be to look at correlations between the response variable and the moment curve (1, t, t2 , . . . , tn ) (or (cos(kt) ± ı sin(kt))). In this framework, the LARS algorithm does not return a sequence of entries (among P possible coordinates) and phases as in high-dimensional statistics but rather a sequence of locations (among the continuum [0, 2π)) and phases. In this paper, we invoke the LARS to this framework—we referred to it as “continuous” LARS—for which an uncountable number of active variables may enter the model. We present this extension in Section 6 defining consecutive knots (λ1 , λ2 ). One can wonder: • Can the Spacing test be used in the frame of Super-Resolution? • Is there a grid-less procedure more powerful, in the sense of detecting spikes, than the Spacing tests constructed on thin grids?
thin grids LARS from the process X(·)
(
1,
2 , R) from the Hessian R and
S Rice
LARS from P grid points
X(·)
(
1,P ,
testing procedures
2,P ) from
(X(tp ))P p=1
S ST
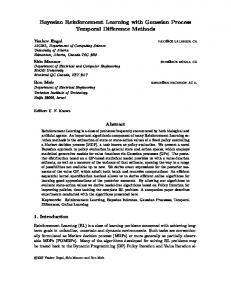
Figure 1. The grid-less approach uses the Hessian and the first two “knots” (λ1 , λ2 ) of the “continuous” LARS to build the test statistics Grid-less S Rice . We compare it to the grid approach Grid that approach builds a test statistics S ST using the approach P knots (λ1,P , λ2,P ) computed from a P points grid discretization (X(tp ))p=1 of the continuous process X.
Interestingly, as we will prove, the answer is no to the first question if no modifications of the test statistic is done. Furthermore, the way that the Spacing test can be fixed to be extended to a “grid-less” frame gives a new testing procedure S Rice that accounts for the distance between consecutive knots (λ1 , λ2 ) with respect to value of the Hessian at some maximal point, see Figure 1 for a global view on our approach.
3
1 INTRODUCTION 1.2. A comparative study
When the predictors are normalized, the Spacing test (ST) statistics is given by the expression S ST (λ1,P , λ2,P ) :=
Φ(λ1,P ) Φ(λ2,P )
where Φ = 1 − Φ is the Gaussian survival function and Φ the standard normal cumulative distribution function. In the framework of high-dimensional statistics, this statistics is exactly distributed w.r.t. a uniform law on [0, 1] under the global null, namely S ST can be considered as the observed significance [22, 4]. It is clear that one should not use this testing procedure in the Super-Resolution framework since there is no theoretical guarantees in this case. Yet the practitioner may be tempted to replace (λ1,P , λ2,P ) by (λ1 , λ2 ) given by the “continuous” LARS. Unfortunately, this paper shows that the resulting test statistics S ST is non conservative in this frame, i.e., it makes too many false rejections and one should avoid using it in practice, see the green line in Figure 2. 1
1
1
0.9
0.9
0.9
0.8
0.8
0.8
0.7
0.7
0.7
0.6
0.6
0.6
0.5
0.5
0.5
0.4
0.4
0.4
0.3
0.3
0.3
0.2
0.2
0.2
0.1
0.1
0.1
0
0 0
0.2
0.4
0.6
0.8
1
0 0
0.2
0.4
0.6
0.8
1
0
0.2
0.4
0.6
0.8
1
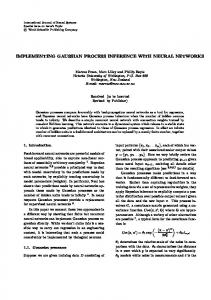
Figure 2. [Under the null] Comparison of the empirical cumulative distribution of the two statistics S Rice (blue line, see Theorem 6) and S ST (green line) under the null hypothesis when applied to the consecutive knots (λ1 , λ2 ) given by the “continuous” LARS in both cases. The diagonal (cdf of the uniform) is represented in dotted black line. The model is described by the Super-Resolution framework (see Section 5) with cutoff frequencies fc = 3, 5, 7 from left to right. The new test statistic S Rice is exactly distributed w.r.t. the uniform law on [0, 1] under the null hypothesis.
To overcome this disappointing feature, one may be willing to consider thinner and thinner grids and look at the limit as P tends to infinity. In this case, one can show that λ1,P tends to the λ1 of “continuous” LARS, but λ2,P does not converge to λ2 , it converges to λ2 as shown in (6). This results in a limit test that is a randomized version of the Spacing test that we referred to as S Grid and presented in Theorem 3. The second approach is to take a thin grid and to use S ST . This approach is perfectly valid, this test statistics follows a uniform distribution under the null and it should be compared to our new testing procedure S Rice . This numerical investigation has been performed in the frame of Super-Resolution and it is presented in Figure 3, more details can be found in Section 5.2. Figure 3 gives the cumulative distribution functions of the test statistics under “sparse” alternatives, i.e., when true spikes are to be detected. The larger the power, the better the test detects spikes (abscissa represents the level of the test and the ordinate the probability to detect the spike). In these sets of experiments, we can note that the testing procedure S Rice based on some Hessian and the whole process X(·) is uniformly better than the spacing test
Azaïs, De Castro and Mourareau/1
INTRODUCTION
4
even if one takes very thin grids. One can see that the power (the ability to detect sparse objects, Dirac masses here) of the grid methods seems to present a limit that is always improved by the continuous approach. 1
1
1
0.9
0.9
0.9
0.8
0.8
0.8
0.7
0.7
0.7
0.6
0.6
0.6
0.5
0.5
0.5
0.4
0.4
0.4
0.3
0.3
0.3
0.2
0.2
0.2
0.1
0.1
0.1
0
0 0
0.2
0.4
0.6
0.8
1
0
0
0.2
0.4
0.6
0.8
1
1
1
1
0.9
0.9
0.9
0.8
0.8
0.8
0.7
0.7
0.7
0.6
0.6
0.6
0.5
0.5
0.5
0.4
0.4
0.4
0.3
0.3
0.3
0.2
0.2
0.2
0.1
0.1
0.1
0
0 0
0.2
0.4
0.6
0.8
1
0
0.2
0.4
0.6
0.8
1
0
0.2
0.4
0.6
0.8
1
0 0
0.2
0.4
0.6
0.8
1
Figure 3. [Under the alternative] Empirical cumulative distribution under the alternative of the Rice test (blue) and the discrete grid tests with size 32 (green) , 102 (red), 322 (purple) and 502 (cyan) . The√alternative is defined by a single atom at a random location with a weight log(N ) = log(2fc + 1) (first row) or N (second row). In columns : fc = 3, 5, 7.
1.3. Toward a functional testing procedure In the seminal paper [21], the authors generalize the LARS test to regularized least squares problems with penalization P being a semi-norm over P coordinates but they do not cover the “continuum” framework under consideration here. On the technical side, their convex dual formulation leads to the study of a linear Gaussian process on which they invoke a Kac-Rice formula while our convex dual formulation involves a functional framework for which Kac-Rice formula cannot be applied. Furthermore, exact testing procedures in High-Dimensional statistics are based on PostSelection Inference techniques. In a nutshell, note that the sub-gradient of the `1 -norm is a vector with entries in [−1, 1] so that, in `1 -minimization, the selection event is described by the signs (sub-gradient entry value {±1}) and the active support (indices for which the sub-gradient is ±1) at the solution point through first order optimality conditions such as the Karun-Kush-Tucker conditions. Post-Selection Inference is then the ability to build a testing procedure that may depend on the aforementioned selection event. This approach might seem meaningless in the frame of Super-Resolution since the selection events have measure zero—given Gaussian responses and a finite subset S ⊂ [0, 2π), the probability that the output support of `1 minimization is exactly S is zero. Indeed, specifying the location
5
1 INTRODUCTION
and the phase of the supremum of a Gaussian process is an event with null measure. Remark also that there is an uncountable number of selection events—as many as the number of points in the index of the process. So the tools of Post-Selection Inference cannot be applied here and one need a new theoretical analysis of testing procedures based on the outcomes of `1 -minimisation over the space of signed measures. For the first time, this paper paves the way to build new testing procedures in the framework of Super-Resolution theory (and line spectral estimation). In particular, we prove that we can rightfully construct global null exact testing procedures on the first two knots λ1 and λ2 of the “continuous” LARS when one has a continuum of predictors, see Theorems 3 and 6 and Figure 2. These two new procedures offer the ability to test the mean of any stationary Gaussian process with known correlation function Γ and C 2 -paths. Furthermore, one of these tests is unbiased, see Theorem 3 and they can be both Studentized, see Theorems 4 and 8, when variance σ 2 is unknown. 1.4. Outline The outline of the paper is described by the following (short) table of contents: 2 Notations and problem formulation . . . . . . . . . . . . . . . . . . . 2.1 Hypothesis testing problem . . . . . . . . . . . . . . . . . . . . 2.2 The first and second knots of a Gaussian process . . . . . . . . 2.3 Estimating the variance . . . . . . . . . . . . . . . . . . . . . . 3 Passing to the limit, the grid approach . . . . . . . . . . . . . . . . . 4 The Rice method: a grid-less approach . . . . . . . . . . . . . . . . . 4.1 The known variance case . . . . . . . . . . . . . . . . . . . . . . 4.2 The unknown variance case . . . . . . . . . . . . . . . . . . . . 5 Applications to the Super-Resolution Theory . . . . . . . . . . . . . 5.1 Framework and results . . . . . . . . . . . . . . . . . . . . . . . 5.2 A numerical study . . . . . . . . . . . . . . . . . . . . . . . . . 6 LARS for complex-valued Gaussian processes . . . . . . . . . . . . . 6.1 Cameron-Martin type Assumption on the mean and Notations . 6.2 Description of the LARS . . . . . . . . . . . . . . . . . . . . . . 6.3 The second knot . . . . . . . . . . . . . . . . . . . . . . . . . . 6.4 Illustration: The two first knots of Super-Resolution . . . . . .
. . . . . . . . . . . . . . . .
. . . . . . . . . . . . . . . .
. . . . . . . . . . . . . . . .
. . . . . . . . . . . . . . . .
. . . . . . . . . . . . . . . .
. . . . . . . . . . . . . . . .
. . . . . . . . . . . . . . . .
. . . . . . . . . . . . . . . .
. . . . . . . . . . . . . . . .
5 5 6 7 11 12 12 15 17 17 19 21 21 22 25 25
Notations and the formal problem formulation is described in Section 2. In Section 3, we present the test statistic S Grid which is constructed taking the limit of consecutive LARS knots (λ1,P , λ2,P ) on thinner and thinner grids (namely the number of predictors P tends to infinity). Section 4 is the theoretical construction of our grid-less test based on consecutive knots (λ1 , λ2 ) of the “continuous” LARS. The main result concerning the test statistic S Rice is presented in this section. Applications to spike detection in Super-Resolution are developed in Section 5. The general construction of the “continuous” LARS is given in Section 6. An appendix with the proofs can be found at the end of the paper.
Azaïs, De Castro and Mourareau/2
NOTATIONS AND PROBLEM FORMULATION
6
2. Notations and problem formulation 2.1. Hypothesis testing problem In this paper, our purpose is to test the mean value of a stationary complex-valued Gaussian process Z with C 2 -paths indexed by [0, 2π). We assume that Z = A1 + ıA2 where A1 and A2 are two independent and identically distributed real-valued processes with C 2 -paths. Assume that the correlation function Γ of A1 (and A2 ) satisfies ∀t ∈ (0, 2π),
|Γ(t)| < 1
(Anorm )
and let σ 2 := Var(A1 (·)) so that Cov(A1 (s), A1 (t)) = σ 2 Γ(t − s) .
(1)
We denote by T := [0, 2π)2 the 2-dimensional torus. Assume that we observe a real-valued process (X(z))z∈T indexed by T such that � ∀z ∈ T, X(z) := A1 (t) cos θ + A2 (t) sin θ = Re e−ıθ Z(t) , where z = (t, θ) and Re(·) denotes the real part of a complex number. Remark that observing X is equivalent to observe Z since we can recover Z from X and conversely. Furthermore, we may assume that the process (X(z))z∈T satisfies a.s. there is no point z ∈ T s.t. X 0 (z) = 0 and det(X 00 (z)) = 0,
(Adegen )
where X 0 (z) and X 00 (z) denote the gradient and the Hessian of X at point z. Note that sufficient conditions for (Adegen ) are given by [5, Proposition 6.5] applied to (X(z))z∈T . In particular if the distribution of X 00 (t) is non degenerated, using [5, Condition (b) of Proposition 6.5], it implies that Assumption (Adegen ) is met. Note also that Assumption (Adegen ) is referred to as “Morse” process in [2]. Remark that (Anorm ) and (Adegen ) are mild assumptions ensuring that Z is a non-pathological process with C 2 -paths. This paper aims at testing the following hypotheses. H0 : “Z is centered ”
against H1 : “Z is not centered ” .
Subtracting the mean tested by the null hypothesis, remark that this framework encompasses any testing problem whose null hypothesis is a single hypothesis on the mean of Z. 2.2. The first and second knots of a Gaussian process As in high-dimensional statistics, we can define the first and second knots (λ1 , λ2 ) as follows. If we model some spatial correlation by means of the process X, the most correlated point zb ∈ T and the maximal correlation λ1 are respectively the argument maximum and the maximum of X defined by zb := arg max X(z) and λ1 := X(b z) . (2) z∈T
Under Assumption (Anorm ), one can check that the argument maximum is almost surely a singleton, see Proposition 16.
7
2 NOTATIONS AND PROBLEM FORMULATION
To construct the second knot, given a fixed z ∈ T, one can equivalently consider two regressions of X(y), as follows. • On the one hand, the regression on X(z) that will appear in the grid method of Section 3. Using a convenient normalisation related to the definition of the LARS knots, we set ∀y ∈ T \ {z},
X z (y) :=
where
X(y) − X(z)ρ(z − y) X(y) − X(z) = X(z) + , 1 − ρ(z − y) 1 − ρ(z − y)
∀z ∈ T,
ρ(z) := Γ(t) cos θ ,
is the correlation function of the stationary Gaussian process X. One can check that X z is a Gaussian process indexed by T \ {z} and independent of X(z). • On the other hand, the regression on (X(z), X 0 (z)) will be needed for convergence purposes in Section 4. With the convenient normalization, we set ∀y ∈ T \ {z},
X |z (y) :=
e −1 X 0 (z)i X(y) − ρ(z − y)X(z) + hρ0 (z − y), Λ . 1 − ρ(z − y)
e := −ρ00 (0) is the variance-covariance where ρ0 is the gradient of the correlation function ρ and Λ matrix of the derivative process of X, namely X 0 . Since the derivative at zb is zero, note that X zb(·) = X |bz (·) and we define the second knot λ2 as yb := arg max X zb(y) and λ2 := X zb(b y ) = X |bz (b y) ,
(3)
y∈T\{b z}
where we prove that (b y , λ2 ) are well defined and that yb is almost surely unique, see Proposition 16 and Remark 7. Furthermore, the couple (b y , λ2 ) can be equivalently defined using the extension of the LARS to our framework, the interested reader may consult Section 6.3. 2.3. Estimating the variance When the variance σ 2 is unknown in (1), we precise here the assumptions and the estimator we use to estimate the variance. In this section, except for explicit examples, we consider a real valued Gaussian process Y not necessarily stationary defined on the 2-dimensional torus T. Let m ≥ 2 (possibly infinite) and assume that Y admits an order m Karhunen-Loève expansion in the sense that Y =
m X i=1
ζi fi with Var(ζi ) = σ and ∀t ∈ T, 2
m X i=1
|fi (t)|2 = 1 ,
(KL(m))
where the equality holds in L2 (Ω) and (f1 , . . . , fm ) is a system of non-zero functions orthogonal on L2 (T). Through our analysis, we need to consider one of the following assumptions. • If m is finite, ∃(z1 , . . . , zm ) ∈ Tm pairwise distincts s.t. (Y (z1 ), . . . , Y (zm )) is non degenerated.
(ND(m))
Azaïs, De Castro and Mourareau/2
NOTATIONS AND PROBLEM FORMULATION
8
• If m = ∞, ∀p ∈ N? , ∃(z1 , . . . , zp ) ∈ Tp pairwise distincts s.t. (Y (z1 ), . . . , Y (zp )) is non degenerated.
( ND(∞))
Recall that a Gaussian vector is called non-degenerated if its variance-covariance matrix is non-degenerated, i.e., it has full rank. Some examples of process Y satisfying (KL(m)) and (ND(m)) with m = ∞ are given by the normalized Brownian motion and any Gaussian stationary process with a spectrum that admits an accumulation point, see [10, Page 203]. For instance, the process corresponding to the Super-Resolution problem satisfies (KL(m)) and (ND(m)) with m finite, namely m is twice the number of observed frequencies, see Section 5. Definition 1. Let Y be a Gaussian process with constant variance σ 2 = Var(Y (·)) and satisfying Assumptions (KL(m)) and (ND(m)) with m finite. The quantity m
2 σ bKL (Y
1 X 2 ) := ζi , m i=1
is called the Karhunen-Loève estimator of σ 2 . 2 Remark 1. An explicit expression of the estimator σ bKL is always possible from some set of 0 pairwise disjoint points z1 , . . . , zm0 with m > m. We only need to check that the variancecovariance matrix of the (Y (z1 ), . . . , Y (zm0 )) has rank m. 2 Remark 2. Sufficiency considerations imply that σ bKL is an optimal unbiased estimator for the mean-squared error by Rao–Blackwell theorem.
Given the aforementioned definition, we are now able to construct variance estimators for the process X. We assume that the complex Gaussian process Z that define X satisfies the following hypotheses for some N ∈ N. Z admits a complex Karhunen-Loève expansion of order N
(KLZ (N ))
and satisfies the following non-degeneracy conditions: ∀(t1 , . . . , tN ) ∈ [0, 2π)N pairwise distincts,
(Z(t1 ), Z(t2 ), . . . , Z(tN )) is non degenerated and
(NDZ (N ))
0
(Z(t1 ), Z (t1 ), Z(t3 ), . . . , Z(tN )) is non degenerated. Our aim is to build, for each z ∈ T, two estimators of the variance σ 2 independently from X(z) or (X(z), X 0 (z)). Indeed, in the following, we will distinguish two kind of statistics. The first one is the limit of the finite dimensional statistic S Grid , see Section 3. The second one is the case of the maximum over T, see Section 4. Both cases won’t use the same estimation of σ 2 . • In the grid situation, we define z Xnorm (y) :=
X(y) − ρ(z − y)X(z) p , 1 − ρ2 (z − y)
9
2 NOTATIONS AND PROBLEM FORMULATION
where y belongs to T\{z}, ρ(·) denotes the correlation function of the process X and set 2 z σ bz2 := σ bKL Xnorm (·)
�
which is well defined, independent of X(z) and with constant variance σ 2 . Furthermore, it follows a σ 2 χ2 (2N −1)/(2N −1) distribution where χ2 (2N −1) denotes the chi-square distribution with 2N − 1 degrees of freedom, see Proposition 2. Finally, we consider the variance estimator (4) σ b2 = σ bzb2 , defined at point zb given by (2). • In the continuous case, we define e −1 X 0 (z)i X(y) − ρ(z − y)X(z) + hρ0 (z − y), Λ |z Xnorm (y) := q , e −1 ρ0 (z − y)i 1 − ρ2 (z − y) − hρ0 (z − y), Λ where y belongs to T \ {z} and set 2 2 |z σ b|z := σ bKL Xnorm (·)
�
which is well defined, independent of (X(z), X 0 (z)) and with constant variance σ 2 . Furthermore, it follows a σ 2 χ2 (2N − 3)/(2N − 3), see Proposition 2. Finally, we consider the variance estimator 2 σ b|2 = σ b|b (5) z, defined at point zb given by (2). Proposition 2. Let Z satisfy (KLZ (N )) and (NDZ (N )) and set z ∈ T then the following claims are true. (a) σ bz2 is well defined and follows a (b)
2 σ b|z
is well defined and follows a
σ 2 χ2 (2N −1) 2N −1 σ 2 χ2 (2N −3) 2N −3
distribution. distribution. |z
z (·)/b σz is independent of σ bz , and the process Xnorm (·)/b σ|z is indepen(c) The process Xnorm dent of the random variable σ b|z .
Proof. (a) Fix z = (t1 , θ1 ) ∈ T. Since Z satisfies (NDZ (N )), there exists (t2 , . . . , tN ) ∈ [0, 2π)N −1 pairwise different such that (Z(t1 ), Z(t2 ), . . . , Z(tN )) is non degenerated. Then, considering z1 = z, zN +1 = z + (0, π/2) and ∀i ∈ {2, . . . , N }, zi = (ti , θ1 ) and zN +i = (ti , θ1 + π/2), the vector V1 := (X(z1 ), . . . , X(z2N )) satisfies 2N = rank(X(z1 ), X(z2 ), . . . , X(z2N )) z z = rank(X(z1 ), Xnorm (z2 ), . . . , Xnorm (z2N )) z z = 1 + rank(Xnorm (z2 ), . . . , Xnorm (z2N )) z where rank denotes the rank of the covariance matrix of a random vector. Deduce that Xnorm (·) satisfies (ND(2N − 1)). This, in turn, implies that the 2N functions
gi (·) = fi (·) − ρ(z − .)fi (z)
Azaïs, De Castro and Mourareau/2
NOTATIONS AND PROBLEM FORMULATION
10
are in fact in a space of dimension 2N − 1 and a Gram-Schmidt orthogonalization in L2 (T) z z z gives (KL(2N − 1)) for the process Xnorm (·). Finally, from (Xnorm (z2 ), . . . , Xnorm (z2N )), we compute σ bz2 that follows the desired distribution. (b) In the case of the regression over (X(z), X 0 (z)), remark that ∂θ X(z) = X(t1 , θ1 + π/2) = X(z2 ) and ∂t X(z) = Re(e−ıθ1 Z 0 (t1 )) where ∂θ (resp. ∂t ) denote the partial derivative with respect to θ (resp. t). Because of hypothesis (NDZ (N )), the two vectors V1 and V2 := (X(z1 ), X(z2 ), Re(e−ıθ1 Z 0 (t1 )), Im(e−ıθ1 Z 0 (t1 )), X(z5 ), . . . , X(z2N )) have rank 2N so both are invertible functions of (Re(ζ1 ), Im(ζ1 ), . . . , Re(ζN ), Im(ζN )). In particular, Im(e−ıθ1 Z 0 (t1 )) is a linear combination of V2 . Let γ1 and γ2 be the coefficients associated to X(z3 ) and X(z4 ). By triangular combination, we deduce that the distribution of (X(z1 ), ∂θ X(z1 ), ∂t X(z1 ), γ1 X(z3 ) + γ2 X(z4 ), X(z5 ), . . . , X(z2N )) is non-degenerated and so that (γ1 , γ2 ) 6= (0, 0). Setting ψ such that
γ1 γ2 cos(ψ) = p 2 and sin(ψ) = p 2 2 γ1 + γ2 γ1 + γ22
we get the non-degeneracy of (X(z1 ), ∂θ X(z1 ), ∂t X(z1 ), X(z2N +1 ), X(z5 ), . . . , X(z2N )) where z2N +1 = (t2 , θ1 + ψ). Finally, similarly to the proof of the previous point, regression, |z |z scaling and independence prove that the rank of (Xnorm (z5 ), . . . , Xnorm (z2N +1 )) is 2N − 3 so |z 2 is well defined and distributed that Xnorm (·) satisfies KL(2N −3) and ND(2N −3) and that σ b|z as
σ 2 χ2 (2N −3) . 2N −3
(c) This is a direct consequence of the independence of the angle and the norm for each |z z marginal Gaussian vector build from Xnorm or Xnorm . Remark 3. When the complex process Z admits an infinite Karhunen-Loève decomposition, we need the following modified hypothesis ∀p ∈ N? , ∀(t1 , . . . , tp ) ∈ [0, 2π)p pairwise distincts, (Z(t1 ), Z(t2 ), . . . , Z(tp )) is non degenerated and
(NDZ (∞))
0
(Z(t1 ), Z (t1 ), Z(t3 ), . . . , Z(tp )) is non degenerated. Indeed, for every enter p ≥ 1, note that from the observation of the vector (Z(t1 ), Z(t2 ), . . . , Z(tp )) (resp. (Z(t1 ), Z 0 (t1 ), . . . , Z(tp ))) for pairwise disjoint points t1 , . . . , tp , we can construct an es2 (resp. σ 2 ), of the variance σ 2 with distribution σ 2 χ2 (2p − 1)/(2p − 1) (resp. timator, say σ b2p b|2p σ 2 χ2 (2p−3)/(2p−3)). Making p tend to infinity, classical concentration inequalities and Borel2 (resp. σ 2 ) converges almost surely to σ 2 . Thus the variance σ 2 Cantelli lemma prove that σ b2p b|2p 2 ) this observation, is directly observable from the entire path of X. We still denote σ bz2 (resp. σ b|z where z = z1 = (t1 , θ1 ).
11
3 PASSING TO THE LIMIT, THE GRID APPROACH 3. Passing to the limit, the grid approach
The main idea of this section is to define a sequence of grids (Gn )n≥1 on T, to construct a sequence of test statistics (Sn )n≥1 from the values of the process X on Gn as in [4] and to pass to the limit as n → ∞. More precisely, we consider Gn to be the grid with mesh ∆n := (2π)2−n on T, zbn := arg max X(z) and λ1,n := max X(z) . z∈Gn
z∈Gn
It is the maximum of the process X when indexing by the grid. We can also define the maximum of the regression when indexing by the grid, namely λ2,n :=
max
y∈Gn \{b zn }
X zbn (y) .
The Hessian at the maximum (2) on T is denoted by X 00 := X 00 (b z ). By Assumption (Adegen ), it is a random variable with values in the set of non degenerated negative definite matrices of size 2 × 2. We can define a non degenerated positive quadratic form (i.e., a metric) on R2 by kvkX 00 = −v > X 00 v, for v ∈ R2 . Using this metric, we can consider the corresponding Voronoi tessellation of Z2 . It is a regular partition of R2 by parallelograms, invariant by translations (1, 0) and (0, 1). Denote by Vo ⊂ [−1, 1]2 the Voronoi cell of the origin in this partition and by U := U(Vo ) the uniform distribution on this cell. We understand the law U as a conditional law with respect to X 00 and, conditionally to X 00 , this law is taken independent of (λ1 , λ2 ), see Lemma 12. Conditionally to X 00 , define the randomized statistics ( ) � k − 2U � k> λ2 := λ2 ∨ λ1 + sup X 00 , (6) 1 e e 21 kk 2 2 k∈Z \{0} kΛ kk kΛ e 12 is the square root of Λ e = −ρ00 (0) and a ∨ b = max(a, b). A proof of the following where Λ result is given in Appendix A.1. Theorem 3. Under Assumptions (Anorm ) and (Adegen ), the randomized test statistics S Grid :=
Φ(λ1 /σ) ∼ U([0, 1]) , Φ(λ2 /σ)
where Φ denotes the standard Gaussian survival function. Moreover, the test with p-value S Grid is unbiased: under the alternative H1 , it holds P{S Grid 6 α} > α for all α ∈ (0, 1).
Theorem 3 shows in particular that the statistics—referred to as the Spacing test statistics in the introduction—given by Φ(λ1 /σ) (7) S ST = Φ(λ2 /σ) does not follows a U([0, 1]) distribution ans leads to a non-conservative test. Indeed, observe that almost surely λ2 ≤ λ2 so that S ST ≥ S Grid almost surely. Note that the two test statistics differ on the event {λ2 6= λ2 } = {λ2 < λ2 }. Now, when the variance σ 2 is unknown, we can build an estimator σ b2 defined in (4) and obtain a Studentized version of the previous theorem.
Azaïs, De Castro and Mourareau/4
THE RICE METHOD: A GRID-LESS APPROACH
12
Theorem 4. Assume (Anorm ), (Adegen ), (KLZ (N )) and (NDZ (N )) where 2 6 N < ∞, then the following test statistics T Grid satisfies T Grid :=
F m−1 (λ1 /b σ) � ∼ U([0, 1]) F m−1 λ2 /b σ
under the null hypothesis where m = 2N , Fm−1 is the Student cumulative distribution function b2 is defined by (4). with m − 1 degrees of freedom, F m−1 = 1 − Fm−1 its survival function and σ A proof can be found in Appendix A.2.
Remark 4. Only the first point of (NDZ (N )) is required for the proof. Moreover, if m = +∞, the Student distribution is to be replaced by a standard normal distribution. 4. The Rice method: a grid-less approach In this section, we build our test statistic directly on the entire path of the process X in a grid-less manner. We assume that the process X satisfies Assumptions (Anorm ) and (Adegen ), and is centered. As in the preceding section, we consider λ1 and λ2 defined by (2) and (3) respectively. e so that the covariance function of X e is the correlation function ρ of X, We denote X = σ X e is the standardized version of X. Note that, by regression formulas and stationarity, namely X it holds � � 00 e e 0 (z)) = −Λ e X(z) e e (z) (X(z), X , ∀z ∈ T, E X e by the decomposition so that we can define the process R e 00 (z) = −Λ e X(z) e e X + R(z) e e e = −ρ00 (0) is the variance-covariance where R(z) and X(z) are independent for any z ∈ T and Λ 0 e (t). In particular, observe that matrix of X e z ) + R(b X 00 (b z ) = −ΛX(b z) , e z ). Using the Rice method of [5, Theorem 7.2] (see also [18]), it follows that where R(b z ) = σ R(b the maximum λ1 has for density w.r.t the Lebesgue measure on R+ at point ` > 0 � � e (cst)(−1)d E det(−ΛX(0) + R(0))1A` X(0) = `, X 0 (0) = 0 σ −1 φ(σ −1 `), where φ denotes the standard Gaussian density, A` is the event {X(y) 6 `, ∀y ∈ T} and (cst), as in the following, denotes a positive constant. The numerical values (cst) may vary from an occurence to another and it may depend on m and σ which are assumed fixed in our framework. 4.1. The known variance case We begin by the known variance case. The main observation is that the method of [5, Theorem 7.2] can be extended to compute the joint distribution of (λ1 , λ2 , R(b z )) as follows. • Denote S the set of symmetric matrices and pick a Borel set B on D := R2 × S.
13
4 THE RICE METHOD: A GRID-LESS APPROACH • For every z ∈ T, recall that ∀y ∈ T \ {z},
X |z (y) :=
and define
e −1 X 0 (z)i X(y) − ρ(z − y)X(z) + hρ0 (z − y), Λ 1 − ρ(z − y)
∀z ∈ T,
λz2 :=
sup X |z (y) .
(8)
y∈T\{z}
Remark that, for fixed z ∈ T, λz2 is a.s. finite by Lemma 9, X |z (·) is independent of (X(z), X 0 (z)) and, by way of consequence, λz2 is independent of (X(z), X 0 (z)). Furthermore, note that since T is without boundary, for z = zb, one has X 0 (z) = 0 and λz2 = λ2 as defined by (3). • Observe that on the event {∀y 6= z, X(y) < X(z)} one has almost surely that z = zb, X(z) = λ1 , λz2 = λ2 and R(z) = R(b z ). Also, a simple computation shows that ∀z ∈ T s.t. X 0 (z) = 0,
1{z=bz } = 1{∀y6=z,
X(y)