Testing Reliability and Construct Validity of Inkind WTP Responses in Contingent Valuation Sonia Aktera*, Roy Brouwerb, Saria Chowdhuryc and Salina Azizd a. Crawford School of Economics and Government, The Australian National University, Canberra, ACT 2601, Australia, E-mail:
[email protected] b. Institute for Environmental Studies (IVM), Vrije Universiteit, The Netherlands. c. Department of Economics, BRAC University, Dhaka, Bangladesh. d. Department of Economics, North South University, Dhaka, Bangladesh. Abstract The aims of the study presented in this paper are to test the reliability and construct validity of inkind willingness to pay (WTP) responses obtained through a contingent valuation survey from a case study in Bangladesh. In a wide scale household survey in the north eastern wetland basin of Bangladesh, agricultural farmers, who refused to pay a risk premium in cash to buy a hypothetical flood insurance scheme due to income constraints, were asked to pay a premium in-kind. 23 per cent of the total sample agreed to buy flood insurance by paying the risk premium in the form of a proportion of their seasonal crop. Farmers’ stated WTP varies from two kg of rice crops per year per household to 150 kg with an average WTP 37 kg of rice crops per year which is 0.11 per cent the average yearly household crop production. Results of the estimated regression model demonstrate both reliability and construct validity of in-kind WTP responses. The study concludes that incorporating in-kind WTP in CV studies in semi-subsistence economies can yield reliable and valid estimates.
PREM Working Paper:
07/07
Keywords:
Contingent valuation, in-kind WTP, reliability, construct validity, crop, insurance, Bangladesh
Date:
December 2007
2
Akter et al.
Table of Content 1. Introduction 2. Reliability and Construct Validity of Contingent Valuation Responses 3. Description of the Survey 3.1. Case Study Area 3.2. Survey Set-up and Questionnaire Design 4. General Sample Characteristics 5. Results 5.1. Basic Willingness to Pay Results 5.2. Comparison of Monetary and Non-monetary WTP Values 5.3. Test of Validity of Stated in-kind Payment Amounts 6. Conclusion
Acknowledgements The work presented in this paper is part of the Poverty Reduction and Environmental Management (PREM) program in Bangladesh funded by the Dutch Ministry of Foreign Affairs. We gratefully acknowledge the heartiest cooperation of the following organizations at various stages of this research: Bangladesh Water Development Board (BWDB), Climate Change Cell (CCC) at Department of Environment (DOE), Flood Forecasting and Warning Center in Bangladesh (FFWC), Water Resource Planning Organization (WARPO) and Geographic Information System (GIS) cell in Local Government Engineering Department. We, furthermore, would like to thank Professor Jeff Bennett and Professor Quentin Grafton for their valuable comments on the paper.
Poverty Reduction and Environmental Management (PREM) PREM aims to deepen and broaden the exposure of economic researchers and policy advisors in developing countries to the theory and methods of natural resource management and environmental economics. It is envisaged that this will encourage effective policy change in developing countries with the joint goals of poverty reduction and sustainable environmental management. This Working Paper Series provides information about the scientific findings of the PREM projects. All publications of the PREM programme, such as working papers, press releases and policy briefs are available on the website: www.prem-online.org
Institute for Environmental Studies Vrije Universiteit De Boelelaan 1087 1081 HV AMSTERDAM The Netherlands Tel. +31 (0)20-5989 555 Fax. +31 (0)20-5989 553 E-mail:
[email protected]
In-kind WTP Responses in CV
3
1. Introduction Contingent valuation method (CVM) has been applied as an effective valuation technique in many developing countries to address a wide variety of issues such as water quality improvements and sanitation (Whittington et al. 1990, Aguilar & Sterner 1995, Griffin et al. 1995, Wasike & Hanley 1998), valuing forestry (Lynam, Campbell, & Vermeulen 1994, Shyamsundar & Kramer 1996, Mekonnen 2000, Köhlin 2001), flood risk exposure (Brouwer et al. 2006), wetland conservation (Emarton 1998) and groundwater contamination (Ahmad et al. 2004). One of the underlying assumptions of CVM is that people are willing and able to report a monetary valuation of their preferences for a given good or service. However, in semi-subsistence economy where people are less involved in market transactions and hence, are not used to paying in-cash for goods and services, application of CVM with monetary bid amounts may create a downward bias in estimated WTP by generating a high number of zero bidders. Cash payment based contingent valuation, as a result, may be an inappropriate valuation technique in underdeveloped semi subsistence rural economies. In view of the high number of zero bidders in CV studies in developing economies, the idea of ‘combined use of a monetary and non-monetary measure of WTP’ has gained significant attention in recent times. Evidence exists in CV literature where valuation exercises have been carried out based on completely non-monetary or a combination of both monetary and non-monetary payment options. Emarton (1988, p.11) used a tailored version of CVM called ‘Participatory Valuation’ technique in valuing wetlands in eastern Africa where respondents are asked to value environmental products in terms of other locally important products or categories. Shyamsundar & Kramer (1996) used rice crop based contingent valuation method to measure the utility loss of forest users as a result of a land use restriction in Africa. A couple of other studies (Mekonnen 2000, p.296, Maharana, Rai & Sharma 2000, 335, Köhlin 2001, p.252, Fonta & Ichoku 2005, p.119, Brouwer et al. 2006, p.9) have applied a combination of monetary and non-monetary payment options in CV studies. Some of these studies failed to provide strong evidence of in-kind payment preference by respondents (Mekonnen 2000, p.296) whereas others have achieved significant efficiency in estimating benefits accrued by the local community from environmental management and resource use (Maharana, Rai & Sharma 2000, 335, Köhlin 2001, p.252,). Some of these studies used in-kind payment options as a tool to identify strategic biases inherent to public good valuation (Fonta & Ichoku 2005, p.119, Brouwer et al. 2006, p.9). In the context of the increasing amount of practice in incorporating in-kind payment mode in the CV method, concerns have been growing over the reliability of such unconventional measures. For credibility and acceptability of valuation studies that are based on a combination of cash and in-kind WTP, it is necessary to examine whether or not inkind WTP values can be explained by economic theory. Although a number of CV studies have the combined in-kind WTP option as a payment mode to improve the efficiency of valuation exercise and/or to address the issue of strategic behaviour, such an explicit testing of reliability and construct validity of in-kind WTP is currently lacking. Hoping to fill in the knowledge gap in literature, the current study aims to test the reliability and construct validity of in-kind WTP responses collected from a semi-subsistence underdeveloped village in Bangladesh. In a large-scale household survey carried out at the end of 2006, 600 agricultural farmers in the Northeastern haor (wetland) basin of Bangladesh are asked for their preferences for a crop insurance scheme using double bounded contingent valuation (DB CV) method. Respondents who rejected monetary bid amounts because of limited financial
4
Akter et al.
income are subsequently asked in a follow-up question for their preferences to pay inkind by giving up part of their harvest. The study results show an overwhelmingly high positive response to an in-kind payment option. More than two thirds of the respondents who rejected the monetary bid amount offered in the form of DB CV format, agreed to a pay risk premium in-kind. Respondents who agreed to pay in-kind are furthermore asked to indicate their maximum WTP in-kind in the form of an open ended WTP question. A multivariate linear regression model is estimated to check the reliability and construct validity of in-kind WTP responses. The R2 value in the estimated regression model successfully obtains the prescribed threshold value of 0.15 (Mitchell & Carson 1989). Furthermore, the explanatory variables included in the regression model have theoretically expected signs although some of the regression coefficients values are not statistically significant. The remainder of this paper is organised as follows. Section two discusses the theoretical issues of ‘reliability’ and ‘construct validity’. The third section gives a description of the case study area followed by the methodology, including a description of the general survey and sample characteristics in Section four. Output from the regression analysis and other test results are presented in Section five followed by the conclusions and recommendations from the study in Section six.
2. Reliability and Construct Validity of Contingent Valuation Responses Contingent valuation (CV) method is one of the most popular survey-based non market valuation techniques. It is commonly used for estimating monetary values of environmental goods and services that are not bought and sold in the marketplace (Mitchell & Carson 1989, Arrow et al. 1993, Bateman et al. 1999). In a conventional CV survey, households are directly asked to estimate their WTP in monetary terms for a good or service in a hypothetical situation. Due to the hypothetical nature of the study, the method is prone to numerous different biases. As a result, testing accuracy of survey responses is an important component of CV analysis. Reliability and validity are two important criteria for testing the accuracy of CV responses (Smith 1993, Freeman 1993, Arrow et al. 1993). Reliability is an indicator that refers to how stable and reproducible the measure is. In other words, reliability of a CV survey can be explained in terms of consistency (Kealy et al. 1990) or the absence of contradiction in responses. Test of such reliability is often based on the magnitude of explanatory power of the regression model used in the study. CV responses are considered reliable if a higher proportion of the variation in stated WTP can be explained by the variation in theoretically expected explanatory variables. According to Mitchell & Carson (1989), the simplest way of testing reliability of WTP values is to obtain a respectable R2 value (R2>0.15) while regressing theoretically predicted independent variables against the response variable. Validity of CV responses can be defined in terms of the 'the degree to which the CVM evaluation correctly indicates the true value of the asset under investigation' (Bateman & Turner 1992, p.37).Validity can be of two different types: convergent validity and construct validity. Convergent validity generally refers to the stability of WTP values over time. A test of convergent validity generally requires repeated surveys over two different time period. Construct validity, on the other hand, is related with the extent to which economic theory explains empirical behaviour/choice. More specifically, construct validity refers to how well the signs and value of the explanatory variables fits in to the theoretical expectation on which the model is based. Regression results demonstrate strong evidence of construct validity if the coefficients of the explanatory variables have theo-
In-kind WTP Responses in CV
5
retically expected signs and statistically significant values (Mitchell & Carson 1989). Theoretically, household’s WTP for a reduction in risk exposure would depend on the realised level of risk, the individual’s disutility from risk exposure level and ability to pay (Brouwer et al. 2006). The realised level of risk is a function of exogenous risk and self-protection activities. The theoretical model of risk and WTP can be written in the following form: WTPi = f (Yi, Si, R(Xi, Pi))
(1)
Where, WTPi refers to the amount of money or goods a household is willing to pay for risk reduction/sharing, Yi denotes household income, Si stands for individual’s disutility from risk exposure, Ri is the risk exposure level which is determined through the exogenous risk factors (Xi) and the self-protection measure (Pi) if any. The statistical model of this study is based on the assumption that the theoretical construct of WTP for risk reduction remains the same whether elicited in monetary or nonmonetary terms. The current case study involves farmers’ preferences to buy flood (crop) insurance to avoid the possible flood (crop) damage risk in the future. Amounts of goods (in-kind WTP) farmers would agree to trade off to reduce (share) the crop damage risk as a result of flooding is expected to be explained by several factors. First, WTP to reduce crop damage risk is expected to vary with the flood risk exposure level of each farmer. Three different indicators are used in this study to measure exogenous risk exposure level: (i) distance of farm land from the main river, (ii) height of the farm land and (iii) flood return period. Second, WTP is expected to be explained by farmers’ levels of preparedness to cope with damage (implicit insurance scheme). Diversification of income sources is a well documented ex ante risk coping strategy in rural areas (Adger 1999, Brouwer et al. 2007). Hence, ‘sources of household income other than agricultural income’ is expected to determine in-kind risk premium in the current context. Our hypothesis is this that the higher the number of income sources other than agricultural income, lower is the risk exposure level (higher risk coping capacity) and therefore, lower would be the WTP for risk reduction. Furthermore, WTP is expected to be explained by the ability to pay. Conventional theory predicts that WTP is a positive function of household income. As a result of semisubsistence nature of farming in the current case study, monetary income clearly does not reflect farmers’ true ability to pay. Therefore, given the current context, it is more reasonable to expect that variation in WTP will be better explained by the amount of crop production than monetary income. Crop damage incurred due to flooding is an important indicator for disutility obtained from flood risk. Hence, WTP for flood risk reduction is expected to vary positively with farmers’ past experience of crop damage. Finally, the nature of farming is expected to play important role in determining WTP for flood risk reduction. As farm units in rural areas vary significantly in their degree of commercialization (level of subsistence), levels of risk aversion are expected to vary as well. As a general rule, the more commercial the nature of the farming, the greater will be the potential demand for insurance (FAO 2005). As farming becomes more commercialised, with greater levels of financial investment, farmers are expected to examine the feasibility of using a financial mechanism such as insurance, in order to spread the risk to their financial investment. Empirical data of crop insurance participation behaviour supports the theoretical proposition of positive relationship between degree of commercialization and insurance demand. According to a report of United States Department of Agriculture (USDA), about 30 percent of intermediate farms (farms with annual sales of less than $250,000) were insured in 2002 whereas almost 42 percent of commercial
6
Akter et al.
farms (those with a minimum of $250,000 in annual sales) participated in the same crop insurance programme (USDA 2005). Therefore, based on both the theoretical proposition and empirical evidence, we expect in-kind WTP for risk sharing in agricultural farming will be higher with higher degree of commercialization (lower degree of subsistence) in the farm unit. Although subsistence farming is frequently referred as non-marketed production which is consumed within the household (Todaro 1995), the percentage of the production that can be considered as sign of subsistence when used for self-consumption is arbitrary. Mosher (1970) defines subsistence farmers as those who sell less than 50 per cent of their production. However, in order to avoid any absolute benchmark for defining subsistence agricultural farming in our study, we create a variable ‘COMM’ which is continuous in nature. The variable ‘COMM’ refers to the ratio of crop sold in the market to total crop production by individual farm unit and therefore, reflects the degree of commercialization in each farm. The higher the value of ‘COMM’, the higher is the degree of commercialization and we expect the WTP for crop insurance to be higher. Hence, the statistical model that will be used for estimation purpose takes the following form: WTP= f (DISTANCE_R, HEIGHT, R_PERIOD, CROP_PROD, CROP_DAM, COMM, OTHER_INC)
(2)
where, (i) (ii) (iii) (iv) (v) (vi) (vii)
DISTANCE_R=Distance from the main river in km HEIGHT= Height of the farm land R_PERIOD=Return period of natural disaster (occurrence of flood event once in number of years) CROP_PROD= Total Amount of crop (in metric tonn) produced by the farmer in the previous year CROP_DAM= Total Amount of crop (in metric tonn) damage during the last disaster event. COMM=Degree of commercialization (ratio of crop sold in the market to total crop production) OTHER_INC=Sources of income other than agricultural income
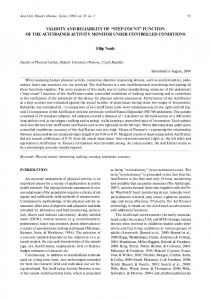
3. Description of the Survey 3.1 Case Study Area Data for the current study were collected from a sub-sample of a wider and extensive rural household survey looking generally at the potential for setting up a catastrophe insurance market in different natural calamity prone areas in Bangladesh. Study sites for the original study were selected based on information collected through a series of key informant interviews with the Director of Flood Forecasting and Warning Center in Bangladesh Water Development Board, officials at the Climate Change Cell in the Department of Environment, the Government of Bangladesh and policy planners in the Water Resource Planning Organization (WARPO). The case study area is located approximately 200 km away from the capital city Dhaka in the sub-districts named Mohanganj, Madan and Khaliajhuri of Netrokona district (Northeast zone of Bangladesh). For geographical location of the case study area see Figure 1 and for an area wise distribution of sample see Table 1.
In-kind WTP Responses in CV
7
The land area of the three sub-districts covered under the household survey is approximately 800 square kilometers with a total population of 2,22,829 (Population Census 2001). The area generally remains under one to five meters of deep flood water for six months (May to October) of the year (Rahman 1994). Major economic activity of this area is crop cultivation, mainly ‘Boro Crop’ (one of the moset widely used variety of rice crop which locally known as ‘Irri Crop’), during dry season (January-April). Fishery with limited scope is the only secondary occupation of some of the households. The study area is one of the most underdeveloped regions of the country in terms of road transport communication and other modern infrastructural facilities such as, electricity connection, number of safe drinking water options, medical and health services and access to micro-credit.
Geographical location of the case study area1..
Figure 1 Table 1
Distribution of sample across different districts with different disaster types.
District name
Sub-District name
Sample size
Netrokona
Mohanganj Madan Khaliajhuri
200 200 200
Moreover, the area is also characterised by extreme levels of poverty mainly due to the limited livelihood opportunities other than farming and the cyclical exposure to destruction caused by natural disasters. Crop damage in this region is caused mainly by flash floods during April/May that damage fully/partially standing Boro crop once in every three to five years. The Someshwari, the Kangsha, the Magra, the Dhanu, the Dhala, and 1
Source: Geographic Information Service (GIS) cell of Local Government Engineering Department (LGED) in Bangladesh, 2006.
8
Akter et al.
the Teorkhali are the main rivers of this region which originat from hilly parts of India. These rivers are subject to sudden and wide variation in water flow as a result of rainfall upstream. The area currently does not have any explicit or implicit mechanism for sharing or spreading the natural disaster risk.
3.2 Survey Set-up and Questionnaire Design Approximately 120 interviews were conducted in four villages in one union in each subdistrict. The selection of households in each of the villages followed a systematic random sampling method where every fifth household located along the right side of the main village road was interviewed. Only the head of the households were interviewed in this survey. The questionnaire used in this case study was developed based on focus group discussion and three pre-tests with approximately 40 individual household heads in different parts of the study area. The questionnaire design process commenced in June and was completed in August 2006. 600 household heads were interviewed during the final survey from the third week of August through to first week of October 2006 by three trained and experienced interviewers. The interviewers used for the general survey also participated in the pre-tests and were trained during a three day long training session. The questionnaire that was used for the final survey consisted of around 50 questions and was divided into three sections: 1) Socio-demographic respondent characteristics such as age, occupation, educational attainment, family members, sources of income, standard of living and so forth. 2) Type and extent of suffering from annual and incidental natural disaster (e.g. frequency of natural disaster, duration of disaster, inundation level, damage (type and extent), level of preparedness); 3) CV questions. Each interview lasted on average about 30 minutes. A double bounded dichotomous choice contingent valuation (DB-DC CV) format was used to elicit respondents’ WTP for a flood insurance. The ‘insurance product’ was offered to the respondents in the following form: I would now like to ask you a number of questions related to the possible introduction of a flood insurance scheme in this area. The principle of flood insurance is as follows: you pay a fixed amount of money for one year - an insurance premium - every week. But remember, you will be compensated due to Boro (irri) crop damage if and only if a flood occurs earlier than May 15th. If a flood occurs after May 15, the insurance company does not return you anything. If there is a flood before May 15, and you claim compensation for your Boro (irri) crop damage, a surveyor will come to assess the extent of crop damage. You will be given compensation by the insurance company based on the surveyor’s report. The terms and conditions of your insurance scheme are protected by law. After a detailed description of the hypothetical crop insurance scheme, respondents were asked three WTP questions. First, respondents were asked whether or not they were willing to participate in principle in the proposed crop insurance scheme to reduce the risk of crop damage due to natural disaster. Respondents who said ‘no’ to the first WTP question were subsequently asked for a reason for not buying flood insurance. Those respondents, who stated income constraints as a reason for not participating in the insurance scheme, were furthermore asked about their preference of paying in-kind and asked to indicate their maximum in-kind WTP in terms of crop. Part of respondents, who said ‘yes’ to the first WTP question (WTP in principle question), were followed up with the valuation question asking respondents for a weekly
In-kind WTP Responses in CV
9
premium ranging between Tk 5 (US$ 0.07)2 and Tk 50 (US$ 0.71). A total of six different start bids are used. The bid levels were assigned randomly across respondents to avoid starting point bias (Mitchell & Carson 1989). The weekly premiums were based on a previous large-scale CV survey carried out in March 2005 to test household WTP for a flood protection embankment in one of the study areas (for details see Brouwer et al. 2006) and thorough pre-testing in three pre-tests. The yes/no DC question was followed up by two closed-ended WTP questions, asking participants whether they would be willing to pay a higher or lower amount. Participants who refused to pay a bid amount were asked why they were not willing to pay. Respondents who refer limited cash income or limited financial resources as the main reason for not willing to pay the offered weekly premium were asked whether or not they were willing to pay in-kind. Respondents who agreed to pay in-kind were then asked to indicate their maximum WTP in-kind in openended format.
4. General Sample Characteristics A summary of socio-economic and demographic variables of sample respondents is presented in Table 2. Of the 600 respondents interviewed, the average household consisted of about six family members. The average age of the respondent was around 44 years. Half of the household heads interviewed during the survey are illiterate. Sample households are located in three kilometre distance from the main rivers of the region. Only half of the households has electricity connection in their dwelling. Water-sealed latrine is the most common type of sanitary facilities that respondents use. Tube-well is one of the most common sources of drinking water for sample households. Leafs and cow dung are the main sources of energy.
90 per cent of the sample households of this area are directly dependent on agricultural income for their livelihood. Farming in the study area is semi-subsistence in nature. Around two thirds of the sample farm units sell half of their total yield in the market (see Figure 2 for details). Around 20 per cent of the farming units are purely subsistence in nature as they retain 100 per cent of their total production for household consumption. Less than five per cent of the farms operate on a fully commercial basis. A majority of 55 per cent of the farmers own the farm land whereas the remainder of the farmers works on land either as tenants (share cropper) or as day laborers. Cash and in-kind payment system co-exist for land tenure. 25 per cent of the farmers pay in-kind by giving up one third of the total yield to the land owner. The average distance of the cropland from the main rivers is around two kilometers. Average size of the cropland is around two hectares and most of the lands are low lying (remains under six feet of water during the rain season). On average, each farmer produces around 12 metric tons of rice per year (during the dry season of each year). Almost all the respondents indicated that they suffer from crop damage due to flash flooding once every three years. The average crop damage farmers suffered due to the most recent flood (in the year 2004) was 11 metric ton Boro rice per household which is approximately 90 cent of the average crop production per household per year.
2
The exchange used here is 65 taka per US $.
10
Akter et al.
Table 2
Social, economic and farmland characteristics of the respondents.
Variable Household Number Head of the household (%) Respondent’s Sex (% of male) Respondents Age (in years) Average yearly income (US$) Occupational distribution: (%)
Sample average 600 100 100 44 480 90.3 2.4 3.4 3.9
Self Employed Farmer Service holder Agricultural Day labourer Others
Educational Qualification (%) Illiterate Primary school (Class 1-5) High School and Above
49.9 25.2 24.9 6.2 52.3
Twigs/leafs/straw/cow dung
98.8 68.1
Average family size (no of person) Electricity connection (%) Source of Fuel (%) Type of Latrine Used (use of sanitary latrine in %) Drinking water (tube well in %) Average size of farmland (in hectare) Average Production of Boro Paddy/hectare (in Metric Ton) Average Damage of Boro Paddy/hectare (in Metric Ton)
98.5 2.12 5.52 5.50
25
20
% of farmers
15
10
5
ov e an %
80
71
%
d
to
to % 61
ab
80
%
% 70
60 to % 51
41
%
to
to % 31
%
% 50
40
30 21
%
to
to % 11
%
%
% 20
% 10 to 1%
pu
re
ly
su
bs is te
nc e
0
% of total yield sold in the market
Figure 2
Degree of commercialization in agricultural farming.
In-kind WTP Responses in CV
11
5. Results 5.1 Basic WTP Results A summary of the WTP results is presented in Figure 3. A majority of respondents (87%) replied positively to the first WTP question (WTP in principle question). More than half (54%) of the 87 per cent respondents refused to pay the start bid amount. These respondents were then offered a lower bid in a follow-up WTP question. Around two thirds of those respondents who rejected the first bid, accepted the second (lower) bid value. On the other hand, respondents who accepted the first bid amount were offered a higher bid level in a follow-up WTP question. Around 70 per cent of the respondents who accepted the first bid level also accepted the higher bid level. Respondents who refused to pay the second bid value or both the monetary bid amounts were asked in a follow up question why they were not willing to pay. The most frequently reported reason for rejecting the monetary bid was ‘income constraint (82.2%)’ followed by reasons like ‘I did not like the terms and conditions of the proposed insurance scheme (10.3%)’, ‘I do not believe that I will actually be compensated for my damage (5%)’, and ‘I am unable to assess the usefulness of the proposed insurance scheme (2%)’. First WTP Question
Yes=86.7 %
No=13.3%
Second WTP Question
Yes=46.1
No=53.9%
Higher Bid
Yes=68.5
Willing to pay in-kind?
Yes=48.1
Lower Bid
No=31.5%
Yes=53.4
Financial Constraint (82.2%)
Willing to pay in-kind?
Yes=66.4
Figure 3 Summary WTP results.
No=33.6%
No=40.6%
No=51.9%
12
Akter et al.
Respondents who refused to pay due to income constraints were furthermore asked whether or not they would be willing to pay a risk premium in-kind by giving up part of their harvest. Half of the respondents who said ‘no’ to the first WTP question and around two third of the respondents who rejected monetary bid amounts for financial constraints indicated that they would pay risk premium in-kind. These groups of respondents were subsequently asked to indicate their maximum WTP in-kind in terms of a seasonal crop yield in an open ended question.
5.2 Comparison of Monetary and Non-monetary WTP Values The descriptive statistics of stated in-kind WTP is presented in Table 3. The stated WTP in the form of rice crops (the only agricultural crop of the region) varies from two kg rice crop per year per household to 150 kg rice crop per year with an average WTP of 37 kg rice crop per year which is 0.11 per cent of the average yearly household crop production. Table 4 compares the value of the average in-kind WTP with the in-cash single bounded3 (SB) and double bounded4 (DB) WTP estimates. The monetary value of the average estimated in-kind WTP equals to US$0.135. As expected, the monetary value of average in-kind WTP is substantially lower than the in-cash SB and DB WTP estimates. In-kind WTP is 40 per cent of the SB WTP and 30 per cent of the DB WTP estimate. The important point to observe here is the differences (or closeness) in standard error (SE) in different WTP estimates. Among the three different WTP estimates, the SB WTP estimate has the highest SE compared to SE of DB WTP and in-kind WTP. As a consequence of high SE, SB WTP estimate varies within a high confidence interval than DB WTP and in-kind WTP. Therefore, in-kind WTP performs better than SB estimate in terms of achieving lower SE. The monetary value of the stated in-kind WTP by each respondent is compared with the monetary bid they were offered in the bidding game in order to test the consistency of the responses. Figure 4 presents a comparison among monetary bids (both start bid and follow up bid) offered to the respondents and the market value of maximum in-kind WTP that the respondents offered. In 96 per cent of the cases, the market value of the stated in-kind WTP lies significantly below both the start bid and follow-up bid. The mean differences between start bid, last bid and maximum in-kind WTP turned out to be statistically significant in less than one per cent level (see Table 5 for details test result).
3
Logistic probability or logit model is used to estimate the SB WTP in the form (e.g. Langford & Bateman 1993):
Pr[ y i = 1 ] =
' eβ x ' 1 + eβ x
where Pr[yi=1] is the probability that a respondent says ‘yes’ to a specific bid amount. Beta (β) is a vector of variable parameters to be estimated, while x is the corresponding vector of explanatory variables. 4 Interval regression model (in Gauss) using the Maximum Likelihood (ML) method has been applied to estimate DB WTP (e.g. Hanemann et al., 1991, Alberini, 1995). Mean WTP values for DB CV responses are derived from a simple model where bid intervals are regressed on the starting bid (e.g. Hanemann & Kanninen, 1999), following the conventional procedures for binary WTP response data (Hanemann, 1984). Standard errors of the Turnbull WTP values are calculated based on bootstrap procedures (e.g. Efron and Tibshirani, 1993). 5 This value is obtained by multiplying the arithmetic average of stated in-kind WTP with the market price of rice crop. Market value of crop per mond (=appx 37 kg rice) was equivalent to Tk 400 (US$ 6.1) during the survey.
In-kind WTP Responses in CV Table 3
WTP (kg rice crop per year per household)
Table 4
Descriptive statistics of the household’s WTP in-kind (kg of rice crop per household per year). N
Minimum
Maximum
Mean
101
2.00
150.40
37.60
Trimmed mean 35.32
Std. Deviation 24.76
Average WTP results.
Mean WTP (US$/Week) Standard Error 95% Conf. Intervals N
Table 5
13
Single Bounded Model 0.33 0.10 0.28 - 0.51 516
Double Bounded Model 0.42 0.02 0.38 - 0.44 516
Monetary Value of in-kind WTP 0.13 0.08 0.11 - 0.14 139
Paired samples test results for mean difference between start bid-monetary value of WTP in-kind and last bid- monetary value of WTP in-kind. t value (2-tailed sig.)
Mean difference
SD
Start Bid (per week) and monetary value of WTP in-kind per week
31.60
11.31
24.51 (p