Dec 18, 2007 - of no cointegration that amounted to testing for a unit root in the estimated least ... For example when the cointegrating vector is known and the ...
Testing the null of no cointegration when covariates are known to have a unit root∗ Graham Elliott
Elena Pesavento
University of California, San Diego
Emory University
9500 Gilman Drive
1602 Fishburne Dr.
LA JOLLA, CA, 92093-0508
Atlanta, GA 30322
December 18, 2007
Abstract
1
Introduction
In their seminal paper Engle and Granger (1983) suggested tests for the null hypothesis of no cointegration that amounted to testing for a unit root in the estimated least squares cointegrating vector. Since this suggestion, a large number of tests have been considered for testing this null. When there are a large number of tests for a particular hypothesis, it is natural to consider which one should be employed in practice. Such considerations rest in large samples on power considerations and in smaller samples on size control and power. Such large sample power comparisons are thus interesting and have been made in the literature. Understanding which, if any, test is best is a first step, however power comparisons leave open the question of whether or not there exists some as yet unexamined test that is even better. This paper attempts to provide numerical bounds as to the maximal power of tests ∗
The authors
1
for the null of no cointegration when the cointegrating vector is not known. With these bounds we can examine both whether or not existing tests are close to the bounds (in which case it makes little sense to try and improve over existing tests on this metric) or in the case they are substantially below the upper bounds provide potential new tests that are closer to the theoretical bounds. That there is no obviously optimal test follows directly from the result that in special cases of the test no uniformly maximum power test exists across the set of alternatives. For example when the cointegrating vector is known and the covariates of the cointegration vector (in some rotation) are strictly exogenous, the optimal test for the null of a unit root in the (known) cointegrating vector collapses to the usual unit root test for a single variable, a problem that is studied in Elliott, Rothenberg and Stock (1996) and Mueller and Elliott (2003). Since no uniformly most powerful test exists for a submodel, it is no surprise that there does not exist such a test in general. Indeed, the case of an unknown cointegrating vector pulls us further from the situation where standard generalized likelihood ratio tests – that is likelihood ratio tests where the nuisance parameters are replaced by their maximum likelihood estimates – have any known optimality properties. Since under the null hypothesis there is no cointegrating vector, as all linear combinations of the data have unit roots, then we are faced with the problem of a nuisance parameter that is not identified under the null hypothesis. It is well understood in these situations (see Davies (1977,87), Hansen (1996), and Andrews and Ploberger (1984)) that standard tests do not in general have optimality properties. The following section examines the problem of testing for the null of no cointegration along with the notions of local power. Standard examinations for power are shown to depend on a nuisance parameter of the problem (this parameter describes the zero frequency correlation between variables) that is not estimable from the data. Hence whilst these power results are interesting, they present no clear picture as to which test statistic to employ for a particular situation. We set the problem up based on nuisance parameters that are estimable, motivating the model to be examined. In section 3 we take up the idea of deriving the optimal tests for the null of no cointegration. For general sets of deterministic terms we show the form of the optimal test against a particular mean reverting cointegrating vector when both the scale of the variables and
2
the cointegrating vector is known. We assume the scale is known as it will be consistently estimable in large samples. We assume a point alternative since no test will be uniformly most powerful over a range of values. We assume the cointegrating vector is known as a step towards the unknown cointegrating vector problem. With this test, optimal tests against the alternative of cointegration when the cointegrating power is unknown take the form of a weighted average test where the weights are over the possible cointegrating vectors. When one has some information as to the likely values of the cointegrating vector, this should be employed in the test. We take the view here that we have no information, and construct a test based on a uniform distribution for the vectors. The result is a test with an asymptotic distributin that is not dependent under the null on the actual cointegrating vector (so size is controlled) and surprisingly also not dependent on the correlation structure of the shocks driving the model (making the bounds and the tests that can be constructed from these results particuarly simple). The main point of the paper was to compare the bounds with currently popular test statistics. We do this in section 4. We show that existing popular tests do not achieve power bounds for moderate local alternatives, however the difference is not great. The tests that are relatively close to the power bounds are those that rely on the systems information (the tests of Johansen (1988) based on the MLE and the ECM-Wald tests, based on the error correction model). We find that the Engle and Granger (1983) test, which is based on the estimated cointegrating vector does not exploit system information, has power far below the power bound for the experiments examined.
2
Tests of no Cointegration and Local Power
We are interested in testing the null of no cointegration against the alternative of a single cointegrating vector when the cointegrating vector is unknown to the researcher. The researcher observes an (k + 1)-dimensional vector time series zt = (x0t , yt )0 generated by the model
xt = φ0x Dt + u1,t
(1)
yt = φ0c Dt + β 0 xt + u2,t
(2)
3
where Dt are deterministic terms and ⎛
F (L) ⎝
∆u1,t (1 − ρL) u2,t
⎞
⎠ = ε∗t ,
where yt is univariate, xt is of dimension k × 1, F (L) = Ik+1 −
(3) Pp
j=1
Fj Lj is a matrix
polynomial of finite (known) order p in the lag operator L, and the following assumptions hold. Condition 1 (assumptions on residuals) °¡ ¢0 ° ° 0 ° (i) max−p≤t≤0 ° u1,t , u2,t ° = Op (1) , where k·k is the Euclidean norm. (ii) |F (r)| = 0 has roots outside the unit circle.
∗ ∗ 4+δ (iii) Et−1 (ε∗t ) = 0 (a.s.), Et−1 (ε∗t ε∗0 < ∞ for some t ) = Σ (a.s.), and supt E kεt k
δ > 0, where Σ∗ is positive definite, and Et−1 (·) refers to the expectation conditional on © ∗ ª εt−1 , ε∗t−2 , ... . We are interested in the problem of testing H0 : ρ = 1
vs.
H1 : −1 < ρ < 1.
Under the maintained hypothesis, xt is vector integrated process whose elements are not mutually cointegrated. There is no cointegration between yt and xt under the null, whereas yt and xt are cointegrated under the alternative because yt − β 0 xt = φ0c Dt + u2,t mean reverts to its deterministic component when −1 < ρ < 1. Assumptions (i)-(iii) are fairly standard and are the same as (A1)-(A3) of Elliott and Jansson (2003) apart from additional moment restrictions. Assumption 1 ensures that the initial values are asymptotically negligible, Assumption 2 is a stationarity condition, and Assumption 3 implies that {ε∗t } satisfies a functional central limit theorem (e.g. Phillips and Solo (1992)). There exist many tests for this null and alternative in the literature. In their seminal paper introducing cointegration, Engle and Granger (1987) suggest tests based on least squares residuals from a regression of yt on deterministic terms and the xt variables. Phillips and 4
Ouliaris (1990) derived the asymptotic distributions for these tests. Banerjee et al. (1986) ,Kremers et al (1992), Boswijk’s (1994), and Zivot (2000) looked at tests for no cointegration in single equation conditional error correction models. Finally, one of Johansen’s tests, the maximum eigenvalue test (Johansen and Juselius, 1990) can be used to test this hypothesis. In the context of the above model, local power functions have been considered. Kremers et al (1992), Zivot (2000), Banerjee et al. (1986) computed the local power of the error corrections test when β is prespecified, while Johansen (2005) derived the local power for rank tests. Using model (1) ,Pesavento (2004), and Pesavento (2006) derived and compared, the local power functions of all the tests for the null of no cointegration when β is unknown. One reason for the plethora of tests is that the typical generalized likelihood ratio test – likelihood ratio tests that are evaluated with nuisance parameters replaced by their MLE’s – is neither locally asymptotically normal nor is it optimal. The lack of normality means that the usual Wald tradeoffs in terms of directions for power may not be particularly interesting. The lack of optimality arises both because of the curvature of the model as well as the problem that the cointegrating vector is a set of unidentified parameters under the null hypothesis. Power curves derived from the above model have the nice property that they do not depend on the unknown values for the cointegrating vector. Hence choice between methods and in assessing which method to employ the researcher does not need to consider the effect the particular value the cointegrating vector takes for their problem. However, both power and the relative rankings of the test – and hence the choice of method – do rely on the correlation between u1,t and u2,t . This is a problem because in practice this parameter is not only unknown but under the null and local alternative this parameter is not consistently estimable. Hence the researcher can look at the curves for various values for the zero frequency correlation but they will have no idea which of these curves is appropriate for any particular application. A solution to this could be to take a weighted average of power over various values for the long run correlation, with weights related to the types of models the researcher expects to encounter in practice. Whilst this is a reasonable solution, the path that we take here will be to transform the model into its error correction representation, and consider the zero frequency correlation matrix in that representation fixed. This avoids the problem of
5
producing results that rely on an unknowable nuisance parameter, since in this rotation we can estimate the correlation consistently. Ignoring deterministic terms for the sake of exposition, a general error correction model (ECM) representation for the data is h i 0 A˜ (L) Ik+1 (1 − L) − αβ¯ L zt = εt , ⎛
(4)
⎞
Im 0 0 ⎠ . In this rotation, it is possible where β¯ = (1, −β 0 ) and εt = P −1 ε∗t where P = ⎝ −β 1 −1 ˜ −10 . This means that power com˜ ΣA(1) to consistently estimate the spectral density A(1) parisons based on these nuisance parameters are directly useful for an implication of which method to employ. In the following section we will develop methods based on fixing this spectral density. Regardless of the particular rotation of the model chosen, under the null hypothesis both of these equivalent models have the property that they are vector autoregressions in the differenced data (∆x0t , ∆yt ) and the models do not depend on β. Hence the cointegrating vector is an unidentified nuisance parameter under the null hypothesis. This problem commonly arises when the model is written where unknown parameters appear as products (such as a0 β¯ in the ECM model). In situations where this problem arises it is still possible to use standard statistical optimality results based on the Neyman Pearson lemma, however for maximising power against a weighted average over the unindentified nuisance parameter. Essentially what can be constructed is a test statistic that maximises power against a random alternative where the randomness in the nuisance parameter is exactly that chosen to construct the test statistic. The weighting, to the extent that it affects power, should thus be chosen to reflect the types of cointegrating vectors that the researcher expects to see. Choosing the weighting would be moot if the power of the tests did not depend on the particular cointegrating vector, however such a dependence arises neccessarily given the results mentioned above. There power having fixed Σ∗ does not depend on the cointegrating vector β. However since we fix Σ = P −1 Σ∗ P −10 where P is a function of β, then it will mean that power will depend on the cointegrating vector β.
6
So in order to construct tests, we will take the approach of computing tests that are weighted average optimal for a chosen weighting over the possible values for the cointegrating vector. Since power does depend on β then it is likely that the weighting will matter for power performance. Understanding the extent of this dependence is one of the goals of the paper. A number of weightings are possible, although as we show below the simplest test statistic arises with an even weighting across the cointegrating vectors. An additional dimension for consideration in constructing tests aimed at generating good power is the direction in which power is to be maximised. This is a problematic issue in all but the simplest of testing problems, since gaining power in one direction often comes at the expense of power in an alternative direction. In considering cointegrating models that are local to no cointegration, an issue that arises is the behavior of xt under the local alternative. Compare the ECM form of the model to the (4) form. The two representations ˜ are equivalent when we set εt = P −1 ε∗t , A(L) = P −1 A (L) P and we have α = (0, (ρ − 1))0 . Thus the models are equivalent with the restriction that the cointegrating vector does not enter the first k equations. This restriction is precisely the restriction that xt are constrained to be I(1) under the null and alternative – this is the known information that the testing procedures developed here are intended to exploit (see Elliott et. al. (2005) for a detailed discussion). Essentially what happens is that if this restriction does not hold then under the local alternative the nearly integrated cointegrating term is part of the shock to the change in xt , hence the change in xt would have a local to I(1) component. Here we assume that xt is I(1) in the sense that the weak limit of T −1/2 x[T ·] is a Brownian motion under the null and local alternatives of the form ρ = 1 − T −1 γ, where γ is a fixed constant. >From the perspective of comparing power curves, local power will differ when one includes this assumption or not. We are not aware of any analytical work examining local power without this assumption, although often this assumption is left implicit.
3
Tests for the null of no Cointegration
In this section we derive point optimal tests that maximise weighted average power for various weightings on the unknown cointegrating vector β. The tests that we derive have optimality properties for normal errors in the model where we have no serial correlation (F (L) = I) at the point alternative chosen. This family of optimal tests can be used to trace 7
out an approximate power envelope for tests of the null of no cointegration with the stated weights on potential cointegrating vectors. This enables the numerical examination of how well various tests perform in terms of power relative to what is possible. We then construct tests that have the same asymptotic power properties as these point optimal tests under the usual milder conditions on the error process and dependence structure.
3.1
Derivation of the family of tests.
Consider the model (4) with the deterministic terms included, and having set F (L) = I. Define y = (y1 , ..., yT )0 , x = (x1 , ...xT )0 , ui = (ui,1 , ..., ui,T )0 for i = 1, 2 and D = (D1 , ..., DT )0 .The model can be written in matrix notation as ⎞ ⎛ ⎞ ⎛ ⎞ ⎛ ⎞ ⎛ ⊗ D)vec(α ) ) vec(x) vec(u vec(x) (I x 1 ⎠+⎝ ⎠=u ⎠=⎝ ⎠=⎝ k P˜ ⎝ Dαc u2 y y − xβ where
and we define
⎛ ⎝
Ik ⊗ A(1)
0
0
A(ρ) ⎛
1
0
⎞
˜ = ε∗ . ⎠ u = Au 0
⎜ ⎜ −r 1 0 ⎜ ⎜ ... ... A(r) = ⎜ ⎜ 0 −r ⎜ ... ... ... ⎜ 0 ⎝ 0 0 −r 1
(5)
(6)
⎞ ⎟ ⎟ ⎟ ⎟ ⎟ ⎟ ⎟ ⎟ ⎠
˜ for any scalar r and P˜ = P ⊗ IT . Then P˜ −1 Au = P˜ −1 ε∗ = ε where we assume ε ∼ N(0, Σ) ˜ = Σ ⊗ IT . Here Σ is a general (k + 1) × (k + 1) variance covariance matrix (the with Σ contemporaneous covariance matrix between the residuals). We will parition this matrix after the kth row and column, writing the elements of the partitioned matrix as Σij for ˜−1 ˜ blocks i, j = 1, 2. Define Σ2.1 = Σ22 − Σ012 Σ−1 11 Σ12 . It follows that u = A P ε and hence ˜ P˜ 0 A˜−10 ). u ∼ N(0, A˜−1 P˜ Σ
Since we observe (vec(x)0 , y 0 ) and not u we impose invariance to translations of the form (vec(x)0 , y 0 ) 7→ (vec(x)0 + vec(ax )0 (Ik ⊗ D0 ), y 0 + a0c D0 ) 8
(7)
for any real conformable ax , ac . We have ⎛ ⎞ ⎛ ⎞ (I ⊗ D)vec(φx ) vec(x) ⎠ + P˜ −1 u. ⎝ ⎠ = P˜ −1 ⎝ k Dφc y
˜ = Ik+1 ⊗ M. Then Define M = IT − D0 (D0 D)−1 D0 and M ⎛ ⎞ vec(x) ˜⎝ ˜ P˜ −1 u ⎠ = M M y
˜ P˜ −1 A˜−1 P˜ ε. = M
The Likelihood function invariant to the above translations is then proportional to ⎛ ⎞⎤ ⎡ ³ ´ ³ ´ − vec(x) 1 ˜ M ˜ P˜ −1 A˜−1 P˜ Σ ˜ P˜ 0 A˜−1 P˜ −10 M ˜ ˜⎝ ⎠⎦ . M exp ⎣− vec(x)0 y 0 M 2 y
This likelihood function depends on the cointegrating vector β through the dependence ˜ on P˜ and the value for ρ through A. In order to construct a feasible test, an issue that arises is the lack of uniformity of the test statistic with respect to the size of the departure of the cointegrating relation from a unit root. It is well understood by now that in testing for a unit root (see Elliott et. al. (1996)) that no uniformly most powerful test for the null of a unit root exists, even asymptotically. This result directly implies the lack of uniformity here too, since a special case of a known cointegrating vector and Σ12 =0 makes the test based on a known
cointegrating vector equivalent to the models in that paper. We follow the suggestion of King (1980) as employed in Elliott et. al. (1996) and construct a point optimal test. This enables both the construction of a feasible test as well as the evaluation of maximal power of a classical test since the tests have optimality properties at the chosen alternative. Theorem 1 For the model in (5) and (6) the optimal test for the hypothesis H0 : ρ = 0 versus H1 : ρ = ρ¯ where εt ∼ N(0, Σ) (with known β, Σ) invariant to translations (7) rejects for large values of the statistic ⎡ ⎛ ⎢ 1⎜ ⎢ ⎜ LRT (β) = exp ⎢− ⎜ ⎣ 2⎝
¢ ¡ Σ−1 ¯)2 c0−1 Mc−1 + 2(1 − ρ¯)c0−1 MA(1)M y˜ 2.1 (1 − ρ ⎛ ⎞ ³ ´ ˜ M ˜ ⎝ vec(x) ⎠ − vec(x)0 y 0 MG y 9
⎞⎤ ⎟⎥ ⎟⎥ ⎟⎥ ⎠⎦
(8)
where y˜ = y − xΣ−1 11 Σ12 , c−1 = y−1 − x−1 β,
³ ´−1 0 0 ˜ −1 ˜ ˜ ˜ ˜ ρ)Σ ˜ −1 K(¯ρ) G = K(¯ρ) Σ K(¯ρ)D D K(¯ρ) Σ K(¯ρ)D DK(¯ ³ ´−1 0 ˜ −1 0 0 ˜ −1 ˜ ˜ ˜ −1 K(1), ˜ ˜ DK(1) Σ −K(1) Σ K(1)D D K(1) Σ K(1)D 0 ˜ −1
˜ = Ik+1 ⊗ D. K(r) = P˜ −1 A˜P˜ which is a function of r through A˜ and D
This result gives the optimal test under normality as a function of the known cointegrating vector β and the variance covariance matrix of the residuals. We now turn to the issue of the unknown cointegrating vector β, a nuisance parameter that arises under the alternative only, by contructing a test that has weighted average power over some weights on β. To keep the difference between the true cointegrating vector, β, and the hypothesized ones let the hypothesized cointegrating vector be b, and define ˜b = −1/2 1/2 Σ2.1 Σ11 b. We will average over models for different normalized cointegrating vectors ˜b
with some weighting function on this parameter vector. The test statistic is then Z CT (v˜b ) = 2 ln LRT (˜b)dv˜b . We have a choice of measures for the integration, each of which will result in tests which have optimal power in the experiment that ˜b has against that distribution. Different choices for measures on β˜ will yield different tests with different power properties. The chief difficulty in constructing closed form statistics in the family CT (v˜b ) is that the statistic of Theorem 1 is a complicated function of the cointegrating vector b, and hence this complicates the integration over this parameter vector. However it turns out that for the case with no deterministic terms then G = 0 and the test of Theorem 1 is quadratic in b, hence a normal weighting or a constant weighting (the limit of a normal weighting when the variance of the weights is allowed to become large) provide closed form tests. In the case of a constant in the model – D = ι where ι is a T x1 vector of ones – then this remains asymptotically true. Denote the case of constant weights as CT (˜b). This is a reasonable choice in the absence of any information as to the likely values for the cointegrating vector. If we integrate over ˜b with a flat prior and use a fixed alternative for the largest root of the dynamics for the cointegrating vector, then ignoring terms that are small asymptotically we can obtain a
10
closed form solution for the test. Set the fixed alternative ρ¯ = 1 − T −1 g¯ with g¯ fixed. The statistic that arises from this weighting is ¢ ¡ 2 −2 0 0 g) = −Σ−1 g T −1 y−1 MA(1)M y˜ ¯ T y−1 My−1 + 2¯ CT (¯ 2.1 g ³ ´0 ³ ´−1 −1/2 −1/2 −1/20 −2 0 −1/2 −2 0 −1 0 g ¯ T Σ y Mx Σ + T y ˜ MA(1)Mx Σ T x Mx Σ +Σ−1 −1 11 −1 11 −1 11 11 2.1 −1 −1 ³ ´ −1/2 −1/2 0 ∗ g¯T −2 y−1 Mx−1 Σ11 + T −1 y˜0 MA(1)Mx−1 Σ11 ³ ³ ´´ −1/20 −1/2 − log det g¯2 Σ11 T −2 x0−1 Mx−1 Σ11
0 −1 where, ye = yt − xt Σ−1 11 Σ12 , and M = I for the no deterministic case and M = IT − ι(ι ι) ι
for the case where D = ι. The test statistics CT (¯ g) are a family of test statistics (indexed
by the choice of the local alternative g¯) that provide tests for the null of no cointegration against the alternative that there exists a cointegrating vector where the cointegrating vector is unknown. The following result establishes the distribution of the test under the null and local alternative for any chosen true cointegrating vector. The limit distributions for these tests can be derived. Theorem 2 (limiting properties of CT (¯ g)). Under Condition 1 then for γ = T (1 − ρ) fixed 1/2 −1/2 as T → ∞ then when the true cointegrating vector is β = Σ2.1 Σ11 β˜ then Z Z Z ¡ d ¢2 2 2 0 d d0 ˜ 2 ˜0 ˜ ˜ ˜ g) ⇒ −(¯ g − 2¯ gγ) W2γ − (¯ g − 2¯ gγ)(β − R) CT (¯ W1γ W1γ (β − R) − g¯ β W1d W1d0 β˜ Z Z ¡ 2 ¢ 0 d d 2 0 d ˜ ˜ ˜ ˜ +2 g¯ − g¯γ (β − R) g − g¯γ)(β − R) W1d0 β˜ W1γ W2γ + 2(¯ W1γ Z Z Z Z 0 0 2 d d d 0 d ˜ −2(¯ g − g¯γ)β˜ g W2γ dW2 + 2¯ g(β˜ − R) g β˜ W1 W2γ − 2¯ W1γ dW2 − 2¯ W1d dW2 ⎛ ³R ´ ⎞ R d d0 0R µZ ¶−1 d d0 0 d d0 ˜ ˜ ˜ g¯ W2γ W1 − (β − R) W1γ W1 + β W1 W1 + d d0 ⎠ ⎝ + W1 W1 R R R d d0 ˜ 0 W1γ W10 dW2d W1d0 − γ W2γ W1 + γ(β˜ − R) ⎛ ³R ´ ⎞0 R d d0 0R d0 0 d d0 ˜ ˜ ˜ g¯ W2γ W1 − (β − R) W1γ W1 + β W1 W1 + ⎠ •⎝ R R R d d0 d0 0 0 ˜ ˜ dW2 W1 − γ W2γ W1 + γ(β − R) W1γ W1 ¶¶ µ µ Z 2 d d0 . − log det g¯ W1 W1 −1/2 ˜ = Σ−1/2 where R 11 Σ12 Σ2.1 , W1 (λ) and W2 (λ) are kx1 and 1x1 standard Brownian motion Rλ processes respectively, Wiγ (λ) = −γ 0 e−γ(λ−r) Wi (r)dr + Wi (λ) for i = 1, 2, and Wiγd (λ) = R Wiγ (λ) for the no deterministic case and Wiγd (λ) = Wiγ (λ) − Wiγ (r)dr for the case where
D = ι.
11
Under the local alternative, for a fixed (normalized) cointegrating vector β˜ the limit distributions depend on the choice of the fixed alternative g¯, and the alternative model −1/2 −1/2 −1/2 ˜ R ˜ and γ. Here R ˜ = Σ−1/2 values for β, = δ(1 − δ 0 δ)−1/2 where δ = Σ11 Σ12 Σ22 , 11 Σ12 Σ2.1 which is the vector of correlations between ε1t and ε2t . Since, as noted in the previous section, this parameter is consistently estimable under the null and local alternative (and so will its analog in more general settings), then a researcher can compute this number to access the relevant power function. The dependence of the power function on β˜ was also suggested in the previous section. The null distribution is given when γ = 0, in which case the distribution simplifies and ˜ and thus is independent of all nuisance parameters. The ˜ or β, no longer depends on either R null distribution is given by µZ ¶−1 Z Z Z Z 2 d 2 d 2 d d0 d d0 CT (¯ W1 W1 g) ⇒ −¯ g g W2 dW2 + g¯ (9) (W2 ) − 2¯ W2 W1 W1d W2d µZ ¶−1 Z µZ ¶−1 Z Z Z d0 d d0 d d d0 d d0 + dW2 W1 W1 W1 W1 W1 g W2 W1 W1 dW2 + 2¯ W1d dW2 ¶¶ µ µ Z 2 d d0 W1 W1 . − log det g¯
The distribution does however depend on the altenative g¯ chosen along with the dimension of xt . ˜ Since the The test CT (¯ g ) is obtained by integrating the first two terms of (8) across β.
third term is zero for the case where D = 0 and asymptotically negligible when D = ι then this is asymptotically equivalent to the optimal test under the null and local alternative hypotheses. Theorem 3 (constant weights on ˜b) For the testing problem of Theorem 1 when ρ¯ = 1 + T −1 g¯, then under Condition 1 then for the cases where D = 0 and D = ι then the family ˜ under the null of tests CT (¯ g) are asymptotically equivalent to the family of tests CT (β) hypothesis and local alternative. This result shows that the tests are, at each point of the local alternative g¯, optimal for the testing problem considered here. The tests can be used to trace out maximal power against models where β˜ is drawn from the uniform distribution. ˜ howSimilar results can be obtained using a normal weighting on the distribution for β, ˜ ever in this case the null distribution depends on the nuisance parameter R. 12
3.2
Tests under more general assumptions.
The assumption of normality, neccessary for writing the likelihood, affects the form of the statistic. In this section we show that the optimal power under normality and no serial correlation can be acheived with CT (¯ g ) asymptotically under a much wider range of assumptions on the distribution of the errors (including allowing serial correlation). For a researcher that knows the distribution of the errors when it is not normal could construct a test statistic that is potentially more powerful than that of the previous section. When such a distribution is unknown, potential gains may still exist, as examined by Rothenberg and Stock (1993) and Jansson (2007) in the univariate unit root test problem. However such gains will likely come at the expense of robustness, as shown by Mueller (2007). We will remove the assumption of a known Σ by employing consistent estimates of the scale parameters, which for a wide set of assumptions will not affect asymptotic power of the resulting statistic. When the errors satisfy condition 1, we replace εt in the previous subsection with vt = ´³ ´0 ³ P P F (L)εt . We are able to consistently estimate both Ω = limT →∞ E[ T −1/2 Tt=1 vt T −1/2 Tt=1 vt ] P P 0 and Λ = limT →∞ T −1 Tt=2 t−1 j=1 E[vj vt ] under the null and local alternative from the resid-
uals of the first order vector autoregression using (x0t , yt )0 . A sums of covariances estimator ˆ is convenient. Denote the consistent estimator Ω.
ˆ −1 ˆ For the construction of the statistic, we redefine y˜ = y − xΩ 11 Ω12 , and replace scaling
matrices by their zero frequency counterparts. Also, partition both Ω and Λ after the kth
row and column and define Λ12 and Λ22 accordingly (these matrices allow corrections similar to the form of Hansen and Phillips (1989)). The statistic is now. ³ ´ 2 −2 0 −1 0 ˆ g) = g T y−1 MA(1)˜ y − Λ22 g¯ T y−1 My−1 + 2¯ CT (¯ ³ ´0 ³ ´−1 −1/2 −1/2 −1/20 −2 0 −1/2 −1 −2 0 −1 0 0 ˆ Ω11 T x−1 Mx−1 Ω11 +Ω2.1 g¯T y−1 Mx−1 Σ11 + T y˜ A(1)Mx−1 Ω11 − Λ12 ´ ³ −1/2 −1/2 0 ˆ 012 ∗ g¯T −2 y−1 Mx−1 Ω11 + T −1 y˜0 A(1)Mx−1 Ω11 − Λ ³ ³ ´´ −1/20 −1/2 − log det g¯2 Ω11 T −2 x0−1 Mx−1 Ω11 . −Ω−1 2.1
When Condition 1 holds then under the null and local alternatives this test statistic has the same asymptotic distribution as given in Theorem 1 above. The null distribution depends only on g¯ and the dimension of the X variables. 13
We construct in the next section tests based on various weightings over the cointegrating vector, although the simplest test arises using equal weights. The test can be constructed through the following steps. • Step 1: Run a vector autoregression of zt on zt−1 including deterministic terms (for example if D = ι include a constant). From the residuals, construct an estimate of the ˆ along with a consistent (scaled by 2π) spectral density at frequency zero, denoted Ω, ˆ of Λ.If the data are not serially correlated then Ω ˆ is simply the variance estimate Λ ˆ = 0. Partition the matrices after covariance matrix of the residuals of the VAR and Λ ˆ ij and Λ ˆ ij denote the ij th blocks. Construct Ω ˆ 11 and the mth row and column and let Ω ˆ −1 ˆ ˆ 2.1 = Ω ˆ 22 − Ω ˆ 012 Ω ˆ ˆ Ω 11 Ω12 . Also construct Λ22 and Λ12 . • Step 2: If D = ι, construct ytd = yt − T −1 ytd = yt , xdt = xt .
PT
s=1
ys and xdt = xt − T −1
PT
s=1
xs ,otherwise
d d d d 0 ˆ −1 ˆ ˆ −1 ˆ • Step 3. Construct wt such w1 = y1d −xd0 1 Ω11 Ω12 and wt = (yt −yt−1 )−(xt −xt−1 ) Ω11 Ω12
for t = 2, ...T. d ˆ −1/2 • Step 4: Construct x˜dt = Ω 11 xt .
• Step 5: The statistic is then computed as à ! T T X X d d ˆ −1 ˆ 22 ¯2 T −2 g) = −Ω (yt−1 )2 + 2¯ g T −1 yt−1 wt − Λ CT (¯ 2.1 g t=2
Ã
ˆ −1 ¯T −2 +Ω 2.1 g Ã
∗ g¯T −2 Ã
T X
t=2
d x˜dt−1 yt−1 + T −1
t=2
T X
t=2
d x˜dt−1 yt−1 + T −1
t=2
Ã
− log det g¯2 T −2
T X
T X t=2
T X
x˜dt−1 x˜d0 t−1
t=2
ˆ 012 x˜dt−1 wt − Λ
ˆ 012 x˜dt−1 wt − Λ
!!
!
!0 Ã
T −2
T X
x˜dt−1 x˜d0 t−1
t=2
.
• Step 6: The test rejects for large values, with critical values given in Table 1.
14
!−1
4
Evaluating the Tests
In this section we evaluate the tests presented and compare against popularly employed tests for this null hypothesis.
4.1
Large Sample Evaluation
The tests were designed to have power against the cointegrating vector β being unknown and drawn from an even weighted distribution on its (infinite) support. We approximate this support by considering the case where β is drawn from a uniform distribution. More precisely. We set m = 1 so that xt is univariate. Under the null hypothesis the data are drawn as random walks with mean zero normal innovations with variance covariance ˜ We set Σ11 = Σ22 = 1, and vary Σ12 . Under the local alternative matrix Σ, which defines R. we draw residuals as under the null hypothesis, however now the data are drawn from a VAR(1) with coefficient matrix
⎛ ⎝
1
0
β(ρ − 1) ρ
⎞ ⎠
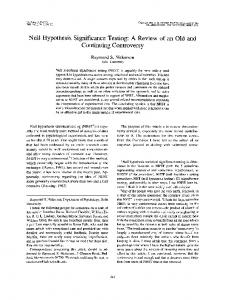
where ρ = 1 − γT −1 . We draw β from a U (−10, 10) distribution and we construct power curves against this random alternative. We employ 5, 000 Monte Carlo replications and a sample of T = 1000 to approximate large sample performance. Results are presented for D = ι and Σ12 = −0.5, −0.25, 0, 0.25, and 0.5. Figures 1-5 presents the rejection rates of CT (¯ g) for g¯ = 3 (LR in the graphs) in comparison with Engle and Granger (1987) test (EG), Boswijk’s (1994) Wald test, the maximum eigenvalue test (JOH) of Johansen and Juselius (1990), and Banerjee et al. (1986) test on the Error correction equation (ECR). We also plot the rejections rates for CT (¯ g ) when g¯ = c for each c, CT (c) (MAX in the graphs). This is the power bound or the maximum attainable power at each point in the alternative when β is drawn from an uniform distribution. While the asymptotic distribution of the tests under the local alternative depend on the value of Σ12 is clear from Figure 1-5 that the power curves are very similar. None of the existing test achieve the power bound for alternatives close to the null. CT (3) is tangent to CT (c) by definition and close to the null it outperforms all other tests although the gain in power over using a system tests (ECR, Wald or JOH) is not large. The unit root test on the
15
residuals (EG) has very low power in all four scenarios as it is based on a single equation for yt and does not use the information contained in the equation for xt . Even the case of Σ12 = 0 in the rotated model, is equivalent to Σ∗12 = −β in (3)which corresponds to cases in Pesavento (2004) in which Engle and Granger’s (1987) test does not perform well and system tests perform very well. In fact, in all four scenarions residual tests for cointegration are biased (see also Pesavento (2004)). For alternative points further away from the null, ECR, Wald, and JOH have power than is higher than CT (3). Overall it is clear that all the system tests are very close to each other and not too far from the maximal power.
This result suggests that existing tests are indeed close to the
power bounds at least in the case in which we have no information on likely values of the cointegration vector.
5
Conclusion
Tests for the null of no cointegration are nonstandard in a number of ways – as with tests for a unit root null there is no uniformly most powerful test even when the cointegrating vector is known. When these nuisance parameters are not known, they do not appear under the null hypothesis. For both these reasons we do not expect that tests based on MLE’s or regression approaches to have any optimality properties (at least none follow from the usual arguments). This paper sets out to compute bounds for testing the null hypothesis of no cointegration to evaluate whether or not the tests are close to optimal in a practical sense (that there is not much in the way of gains in large sample power to be had from constructing new tests) or if they fall short. We characterize optimal tests for this problem. As is typical with a nuisance parameter not known under the null distribution, power depends on the weighting over possible sets of nuisance parameters. We show that for an equal weighting over possible cointegrating vectors, that the resulting family of point optimal tests (which in turn trace out the power bound) do not depend under the null hypothesis on any of the nuisance parameters of the problem (they still however depend on the dimensions of the cointegrating vector, however this is obviously known). Power does depend on a nuisance parameter describing the simultaneity of the model as well as the true cointegrating vector. Averaging accross possible cointegrating vectors in accordance with the flat weightings 16
over potential vectors, we are able to show that (i) existing systems test such as the Johansen (1988) trace test and the ECM-Wald test are close to the power bounds, however there is some difference in power for intermediate local alternatives, and (ii) that univariate tests such as the Engle and Granger (1983) test do not have good power against this alternative hypothesis. Overall the differences bewteen the power bounds and the leading tests are not so great and so these results suggest the use of the popular statistics in practice. The main caveat to the results rests on the chosen weighting function – a more informative weighting function will result in a different power bound and different power functions for the popularly employed tests, so the differences may well be larger (or smaller) in such a situation. From the results of Elliott et. al. (2005) that a single point weight on the cointegrating vector (i.e. when it is known) results in substantial power gains.
17
Table 1:Critical values 1%
5%
10%
D = 0 g¯ = 3
9.04
6.34 5.30
g¯ = 5
9.45
6.87 5.83
g¯ = 10 10.43 7.81 6.31 D=ι
g¯ = 3
9.12
6.48 5.29
g¯ = 5
9.46
6.63 5.40
g¯ = 10 9.74
6.98 5.67
The critical values are computed by approximating the Brownian Motions in (9)by step functions using Gaussian random walk with 1000 steps and 50000 replications for the correspoding g¯.
18
1
0.8
0.6
0.4
EG JOH LR 0.2
ECR Wald MAX
0 1
2
3
4
5
6
7
8
9 10 11 12 13 14 15 16 17 18 19 20 21 22 23 24 25 26 27 28 29 30
Figure1: Rejection Rates, Σ12 = −0.5, g¯ = 3, D = ι
1
0.8
0.6
0.4
EG JOH LR 0.2
ECR Wald MAX
0 1
2
3
4
5
6
7
8
9 10 11 12 13 14 15 16 17 18 19 20 21 22 23 24 25 26 27 28 29 30
Figure 2: Rejection Rates, Σ12 = −0.25, g¯ = 3, D = ι
19
1
0.8
0.6
0.4
EG JOH LR 0.2
ECR Wald MAX
0 1
2
3
4
5
6
7
8
9 10 11 12 13 14 15 16 17 18 19 20 21 22 23 24 25 26 27 28 29 30
Figure 3: Rejection Rates, Σ12 = 0, g¯ = 3, D = ι
1
0.8
0.6
0.4
EG JOH LR 0.2
ECR Wald MAX
0 1
2
3
4
5
6
7
8
9 10 11 12 13 14 15 16 17 18 19 20 21 22 23 24 25 26 27 28 29 30
Figure 4: Rejection Rates, Σ12 = 0.25, g¯ = 3, D = ι
20
1
0.8
0.6
0.4
EG JOH LR ECR
0.2
Wald MAX 0 1
2
3
4
5
6
7
8
9 10 11 12 13 14 15 16 17 18 19 20 21 22 23 24 25 26 27 28 29 30
Figure 5: Rejection Rates, Σ12 = 0.5, g¯ = 3, D = ι
6
References
Andrews, D., and W. Ploberger., 1994, Optimal Tests when the Nuisance Parameter is only present under the Alternative, Econometrica, 62, 1383-1414. Banerjee, A., Dolado, J.J., Hendry, D.F. and G.W. Smith, 1986, Exploring Equilibrium Relationship in Econometrics through Static Models: Some Monte Carlo Evidence, Oxford Bulletin of Economics and Statistics 48, 253-277 Boswijk, H. P., 1994, Testing for an Unstable Root in Conditional and Structural Error Correction Models, Journal of Econometrics 63, 37-60. Elliott, G. and M. Jansson, 2003: “Testing for Unit Roots with Stationary Covariates”, Journal of Econometrics, 115, pp. 75-89. Elliott, G., M. Jansson, and E. Pesavento, 2005: “Optimal Power for Testing Potential Cointegrating Vectors with Known Parameters for Nonstationarity”, Journal of Business & Economic Statistics, 23:1, pp.34-48. 21
Engle, R.F. and C. W. Granger, 1987, Cointegration and Error Correction: Representation, Estimation and Testing, Econometrica 55, 251-276 Hansen, B.E., 1996, Inference when a nuisance parameter is not identified under the null hypothesis, Econometrica, 64, 413-430 King, M., 1988, Towards a Theory of Point Optimal Testing, Econometric Reviews, 6, 169-218. Jansson, M., 2007., Semiparmetric Power Envelopes for Tests of the Unit Root Hypothesis, manuscript, UC Berkeley. Johansen, S., 1995, Likelihood Based Inference in Cointegrated autoregressive Models. (Oxford University Press, Oxford). Johansen, S, 1988, Statistical Analysis of Cointegrating Vectors, Journal of Economic Dynamics and Control, 12, 231-254. Johansen, S. and K. Juselius, 1990, Maximum Likelihood Estimation and Inference on Cointegration with Application to the Demand for Money, Oxford Bulletin of Economics and Statistics 52, 169-210. Mueller, U.K. and G. Elliott., 2003, Tests for Unit Roots and the Initial Observation, Econometrica, 71, 1269-1286. Mueller, U.K., 2007, An Alternative Sense of Asymptotic Efficiency, manuscript, Princeton University. Pesavento, E., 2004, "An Analytical Evaluation of the power of tests for the absence of cointegration", Journal of Econometrics, vol. 122, No. 2, October 2004, pp. 349-384. Pesavento, E., 2006,"Residuals Based Tests for the Null of No Cointegration: an Analytical Comparison", forthcoming, Journal of Time Series Analysis. Phillips, P.C.B. and S. Ouliaris, 1990, Asymptotic Properties of Residuals Based Tests for Cointegration, Econometrica 58, 165-193. Phillips, P.C.B. and V. Solo, 1992, “Asymptotics of Linear Processes”, The Annals Of Statistics 20, pp. 971-1001.
22
Rothenberg, T.J. and J.H. Stock., 1993, Inference in a Nearly Integrated Model with Nonnormal Innovations, Journal of Econometrics, 80, 269-286. Zivot, E. (2000): “The Power of Single Equation Tests for Cointegration when the Cointegrating Vector is prespecified”, Econometric Theory, 16, 407-439
7
Appendix
Proof. (Theorem 1).
⎛
⎞
˜ ⎝ vec(x) ⎠ = M ˜ P˜ −1 u then the likelihood at ˜ P˜ 0 A˜−10 ) and M Since u ∼ N(0, A˜−1 P˜ Σ y ρ = r is proportional to ⎡ ⎛ ⎞⎤ ³ ´ ³ ´ − vec(x) 1 ˜ M ˜ P˜ −1 A˜−1 P˜ Σ ˜ P˜ 0 A˜−1 P˜ −10 M ˜ ˜⎝ ⎠⎦ exp ⎣− M vec(x)0 y 0 M 2 y ⎛ ⎞⎤ ⎡ ´ ³ ´− vec(x) 1³ 0 ˜ 0 0 ˜ ˜ ˜ ˜⎝ ⎠⎦ ⎣ = . exp − vec(x) y M MK(r)ΣK(r) M M 2 y
³ ´−1 0 0 ˜ −1 ˜ ˜ −1 K(r) is a ˜ ˜ ˜ DK(r) Σ Now G(r) = K(r) Σ K(r) − K(r) Σ K(r)D D K(r) Σ K(r)D ˜ P˜ −1 A˜−1 P˜ Σ ˜ P˜ 0 A˜−1 P˜ −10 M. ˜ candidate generalised inverse for M 0 ˜ −1
0 ˜ −1
The likelihood can be written as ⎛ ⎞⎤ ⎡ ³ ´ vec(x) 1 ˜ ˜⎝ ⎠⎦ . M exp ⎣− vec(x)0 y 0 MG(r) 2 y
Hence the likelihood ratio test is proportional to ⎛ ⎞⎤ ⎡ ³ ´ vec(x) 1 ˜ ˜⎝ ⎠⎦ . ρ) − G(1))M exp ⎣− vec(x)0 y 0 M(G(¯ 2 y By definition,
˜ −1 K(¯ρ) − K(1)0 Σ ˜ −1 K(1) G(¯ρ) − G(1) = K(¯ρ)0 Σ ³ ´−1 0 ˜ −1 0 0 ˜ −1 ˜ ˜ ˜ ˜ ρ)Σ ˜ −1 K(¯ρ) −K(¯ρ) Σ K(¯ρ)D D K(r) Σ K(r)D DK(¯ ³ ´−1 0 ˜ −1 0 0 ˜ −1 ˜ ˜ ˜ ˜ ˜ −1 K(1). +K(1) Σ K(1)D D K(1) Σ K(1)D DK(1) Σ 23
(10)
We can write
K(r) = P˜ −1 A˜P˜ ⎛ ⎞ Ik ⊗ A(1) 0 ⎠ = ⎝ 0 (r − 1)(β ⊗ B) A(1) + (1 − r)B = K(0) + (1 − r)Kd
where B is a backward shift matrix ⎛
0
⎞
0
⎟ ⎟ ⎟ ⎟ ⎟ ⎠
⎜ ⎜ 1 0 ⎜ B=⎜ ⎜ 0 ... ⎝ 0 0 1 0
and
⎛
Kd = ⎝
0
0
(−β 0 ⊗ B) B
⎞
⎠.
˜ −1 K(¯ρ)−K(1)0 Σ ˜ −1 K(1) = (1−¯ρ)2 K 0 Σ ˜ −1 Kd +(1−¯ρ)(K 0 Σ ˜ −1 K(1)+K(1)0 Σ ˜ −1 Kd ). Thus K(¯ρ)0 Σ d d We have for the first term in (10) ³ =
³
vec(x)0 y 0
´
⎛
˜ −1 K(¯ρ) − K(1)0 Σ ˜ −1 K(1))M ˜ ˜ ⎝ vec(x) ⎠ M(K(¯ ρ)0 Σ y
vec(Mx)0 y 0 M
´
(1 − ρ¯)2
vec(Mx)0 y 0 M
¯)2 = Σ−1 2.1 (1 − ρ
³
⎛
⎞
˜ −1 Kd + (1 − ρ¯)(Kd0 Σ ˜ −1 K(1) + K(1)0 Σ ˜ −1 Kd )) ⎝ vec(Mx) ⎠ . ((1 − ρ¯)2 Kd0 Σ My
The first of these terms is ³
⎞
´
⎛
˜ −1 Kd ⎝ Kd0 Σ
vec(Mx)0 y 0 M
´
⎛⎛ ⎝⎝
−β 1
vec(Mx) ⎞ ⎠
My ³
where c = y − xβ is the error correction term. 24
⎠
−β 0 1
¯)2 (BMy − BMxβ)0 (BMy − BMxβ) = Σ−1 2.1 (1 − ρ ¯)2 c0−1 Mc−1 = Σ−1 2.1 (1 − ρ
⎞ ´
⎞⎛
⊗ BB 0 ⎠ ⎝
vec(Mx) My
⎞ ⎠
For the second term we have (1 − ρ¯) = (1 − ρ¯)
³ ³
vec(Mx)0 y 0 M
vec(Mx)0 y 0 M
´ ´
⎛
˜ −1 Kd ⎝ K00 Σ ⎛ ⎝
vec(Mx) My
⎞ ⎠
(Σ12 ⊗ A(1)0 ) (−β 0 ⊗ B) Σ12 ⊗ A(1)0 B 22
0
0
22
0
⎞⎛ ⎠⎝
vec(Mx)
⎞ ⎠
Σ A(1) (−β ⊗ B) Σ A(1) B My ¢ ¡ 120 0 = (1 − ρ¯) −Σ x MA(1)0 BMxβ + Σ22 y 0 MA(1)0 BMy − Σ22 y 0 MA(1)0 BMxβ + Σ120 x0 MA(1)0 BMy ¡ ¢ = (1 − ρ¯) Σ22 y 0 MA(1)0 Mc−1 + Σ120 x0 MA(1)0 Mc−1 ¡ 0 ¢ 0 −1 0 0 = (1 − ρ¯)Σ−1 2.1 y − Σ12 Σ11 x MA(1) Mc−1 = (1 − ρ¯)Σ−1 ˜0 MA(1)0 Mc−1 . 2.1 y
Putting this together yeilds ⎛ ⎞0 ⎛ ⎞ ³ ´ vec(Mx) vec(Mx) ˜ −1 K1 − K00 Σ ˜ −1 K0 ⎝ ⎝ ⎠ K10 Σ ⎠ My My 0 0 ¯)Σ−1 ˜. = (1 − ρ¯)2 Σ−1 2.1 c−1 Mc−1 + 2(1 − ρ 2.1 c−1 MA(1)M y
The result follows with the remaining terms in G(¯ρ) − G(0) = G. To obtain asymptotic distributions, let the disturbances be such that suitably scaled P[T λ] they satisfy an invariance principle, i.e. T −1/2 ξ [T λ] = T −1/2 t=1 vt ⇒ Ω1/2 W (λ) uniformly
in λ ∈ [0, 1] where ⇒ denotes weak convergence, Ω = 2πSv (0) where Sv (0) is the spectral
density of vt at frequency zero and W (λ) is a kx1 standard Brownian motion. This follows P[T λ] from Condition 1. It follows directly that T −1/2 t=1 P vt ⇒ P Ω1/2 W (λ) where ⎞⎛ ⎞⎛ ⎞ ⎛ 1/2 W (λ) 0 Ω11 1 0 ⎠⎝ 1 ⎠⎝ ⎠ P Ω1/2 W (λ) = ⎝ 1/2 Ω012 Ω−1 W Ω (λ) −β 0 1 2 11 2.1 ⎞ ⎛ 1/2 Ω11 W1 (λ) ´ ⎠. ³ ⎝ = 1/2 ˜ ˜ Ω2.1 W2 (λ) − (β − R)W1 (λ) where the partition is after the kth row and column. It also follows from Condition 1 that R P T −1 Tt=2 ξ t−1 vt0 ⇒ Ω1/2 W (λ)dW (λ)0 + Λ. 1/2
Let (u1 , u2 ) have rows u0t = (u01t , u2t ) and hence we have that T −1/2 u1[λT ] ⇒ Ω11 W1 (λ) ´ ³ 1/2 −1/2 ˜ ˜ u2[λT ] ⇒ Ω2.1 W2γ (.) − (β − R)W1γ (.) where Wiγ (.) are Ornstein Uhlenbeck and T 25
processes constructed from Wi (.) for i = 1, 2. Define ui,−1 = (0, ui1 , ..., uiT −1 ). Further deR fine Wij (λ) = Wi (λ) for the no deterministic case and W j (λ) = Wi (λ) − Wi (s)ds for the 1/2 ˜ 0 ˜ 0 −1/2 case where D = ι. Define v˜2t = v2t + (β − Ω−1 11 Ω12 ) v1t = v2t + Ω2.1 (β − R) Ω11 v1t so P 1/2 T −1/2 Tt=2 v˜2t ⇒ Ω2.1 W2 (.).
A number of results used in proving the theorems follow directly. First, T −2 u01,−1 Mu1,−1 ⇒ ´ R³ j 1/2 R 1/20 j ˜ 1γ W2γ (.) − (β˜ − R)W (.) Ω11 W1j (λ)W1j (λ)0 Ω11 under both H0 and H1. Also T −2 u02,−1 Mu2,−1 ⇒ Ω2.1 ´ ³ 1/2 R 1/20 j j −2 0 ˜ ˜ W2γ (.) − (β − R)W1γ (.) W1j (.)0 Ω11 . and T u2,−1 Mu1,−1 ⇒ Ω2.1 1/2 R 1/2 Also, note that T −1 u01,−1 M v˜2 ⇒ Ω11 W1j (λ)dW2j (λ)Ω2.1 + Λ12 , and T −1 u02,−1 M v˜2 ⇒ R j j ˜ 1γ Ω2.1 (W1γ (λ) − (β˜ − R)W (λ))dW2j (λ) + Λ22 . Proof. (Theorem 2).
Results will be constructed for the serially correlated case, so results of the theorem are for the special case of Ω = Σ known and Λ = 0. Rearranging, y−1 = (y−1 − x−1 β + x−1 β), so ³ ´ 0 1/20 1/2 1/2 1/2 T −2 Ω−1 y 0 My−1 = T −2 Ω−1 u0 Mu2,−1 + β˜ Ω u0 Mu1,−1 Ω β˜ + 2Ω u0 Mu1,−1 Ω β˜ . 2.1 −1
2.1
2,−1
11
1,−1
11
2.1
2,−1
11
Limit results follow from the results above for each of these peices. Similarly the terms −1/2
−1/20
T −2 Ω11 u01,−1 Mu1,−1 Ω11
−1/2
−1/20
and T −2 Ω2.1 u02,−1 Mu1,−1 Ω11
follow directly. For the terms in−1/2
−1/2
volving A(1)M y˜, notice that A(1)M y˜ = M v˜2 (1−ρ)Mu2,−1 . Hence we have T −1 Ω2.1 Ω11 u01,−1 MA(1)M y˜ = −1/2
−1/2
−1/2
−1/2
T −1 Ω2.1 Ω11 u01,−1 M v˜2 − γT −2 Ω2.1 Ω11 u01,−1 Mu2,−1 where the limit results follow from 0 0 0 above. Similarly T −1 Ω−1 ˜ = T −1 Ω−1 v2 − γT −1 u2,−1 ) where 2.1 u2,−1 MA(1)M y 2.1 (u2,−1 + βu1,−1 )M(˜
all terms follow from above. For the case where D = ι, we still have the third term, which we show here to be op (1). ˜ −1 K0 D ˜ = Σ−1 ⊗ ι0 A(1)0 A(1)ι = Σ−1 . ˜ 0 K00 Σ First note that the second denominator term D The first denominator term is ˜ 0 K10 Σ ˜ −1 K1 D ˜ = D ˜ 0 K00 Σ ˜ −1 K0 D ˜ + (1 − ρ)2 D ˜ 0 Kd0 Σ ˜ −1 Kd D ˜ + (1 − ρ)(D ˜ 0 Kd0 Σ ˜ −1 K0 D ˜ +D ˜ 0 K00 Σ ˜ −1 Kd D) ˜ D ˜ −1 K0 D ˜ + γ 2 T −2 D ˜ 0 Kd0 Σ ˜ −1 Kd D ˜ + γT −1 (D ˜ −1 K0 D ˜ +D ˜ 0 K00 Σ ˜ −1 Kd D). ˜ ˜ 0 K00 Σ ˜ 0 Kd0 Σ = D
The first term is Σ−1 , take the remaining terms independently. First, ⎛⎛ ⎞ ⎞ ´ ³ −β ˜ 0 Kd0 Σ ˜ −1 Kd D ˜ = Σ−1 ⎝⎝ ⎠ −β 0 1 ⊗ T −2 ι0 B 0 Bι⎠ T −2 D 2.1 1
but T −2 ι0 B 0 Bι = T −2 (T − 1) → 0 and so this term dissapears at rate T. Also ⎛ ⎞ 21 −1 0 0 22 −1 0 0 ˜ 0 Kd0 Σ ˜ −1 K0 D ˜ = ⎝ (−βΣ ⊗ T D B A(1)D) Σ (−β ⊗ T D B A(1)D) ⎠ T −1 D (Σ21 ⊗ T −1 D0 B 0 A(1)D) Σ22 T −1 D0 B 0 A(1)D 26
and T −1 ι0 B 0 A(1)ι = T −1 0 = 0. Finally ⎛ ⎞ 12 0 −1 0 0 12 −1 0 0 ˜ 0 K00 Σ ˜ −1 Kd D ˜ = ⎝ (−Σ β ⊗ T D A(1) BD) Σ ⊗ T D A(1) BD ⎠ T −1 D Σ22 (−β 0 ⊗ T −1 D0 A(1)0 BD) Σ22 T −1 D0 A(1)0 BD
and T −1 ι0 A(1)0 BιT −1 ι0 B 0 A(1)ι = T −1 0 = 0. Hence we have that for D = ι ˜ 0 K10 Σ ˜ −1 K1 D ˜ = D ˜ 0 K00 Σ ˜ −1 K0 D ˜ + o(T −1 ) D
= Σ−1 + o(T −1 ). ³ ´−1 ˜ −1 K1 D ˜ D ˜ 0 K10 Σ ˜ −1 K1 D ˜ ˜ 10 Σ ˜ −1 K1 = K10 Σ ˜ −1 K1 DΣ ˜ DK ˜ 10 Σ ˜ −1 K1 + >From this it follows that K10 Σ DK
op (1) provided that the numerator terms are at most 0p (1). For the numerator. We have
˜ 0 K10 Σ ˜ −1 K1 = D ˜ −1 (K0 + (1 − ρ)Kd ) ˜ 0 (K0 + (1 − ρ)Kd )0 Σ D
Now,
˜ −1 K0 + (1 − ρ)2 D ˜ 0 Kd0 Σ ˜ −1 Kd + (1 − ρ)D ˜ −1 K0 + (1 − ρ)D ˜ −1 Kd ˜ 0 Kd0 Σ ˜ 0 K00 Σ ˜ 0 K00 Σ = D ³ ´ ˜ 0 Kd0 Σ ˜ −1 K0 + γ 2 T −2 D ˜ 0 Kd0 Σ ˜ −1 Kd + γT −1 D ˜ −1 K0 + D ˜ −1 Kd . ˜ 0 K00 Σ ˜ 0 K00 Σ = D ⎛
⎞
⎛
0
0
0
0
0
⎞⎛
⎞
˜ −1 Kd ⎝ vec(Mx) ⎠ = Σ22 ⎝ (ββ ⊗ ι B B) (−β ⊗ ι B B) ⎠ ⎝ vec(Mx) ⎠ ˜ 0 Kd0 Σ D (−β 0 ⊗ ι0 B 0 B) ι0 B 0 B My My ⎞ ⎛ β[ι0 B 0 BMxβ − ι0 B 0 BMy] ⎠ = Σ22 ⎝ −ι0 B 0 BMxβ + ι0 B 0 BMy ⎛ ⎞ 0 0 −βι B BMc ⎠. = Σ22 ⎝ 0 0 ι B BMc
For the next term ⎛ ⎞ ⎞⎛ ⎞ ⎛ 0 12 0 12 0 vec(Mx) vec(Mx) (Σ ⊗ A(1) ) (−β ⊗ B) Σ ⊗ A(1) B ˜ −1 Kd ⎝ ⎠ = ⎝ ⎠⎝ ⎠ K00 Σ My Σ22 A(1)0 (−β 0 ⊗ B) Σ22 A(1)0 B My ⎞ ⎛ 12 0 12 0 − (Σ ⊗ A(1) ) BMxβ + Σ ⊗ A(1) BMy ⎠ = ⎝ −Σ22 A(1)0 BMxβ + Σ22 A(1)0 BMy ⎞ ⎛ 12 0 (Σ ⊗ A(1) ) BMc ⎠ = ⎝ 22 0 Σ A(1) BMc 27
so
⎛
˜ −1 Kd ⎝ ˜ 0 K00 Σ D
Finally
⎛
˜ −1 K0 = ⎝ Kd0 Σ ⎛
= ⎝
so
⎛
˜ −1 K0 ⎝ Kd0 Σ
vec(Mx) My
⎞
vec(Mx)
⎛
⎠ = (1 − ρ) ⎝
My
⎞⎛
0
0 (−β ⊗ B )
⎠⎝
B0
0
0
12
0
0
Σ ⊗ D A(1) BMc 22
0
0
Σ D A(1) BMc
11
12
Σ ⊗ A(1) Σ ⊗ A(1) Σ21 ⊗ A(1)
Σ22 A(1)
21
0
22
⎞
⎠.
⎞ ⎠
(−β ⊗ B ) (Σ ⊗ A(1)) (−β ⊗ B ) (Σ ⊗ A(1))
⎞
0
21
22
B (Σ ⊗ A(1)) ⎛
⎠ = ⎝
⎛
= ⎝
0
0
Σ B A(1)
21
0
22
0
21
22
B (Σ ⊗ A(1))
0
Σ B A(1)
(−β ⊗ B 0 )A(1)MxΣ12 + Σ22 (−β ⊗ B 0 )A(1)My ⎛
B 0 A(1)MxΣ12 + Σ22 B 0 A(1)My
(β ⊗ B
0
)A(1)MxΣ−1 11 Σ12
0
˜ −1 K0 ⎝ ˜ 0 Kd0 Σ D
For a T xr vector z
vec(Mx) My
⎞
⎛
⎠ = Σ−1 ⎝ 2.1
0
0
−β ⊗ D B A(1)M y˜ D0 B 0 A(1)M y˜
ι0 B 0 A(1)Mz = (zT − z1 ) ι0 A(1)BMz = 0 ι0 B 0 BMz = z¯ − z1 For the mean case we have that for T −1/2 z[T.] being 0p (1) then ¡ ¢ T −2 ι0 B 0 BMz = T −3/2 T −1/2 z¯ − T −1/2 z1 →p 0
T −1 ι0 A(1)0 BMz = T −1 0 = 0
T −1 ι0 B 0 A(1)Mz = T −1/2 (T −1/2 zT − T −1/2 z1 ) →p 0. 28
⎞⎛ ⎠⎝
⎞ ⎠
+ (−β ⊗ B )A(1)My
0 −B 0 A(1)MxΣ−1 11 Σ12 + B A(1)My ⎛ ⎞ 0 −β ⊗ B A(1)M y˜ ⎝ ⎠. = Σ−1 2.1 0 B A(1)M y˜
⎛
⎠
(−β ⊗ B ) (Σ ⊗ A(1)) (−β ⊗ B ) (Σ ⊗ A(1))
⎝ = Σ−1 2.1
Finally
⎞
⎞
⎠.
⎞ ⎠
vec(Mx) My
⎞ ⎠
Then we have ⎛ ⎞0 µ ³ ´−1 ³ ´−1 Mx ˜ −1 K0 D ˜ D ˜ 0 K00 Σ ˜ −1 K0 D ˜ ˜ 00 Σ ˜ −1 K0 − K10 Σ ˜ −1 K1 D ˜ D ˜ 0 K10 Σ ˜ −1 K1 D ˜ ˜ 10 Σ ˜ −1 K ⎝ ⎠ K00 Σ DK DK My
= 0 + op (1).
Hence the second term dissapears asymptotically in the case where D = ι. R R Null distributions follow from setting γ = 0 so W2γ = W2 etc. Proof. (Theorem 3).
Optimality is for the serially uncorrelated case at the points γ = g¯ for the uniform distribution over ˜b.This result follows by construction, directly for the case of D = 0 and via dominated convergence for the case where D = ι..
29