Testing Wideband Terminals Silvia Poschen1, Frank Kettler1, Alexander Raake2, Sascha Spors2 1
HEAD acoustics GmbH,52134 Herzogenrath, Deutschland, Email:
[email protected] 2 Deutsche Telekom Laboratories,10587 Berlin, Deutschland, Email:
[email protected]
Introduction Wideband speech transmission is likely to come up in the near future, extending the transmission frequency range from 300-3400 Hz (narrowband) to 50-7000 Hz or beyond. Wideband-capable phones are under development, the network infrastructure is moving towards the inclusion of wideband speech coders and an interoperation with wideband terminals. Consequently, there is a high demand for testing in order to ensure high speech quality, especially for terminals. It can be assumed that the acceptance of wideband communication will highly depend on the service quality perceived by the users. Two ETSI standards (ES 202 739/740 [1], [2]) provide the “most comprehensive” test descriptions available. Tests under all conversational aspects like one-way speech quality, echo and double talk performance, handling of background noises and basic tests considering the new IP based network infrastructure are covered. However, due to the lack of basic knowledge on wideband transmission a deeper investigation on tests and requirements of different parameters is required. Some of them are discussed here.
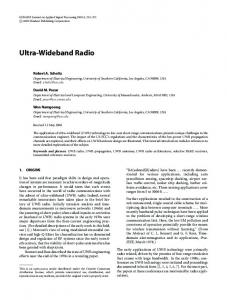
Investigation of the Frequency Response Characteristics in Receiving Direction Figure 1 shows the frequency response of three wideband terminals measured according to [1]. None of the measured response characteristics fit to the tolerance scheme given in [1]. Nevertheless, the device represented by the green curve provides a good listening speech quality as confirmed in formal listening tests. Therefore it was assumed that the corresponding test method and the requirement do not correspond to the subjectively preferred speech sound.
characteristics for each phone. Furthermore the “winner” frequency response characteristics of different phones look similar. L/dB[Pa/V] 30 20
10
0
-10
-20 -30 100
200
500
f/Hz
2000
5000
Figure 1: Receiving frequency response of 3 wideband terminals and the tolerance scheme of ES 202 739 measured in handset mode at an artificial head, 3.4 artificial ear, free-field equalization and with 8 N application force.
Using these “winner” frequency responses a formal listening test with naïve test persons was conducted. Furthermore equalizer settings providing a flat frequency response measured with DRP to ERP [3] correction, free-field and diffuse-field equalization of the artificial head were used for several phones. Additionally, a recording of the ortho-telephonic reference position was inserted (measurement with two artificial heads in 1m distance to each other). The speech sounds were assessed by 24 listeners on the 5-point MOS-scale in terms of their “overall quality”. The speech material (two sentences of two male and two female speakers each) was presented diotically. 5 Average and confidence interval
4
3
-
the settings chosen by the experts were significantly different for all tested phones
-
in subsequent interviews the experts stated that it was very difficult to adjust a preferred speech sound without having a “reference sound” or a comparison to another device.
Initiated by these results a second expert test was conducted. The experts now had to rank the speech samples of each phone separately. These were recorded using an artificial head and the equalizer settings adjusted in the first test. The results of these tests clearly indicate a “winner” response
2
1 Te l2 O F rt F ho o _R pt e 8N T e Or f2_ l 2 tho BP T e Di _R l 1 ff ef o 1 Te Dif pt 8 l fo N Te 1 F pt l 1 F o 8N Te Lin pt l 1 o 2N p Te FF t 2 l 1 op N t T e Fav 8N l1 2 T e Fa 13 N l 7 v2 T e Fa 8N l 1 v1 T Fa 8N Te el 1 v2 l 1 Fa 2N T e FF v3 l 7 o 8N p Te Dif t 1 3 l7 fo N F pt Te F o 8N Te l 1 pt l 1 Fa 8N v Te Lin 1 2 l o N Te 1 F p t l 2 av 8N Te L 3 1 l 3 in o 3 N D pt iff 8 op N t8 Te N l1 A T e Fa BE l 1 v1 T e Fa 8N Te l 2 v3 l 3 Fa 2N Te Li v1 l 7 n o 2N Te Lin p t l 3 o 8N F pt T e F o 8N l 2 pt T e Fa 8N l 2 v2 T e Fa 8N l 3 v2 T e Fa 2N l 7 v1 T F 8 Te el av3 N l1 7F 8 Li av2 N Te n o 8 l 1 pt N T e Fav 13N 1 l Te 2 F 13 l 2 av N 1 T e Fav 8N l2 2 T e Fa 13 N l 2 v3 T e Fa 2N l 3 v3 Te F 8 l 2 av N 2 T e Fav 8N l 3 Te 3 F 13 l 2 av N Fa 3 8 v1 N 13 N
First investigations were started with expert listeners who were instructed in the first test to adjust their personally preferred speech sound quality for several wideband devices using a software equalizer. The adjustment of the frequency response characteristics was performed in 1/3 octaves between 100 and 8000 Hz. Two main points were observed:
Figure 2: MOS results and confidence intervals of formal listening test in receiving direction
The results - shown in figure 2 (mean & confidence interval) - indicate that the whole quality range was covered by this listening test. As expected, the ortho-telephonic reference condition was one of the best rated samples (see magenta circle). In order to derive a new tolerance scheme all responses which lead to a MOS score of at least 3.6 were extracted and plotted in one diagram (see figure 3). Based on this plot, a new tolerance scheme (thick black lines in figure 3) and a modified measurement setup was defined using a diffusefield equalized artificial head. This new tolerance scheme is
-20
quency response of the previous test in receiving direction. These recordings were then presented to expert listeners. Again they were asked to modify the frequency characteristic by a software equalizer in 1/3 octaves between 100 and 8000 Hz in order to achieve the perceptually best speech sound. Two results for one phone and two transmitted background noises are shown in figure 5. The following conclusion from the expert’s test can be drawn:
-30
-
For each combination of phone and background noise all experts adjusted similar filters.
-
For high background noise levels the experts adjusted significant high- and low pass characteristics. Subsequent interviews showed that the experts tried to reduce the annoyance of the background noise and to increase the speech intelligibility.
-
For each background noise the settings are similar for all phones transmitting Æ filters are background noise dependent
now proposed to ETSI and 3GPP for updates of ES 202 739 and corresponding new recommendations. L/dB[Pa/V] 20
10
0
-10
-40 100
200
500
f/Hz
2000
5000
Figure 3: Frequency responses leading to an MOS of ≥ 3.6 and proposed new tolerance scheme (thick black lines) to be used for diffuse-field corrected measurements.
Investigation of the Frequency Response Characteristics in Sending Direction In sending direction all tested phones meet the tolerance scheme defined in [1] and also provide a good listening speech quality. A potential risk may be the use of wideband phones in noisy environments. Here, the background noise as well as the signal are transmitted from 50 to 7000 Hz which may lead to poor speech sound and reduced speech intelligibility.
Cafe, Tel 1
L/dB Call Centre, Tel 1
L/dB
20
20
10
10
0
0
-10
-10
-20
-20
-30
-30
-40
-40
-50
1
100
2
200 300
500 700 f/Hz
2000 3000 5000 9000
-50 100
200 300
500 700 f/Hz
2000 3000
5000 9000
Figure 5: Expert’s equalizer settings for one phone and transmitted café noise (left, non-stationary, 68dB(A)) and call centre noise (right, non-stationary, 58dB(A))
With these indications a formal listening test was set up in order to confirm the expert’s findings. The test is still ongoing and will possibly lead to a recommendation of a limited transmission bandwidth for phones when used in noisy environments.
VoIP Terminal under test
Conclusion RCV
3
4
Figure 4: Test arrangement for transmission of realistic background noises and Lombard speech via wideband terminals
To provide realistic recordings, a test environment including background noises and provoking the Lombard speech [4] was created. Therefore, realistic background noises used in the experiment were presented binaurally to 2 talkers (1 male, 1 female) via closed headphones. This initiates the Lombard effect. Both talkers uttered two sentences, which were recorded synchronously to the background noise by an omni-directional microphone. The background noises (1) and the Lombard speech recordings (2) were played back via a background noise simulation system and an artificial mouth respectively, both installed in an anechoic chamber, see figure 4. Speech and noise are then transmitted via several wideband phones and recorded at the electrical POI. In order to simulate a receiving handset, all recordings were filtered with the “winner” fre-
The evaluation of today’s wideband measurement standards showed that an enhancement of ETSI ES 202 739/740 seems to be possible using the requirements and tests for frequency response tests as proposed in this document. The investigation of further parameters, like the annoyance due to wideband echoes in combination with the long IP-network delays is open.
References [1] ETSI ES 202 739, Transmission requirements for wideband VoIP terminals from a QoS perspective as perceived by the user (V1.2.1, Oct. 2007) [2] ETSI ES 202 740, Transmission requirements for wideband VoIP loudspeaking and hands-free terminals from a QoS perspective as perceived by the user (V1.2.1, Oct. 2007) [3] ITU-T Recommendation P. 57: Artificial Ears [4] The influence of acoustics on speech production: A noise-reduced stress phenomenon known as Lombard reflex, Jean-Claude Junqua, Speech communication 20 (1996), p. 13-22