related to each other and to the wetness status of the soil (Eagleson 1982). If the spatial variability and the relative importance of factors that are relevant to.
28 i
TESTS AND APPLICATION OF SOIL MOISTURE DEFICIT MODELS USED FOR ANALYSIS OF BASIN BEHAVIOUR Lotta Andersson Swedish Hydrological and Meteorological Institute, S-601 76, Norrkôping and Department of Water and Environmental Studies, Linkôping University, Sweden ABSTRACT Using soil moisture observations from forest and grassland sites in Sweden and the U.K., a range of daily soil moisture deficit (SMD) models were tested. The optimal combination of physical relevance and simplicity determined the ultimate choice of model structure used for an analysis of basin behaviour in the Velen experimental basin (Sweden). Calculated moisture deficits, groundwater recharge, transpiration and interception rates showed good agreement not only with point measurements but also with the overall basin behaviour. INTRODUCTION The biogeological landscape mosaic is a key to the way that incoming precipitation water is directed and partitioned. The nature of this system will determine the extent of storage, runoff, groundwater recharge and évapotranspiration from an area. Topography, soil and vegetation characteristics are strongly related to each other and to the wetness status of the soil (Eagleson 1982). If the spatial variability and the relative importance of factors that are relevant to soil moisture dynamics during various meteorological conditions are known, it would thus be possible to simulate the hydrological basin behaviour. The use of simulation techniques when describing the hydrological conditions within a basin will always be an abstraction of reality and even the most rigorous physically based models are extreme simplifications of reality, forced by practical consideration to use equivalent parameter values over parts of the flow domain (Beven 1985). The uncertainty of the large number of parameter values that needs to be determined for each grid element has limited the application and validation of this type of models on a basin scale. The described study is an attempt to find simple conceptual soil moisture models, driven by readily available meteorological data, that can be used to assess the basin behaviour. The analysis of basin behaviour (Andersson 1988) was based on the soil moisture conditions registered during the International Hydrological Decade
282
(IHD) in the Velen research basin. This basin is considered representative for coniferous forest areas on moraine soil in south central Sweden (Waldenstrom 1977). The basin has an area of 45 km ' Forest covered 65% of the basin. Lakes occupy nearly 10% of the area. The remaining part consisted of swamps and small cultivated areas. SEARCH FOR OPTIMAL COMBINATION OF FIT AND SIMPLICITY Using soil moisture observations from forest and grassland sites in Sweden and the U.K., a range of daily soil moisture deficit (SMD) models were tested (Andersson & Harding). This paper will concentrate on the observations from the Velen experimental basin. The data The observed SMD was derived from neutron probe measurements by calculating the deficit relative to the soil water content at field capacity, identified as the typical measured moisture content in the root zone during the time between the autumn recharge and the start of the period with significant transpiration demand. The soil depth to which SMD should be defined is sometimes difficult to evaluate. The boundaries between the root zone and ground and surface water are diffuse and continuously changing. At many sites, the root zone will be reached by the ground water table during wet spells; which means that the depth interval of SMD's theoretically decreases in extent The soil depth in die Velen area is limited to a few metres. From evaluations of the soil moisture readings, it was concluded that almost all water depletion took place from the upper metre. To avoid too much interference with the groundwater table, the variations of the water content in the upper metre was used to assess the soil moisture dynamics. Readings were made with the danish BASC neutron probe to obtain the integrated water content over the control volume. A theoretical calibration curve that considers the soil bulk density (determined from measurements of gamma radiation absorption), and chemical composition at various depths (Danfors et al. 1969). Shallowest readings were made at 10 cm below the soil surface for which special corrections were made. Design and evaluation of the tested submodels The models uses daily precipitation and mean air temperature, plus some estimates of potential évapotranspiration as driving variables. No drainage was assumed to occur when the moisture content was below field capacity. A survey of the submodels is given in Table 1. Transpiration Potential évapotranspiration was calculated on a daily basis with the Penman equation (Penman 1948), and by an equation, invariate from year to year, fitted to 30 years average Penman potentials from a nearby synop-
2S3
Table 1 A survey of the different subroutines used in the SMD simulation models Subroutine
Simple
Complex
Penman potentials Soil moisture depletion Rainfall interception Snow models Temperature effect
Averages Linear Constant Degree-day Neglected
Daily Multiple layer Exponential Refreezing, retention, interception Considered
tic meteorological station. To calculate actual évapotranspiration, the potential estimates were reduced via a linear or a three layer (Calder et al. 1983) root constant function, optimised to give the lowest standard deviation between modelled and measured SMD's. When daily Penman values were used as input, the model did often overestimate the moisture depletion during prolonged dry spells, probably because of the strong negative feedback that exists between stomatal resistance and atmospheric humidity (e.g. Roberts 1983). The rather conservative nature of transpiration was shown to be well described by the climatological mean equation. The linear root constant gave better agreements than the layer function. When this is used, the total water content in the defined soil volume is considered when deciding the reduction of the actual transpiration rate. If the main part of the root system is relatively shallow, the ratio between actual and potential transpiration will start to decrease as soon as the water content falls below field capacity. It was shown, however, that the used linear model seemed to be physically relevant not only for grassland but also for four out of the six forest sites. At two of the forest sites, however, the optimised root constant was larger than the field capacity, determined from pF curves. At these sites there was apparently no linear relationship between actual and potential évapotranspiration. This indicates the importance of the lateral variability of the root density for the distribution of soil moisture deficits within a forest soil. Rainfall Interception The simplest model assumed a linear relationship between rainfall amount and interception, set to 26% according to measurements (Bringfelt & Hârsmar 1974). The alternative model used an exponential relationship, involving daily rainfall (Andersson & Harding). In both models, the fraction of the day when the canopy was wet is calculated, under the assumption that no transpiration takes place when intercepted water is available. The exponential model has been shown to give good agreements between measured and predicted interception losses (Calder 1986), whereas the linear model often will overestimate interception losses during the autumn recharge. Unexpectedly, however, the constant rate interception model gave lower mean errors between predicted and observed SMD's. The success of the simple constant model was probably a result of deficiencies in the drainage model, which assumes that drainage only can occur when the field capacity has been reached
284
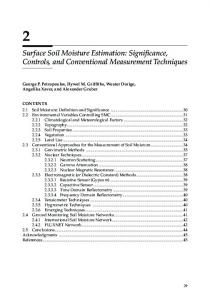
and neglects drainage during unsaturated soil moisture conditions. The autumn recharge of the soil predicted by the model was often too fast at the forest sites (Fig. 1). Any additional drainage losses may have been inadvertently compensated for using the constant rate interception model. This illustrates the problem which can aries in conceptual models where weaknesses in one area can appear as inconsistences elsewhere.
1 ! FT
M ' AFM
' J ' J Ï A
1968
T
5P 0T
N
!
0 | j
!
F ' M U ' M ^ ' J ' A ' S ' O ' N ' D I J
1969
1
F ' M ' A ' M ' J ' J ' A ' S ' O ' N ' O I
1970
Fig. 1 SMD simulated with (filled) and without (dash-dotted) the macropore routine. The points represents the measurements. From Andersson 1988 Snow models Snow models of varying complexity were also included into the SMD models. Accurate descriptions of the amount and timing of snowmelt is of critical importance in areas where a large proportion of the precipitation falls in the form of snow. However, SMD's are often small before and during snowmelt, and the model fits were shown to be rather insensitive to the choice of snowmelt routine. The used models included a degree-day reference. It was only at the driest of the forest sites that introduction of water retention and refreezing in the snow pack, plus snow interception improved the fits. Temperature effect In areas where the soil often is frozen during winter, the water uptake by roots in spring will be limited by low soil temperature (Turner & Jarvis 1975). A simple routine that considers the effect of low temperatures on transpiration rates was shown to improve the model fit for all sites except one (Ladfallet) that was very well drained and where a fast warming up of the soil could be expected because of low moisture contents Structure of the model chosen for basin analysis In the study made by Andersson & Harding, it was shown that inclusion of daily estimates of potential évapotranspiration, a layered regulation function of actual évapotranspiration, a snow routine that included interception, refreezing and water retention, and an exponential rainfall interception model did not improve or deteriorated the performance achieved with simpler models. This can in some cases be attributed to insensitivity to the process and in other cases be due to that a simple formulation can encompass a number of different processes and improvement in only one area can destroy a perhaps fortuitous performance. The model selected for the water flow analysis in the Velen basin, was chosen with the aim to get an ultimate combination of physical realism and simplicity. The physical realism was tested by comparisons not only with
zsi measured soil moisture dynamics, but also with measurements and other calculations of interception and percolation rates and with water balance computations made for the basin. Since the interest also was directed towards estimates of recharge rates, it was necessary to allow SM contents above the field capacity (defined for periods with ground water levels below the depth range used for SMD calculations), and assumes a gradual return back to the field capacity. The indications of the importance of macropore flow through unsaturated soils were considered by introducing a very simple routine that assumes drainage when moisture contents are below field capacity, depending on the accumulated SMD's and the recent rainfall conditions (Andersson, 1988). The inclusion of this routine did significantly improve the fits (Fig. 1). After the improvements of the drainage routines, the more physically realistic exponential rainfall interception routine was introduced into the used model and shown to be very well adopted to measured interception amounts, achieved by subtracting rainfall in troughs below the canopy from the rainfall amount collected in troughs in clearings in the Velen forest (Bringfelt & Hârsmar 1974). It was also necessary to secure that the descriptions of the amount and timing of snowmelt was accurate enough to give not only good SMD predictions but also reliable recharge rates. It was chosen to use the original snow routine from the HBV model, which has been excessively used in snow rich ares. This model includes refreezing and water retention in the snow pack. Snow interception is considered by the snowfall correction factor. Attempts were made to include a more physically based snow interception routine, but this did not improve the model predictions of neither runoff or SMD. The success of the temperature routine, shown by Andersson & Harding, was considered by including a temperature index, that reduced évapotranspiration rates until a certain number of days with five day average air temperatures below a threshold temperature had occurred. WATER FLOW ANALYSIS FOR THE VELEN BASIN The hydrological basin behaviour in the Velen basin was analyzed from SMD simulations, optimised against neutron probe field data from forest and grassland sites, including a deforestated site. The objectives was to test if the simple model used could be verified by other calculations and field measurements, to assess how, to what degree and during which weather conditions that various factors influenced spatial variations of soil moisture dynamics, and to assess if the local predictions of soil moisture dynamics could be used to analyze overall basin behaviour (Andersson 1988).
286
Spatiai variability of soil moisture dynamics Effects of vegetation Evapotranspiration and percolation rates from a grassland tube and two forest tubes at the site Sjôângen were simulated after that the SMD model had been optimised and verified against neutron probe soil moisture data, collected with a frequency that varied between a week and a month. The forest tubes were situated just a few metres apart, whereas the grassland tube was situated in a clearing, about 50 metres from the forest tubes. Topographic characteristics and soil texture were similar. In spite of this, considerable differences in the hydrological behaviour were indicated (Fig. 2). SMD modelling calibrated against readings from one of the forest tubes (Sjôângen 8) showed a limited reduction of the actual évapotranspiration in times of SMD whereas the rate of soil moisture depletion achieved from modelling calibrated from measurements from the other forest tube (Sjoangen 7) and from the grassland tube could be characterized by linear relationship between the amount of available water and the ratio between actual and potential évapotranspiration. HAY
JUN
JUL
AUG
SEP
OCI
NOV
MAY
JUN JUL
AUG SEP OCT
NOV
MAY
JUN
JUL
AUG SEP
OCT
NOV
Fig. 2 Simulated interception (unfilled), transpiration (dashed) and percolation (checkered) at Sjoangen. From left to right: Grassland, Sjoangen 7 and 8 (forest). From Andersson 1988 In spring, total évapotranspiration was largest from the forest, probably because of earlier initiation of photosynthetic activity and larger interception. During summer, the interception losses were partly compensated by the well known negative feed-back which reduces transpiration rates when water is intercepted. The largest difference of SMD's between the grassland and Sjoangen 7 occurred during autumns when it is probable that heavy rainfalls initiated macropore flow to a larger extent in the forest soil, and in addition, the forest évapotranspiration was higher due to interception. Recharge to field capacity was reached simultaneously at the forest stations, in spite of the larger SMD that occurred at one of them after prolonged periods of depletion. This was probably due to a heterogeneous distribution of the macroporosity, and hence the recharge rates. In summary, it was indicated that the distribution of living roots determined the relationship between actual and potential évapotranspiration, the distribution of decayed roots and other macropores determined the degree of recharge following a heavy rainfall in times of unsaturated soil conditions, and the variations in intercepted amounts affected the total evapotranspir-
287
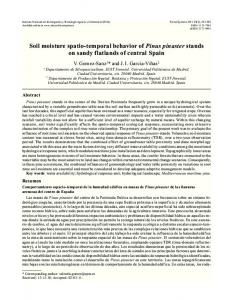
ation rates when transpiration demands were low. As earlier mentioned, one of the soil moisture measurement sites (Spekelâggen) was clear cut during the measurement period. By comparing measurements the groundwater level at this site with the average levels in the Velen basin (based on measurements from 30-40 wells and tubes in the area), it was concluded that the depth of the water table was decreased after the clear cut (Fig. 3). The effects on the soil moisture dynamics were studied by comparing the soil moisture observations made after the clear cut with model predictions, using an optimization against measurements achieved before the clear cut. It was shown that when parameters values, which gave a very good fit before the deforestation (1968-1970) were used for the period after the deforestation (1972-1973), significant underestimations of the soil moisture content was predicted. It was demonstrated that decreased interception could only explain a minor part of the increased soil wetness. If changes in the relationship between moisture depletion and the actual to potential évapotranspiration ratio was considered, the fit was significantly improved. /
200 -i
(= — n». J3
I id
UJ
n • *
T-7 t/1
r73 ~ O
O
u-|
0
1
1
1
1
1
1
50 100 150 Groundwater table (m) VELEN BASIN
1
i
200
Fig. 3 Relation between groundwater levels at Spekelâggen before (1968-1971) and after (1972-1974) deforestation achieved by regression against average levels in the Velen basin as a whole. From Andersson 1988 Effects of topography Observed soil moisture dynamics (1968-1970) from five forest sites were compared. The measurements were made comparative on basis of the relative amounts of available water in the top metre of the soil. Field capacity was defined as the water content at a soil pressure potential in equilibrium with the typical depth of the groundwater table during DecemberApril and wilting point as the water content at pF 4.2. During times with large amounts of snowmelt and after prolonged rainy periods, field capacity was exceeded at all sites, except the one (Ladfallet), that was situated in the highest parts of the basins and was very well drained. At one site (Spekelâggen) that was situated close the outflow from the basin, saturated conditions could be kept for prolonged times. It was shown, however, that sites which were very
288
wet, and probably acted as outflow areas during moist conditions did not always be the wettest after prolonged dry spells. During summer, other factors, like the type of root distribution and the water holding capacity, seemed to be the most important factors determining the dryness variability between the sites. Analysis of overall basin behaviour It has in the previous sections been argued that relatively simple models can describe moisture fluctuations at a site with good accuracy. However, is it possible to use these estimates to calculate recharge and évapotranspiration on a basin scale? Groundwater recharge and runoff formation Groundwater levels measured in the vicinity of the two forest tubes and the grassland tube at Sjoangen were similar to average levels in the Velen basin. These sites, earlier described in the "effects of vegetation" were therefore chosen to represent "average conditions". The technique to let point measurements represent moisture conditions and recharge for various parts of the basin (e.g. used by Moore & Clarke 1982) involves uncertainties, since spatial heterogeneity in system response may not be well reproduced by parameters that are supposed to represent averages for the most common landscape elements (e.g. Philip 1980). In the studied type of area, characterized by permeable and shallow soils, the runoff response from relatively small basins will be fast if the lake percentage is small. The Nolsjôn sub-basin covers 18.1 km and has a lake percentage of 1.5. In order to assess if it was realistic to let "typical" recharge rates represent basin recharge, basin percolation from Nolsjôn was simulated with the SMD model. The parameter values from Sjôângen were weighted so that open land (30%) was represented by the grassland calibration and forest (70%) by the mean of the recharge that was calculated with the two forest calibrations. The calculated recharge rates were shown to be very similar to those achieved with the PULSE-runoff model, optimised against observed runoff I
1968 J
F M A M J J A S
0
N D | J F " A
1969 " J
I
> . * . ? . . ..9.. ..N. ° • J
1970 f
" - A . .". J.
'. * , .? •?, ". . 9
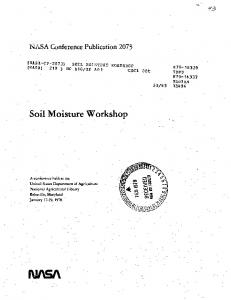
Fig. 4 Monthly percolation from the Nolsjôn basin simulated with the PULSE-runoff model (optimization from Bergstrôm et al., 1985) and with the SMD-model. From Andersson 1988
zsy
rates from the Nolsjon basin (Bergstrôm et al. 1985) (Fig. 4). At some occasions, the SMD model would probably even have given better estimates of the runoff. An example of this is the spring of 1969 when the PULSE-model underestimated the amount of runoff formation and larger percolation rates were predicted by the SMD model because of the introduction of the earlier described "temperature effect". Evapotranspiration regime Since the moisture condition at Sjôângen was assumed to be "typical" for the basin, it was suggested that the évapotranspiration, calculated with the SMD model calibrated against measurements from the three tubes at this site (Fig. 2) would be representative for average-basin évapotranspiration. Hie average of the two forest simulations was set to represent the forested part of the basin whereas the grassland tube represented the open land. For the lakes, evaporation was set equal to the potential, according to the Penman equation for water surfaces (Penman 1948). The weighted average of the évapotranspiration calculated with the SMD model was compared to basin évapotranspiration calculated from the residual in the water balance for the Velen basin (Waldenstrom 1977). The good agreement (Fig. 5) showed that basin évapotranspiration was well described by the model. Inclusion of the "temperature effect" and of the physically realistic interception routine were probably factors that contributed to this promising result. The fact that the amount of basin évapotranspiration seldom can be determined from direct measuremets makes this result especially interesting.
Fig. 5 Monthly évapotranspiration calculated from the water balance (Waldenstrom 1977) and from the SMD model. Water balance estimates for months without accurate soil moisture mesurements are shown as asteriks. From Andersson 1988 ACKNOWLEDGEMENTS Support was given by the Swedish Natural Science Research Council and by the Bank of Sweden Tercentenary Foundation. Part of the study was included in the project 6.1 of the Third Phase of the International Hydrological Programme, and carried out with assistance of Dr. Richard Harding during my stay at Institute of Hydrology, Wallingford, which was supported by a fellowship provided by the British Council.
290
REFERENCES Andersson, L. & Harding. RJ. Soil-moisture deficit simulations with models of varying complexity for forest and grassland sites in Sweden and the U.K. Submitted to / . Hydrol. Andersson, L. (1988) Hydrological analysis of basin behaviour from soil moisture data. Nordic Hydrol. 19,1-18. Bergstrôm, S., Carlsson, B., Sandberg G., & Maxe, L. (1985) Integrated modelling of runoff alkalinity and pH on a daily basis. Nordic Hydrol. 5, 89-104. Beven, K. (1985) Distributed models. In: Hydrological Forecasting, ( ed. by Anderson, T.P. & Burt, T.P.), 405-435. John Wiley & Sons Ltd., New York. Bringfelt, B. & Hârsmar, P.O. (1974). Rainfall interception in a forest in the Velen hydrological representative basin. Nordic Hydrol. 5,146-165. Calder, LR., Harding, RJ. & Rosier, P.T.W. (1983). An objective assessment of soil-moisture deficit models J . Hydrol. 60, 329-355. Danfors, E., Skoglund, E. & Thunvik, R. (1969). Techniques for processing and presentation of soil water data, Markvann, Nordic IHD report no. 2, Oslo, Norway. Eagleson, P.S. (1982) Ecological optimality in water-limited natural soil-vegetation systems. 1. Theory and hypothesis. Wat. Resour. Res. 18, 325-340. Moore, RJ. & Clarke, R.T. (1982) A distribution function approach to modelling basin soil moisture deficit and streamflow. Proc. of Int. Symp. of Rainfall-Runoff Mod,. Mississippi State Univ., USA. Penman, H.L. (1948) Natural evaporation from open water, bare soil and grass. Proc. R. Soc, London, ser. A. 193,120-146. Philip, J.R. (1980) Field heterogeneity: some basic issues, Wat. Resour. Res. 16, 443-448. Roberts, J.M. (1983) Forest transpiration: A conservative hydrological process? / . Hydrol. 66, 133-141. Waldenstrom, A. (1977) Slutrapport over hydrologiska undersokningar i Velens representativa omrâde (Final report on hydrological investigations in the Velen representative basin). HBV Report no. 28, Swedish Meteorological and Hydrological Institute, Norrkôping, Sweden.