or any iterative search in the parameter space, it is free from the problems of ... scissors [15] or JetStream [16], leaving behind a large background hole. .... In 3D, there are three possible types of inputs: unoriented, elementary curves, and.
JOURNAL OF INFORMATION SCIENCE AND ENGINEERING 26, 1029-1048 (2010)
Text Image Restoration using Adaptive Fuzzy Median Based on 3D Tensors and Iterative Voting* JONG-HYUN PARK, GERARD G. MEDIONI** AND GUEE-SANG LEE School of Electronics and Computer Engineering Chonnam National University Gwangju, 500-707 Korea ** Department of Computer Science University of Southern California Los Angeles, CA 90089-0781, U.S.A. This paper addresses the problem of efficient and effective restoration of text images, by formulating the problem as inferring the surface from a sparse and noisy point set in a 3D structure tensor space. Given a set of noisy data correspondence in corrupted images, the proposed method extracts good matches and rejects the noisy elements. The methodology is unconventional, since, unlike most other methods, it optimizes certain scalar, objective functions. Also, as the proposed approach does not involve initialization, or any iterative search in the parameter space, it is free from the problems of identifying only local optima or having poor convergence properties. Subject to the general restoration of natural images, the removal and restoration of corrupted regions is performed by 3D tensor voting based on a fuzzy median filter. In essence, the input set of matches is first transformed into a sparse 3D point set so that 3D tensor kernels can then be used to vote for the most salient surface that captures all inliers inherent in the input. Lastly the density estimation for detecting the center modes is performed as well as a clustering algorithm for segmenting the values according to the color components in the restored image. Experimental results are presented which show that the proposed approach is efficient and robust in terms of restoring and segmenting corrupted text images. Keywords: 2nd order 3D tensors, iterative voting, fuzzy median, restoration, segmentation
1. INTRODUCTION The human visual system enables us to make robust inference from corrupted and insufficient data in the form of images. A new approach is tested for extrapolating the shape and surface information of damaged regions, despite the presence of severe corruption and noise. This paper presents computational work to fill in missing geometry, shape and surface information in corrupted images, which shows encouraging results in 3D. No a priori complex scene or surface model is assumed in the tensor voting approach, which utilizes an adaptive continuity constraint in 3D. A description is given of how tensor voting can provide a robust and effective methodology to perform surface restoration, and then, image segmentation is performed to evaluate the results of the restored regions from improved text images. Image restoration and segmentation are frequently used as a preprocessing step in computer vision using natural scenes, and so it is important for the actual processing that is needed in analyzing images. A real scene image ofReceived July 10, 2008; revised December 31, 2008 & March 24, 2009; accepted June 18, 2009. Communicated by Pau-Choo Chung. * This work was supported by the Korea Research Foundation Grant funded by the Korean Government (KRF2008-313-D00999) and the MKE, Korea, under the ITRC support program supervised by the IITA (IITA-2009-C1090-0903-0008).
1029
1030
JONG-HYUN PARK, GERARD G. MEDIONI AND GUEE-SANG LEE
ten contains various forms of damage caused by noise, such as creaks, graffiti and streaks, which need to be removed. For testing purposes, corrupted text images in natural scenes are often used, in particular, text information in a natural scene is useful since it can provide important meanings [1-3]. The survey of related works to text segmentation and detection is given in [4-6]. However, existing methods do not explicitly take into account the fact that texts in natural scenes can be severely corrupted by noises. With noises, text may be segmented as separate objects due to strokes, causing errors when used as an input to optical character recognition (OCR) [6]. There have been numerous denoising algorithms, mostly based on spatial filtering or transform domain filters [7]. However, these approaches are not applicable to noises of creak, graffiti and streaks, which are different from conventional Gaussian or impulse noises [8-11]. Such non-conventional noises include top to bottom scratches along several film frames, long cracks in photographs, superimposed large graffito. Although the inpainting technique has been proposed to the restoration of damaged paintings and photographs [12-14], it is not adequate for handling noises in text images because it is mainly for the removal or replacement of manually selected objects. Nowadays, powerful photo-editing software and large varieties of retouching, painting and drawing tools are available to assist users to refine or redefine images manually. For example, a large foreground object can easily be outlined and removed by intelligent scissors [15] or JetStream [16], leaving behind a large background hole. Inpainting [13, 17] is an automatic approach to fill small regions by exploiting color and gradient components in the neighborhood of the corrupted region. It successfully restores images with little visual artifact. However, inpainting cannot handle situations whereby the pixels contain both information about the real data and various forms of noise (e.g., image plus noise as additive processes). The information is assumed to be mainly in the region surrounding the area to be inpainted so that the inpainting technique cannot be applied to images with additive noises. In this paper, a unified approach is proposed, to gather and analyze geometric information so as to synthesize pixel values in the corrupted regions. This is achieved by computing a tensor to encode the underlying points and color distribution in the geometry and color space respectively. Instead of simple neighboring color information, the robust non-iterative 3D tensor voting approach has been used to infer the most suitable pixel value in the neighborhood under fuzzy median filtering constraints. Missing data are synthesized by 3D tensor voting, which adapts to different features and texture scales. A separated clustering-based segmentation is utilized to partition images into different segmented regions. Tensor voting has been proposed by Medioni et al. in [18-21], and has been applied to diverse research fields such as the inference of object boundaries: as a consequence, its use can explain the presence of noise based on surface saliency in the image feature space. This noise can be removed by fuzzy median filters with tensor voting and the improved image is then segmented by a separated clustering method. The clustering algorithm requires parameters, such as the number of modes, which are generally not known a priori. An adaptive mean shift is used for automatic mode detection, and these modes are used as the seed values for the clustering algorithm and text images are finally segmented as uniform objects.
TEXT IMAGE RESTORATION AND TENSOR VOTING
1031
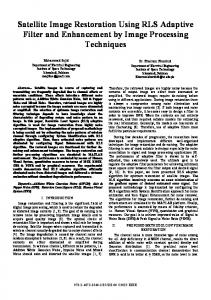
Fig. 1. The overall framework of the proposed method.
The rest of this paper is organized as follows: Section 2 gives an overview of the proposed method and section 3 discusses the extraction of chromatic and achromatic components from the image, for preprocessing. Second order symmetric 3D structure tensor is described in section 4. Section 5 then describes how tensor voting is used to analyze noise in an image and an adaptive median filter is applied to fill new values in noise corrupted regions. Also, a clustering algorithm for text segmentation is presented in section 5. Experimental results are presented in section 6. Finally, conclusions are drawn in the last section.
2. OVERVIEW OF THE METHOD In order to segment text images, Fig. 1 shows the overall 3D approach, in which “tensorization” and “densification” are implemented as 3D voting processes (the more general 3-dimensional tensor voting is described in section 4. A sparse 3D point, set as color and position, is “tensorized” into a discrete tensor field, which encodes the most preferred normal direction at each point. Then, this tensor field is locally “densified”, producing local dense structures suitable for detecting the extrema and from which the salient surface containing all good matches can be estimated. Regarding text regions in natural images, two problems are assumed: (1) an original character is homogeneous in color distribution because it is usually painted by one kind of color; (2) a character can be corrupted by noise due to changes in illumination, dirt, corrosion and graffiti. Images input to this method can be presented as achromatic components, pure color (no grayscale regions), or chromatic components with some number of regions. Chromatic components are better described using the hue elements of the pixels, whereas achromatic components are distinguished using intensity only. Each pixel must therefore be labeled as either chromatic or achromatic, to determine an appropriate feature (as hue or intensity in the HSI space) for analysis. As texts are almost homo-
JONG-HYUN PARK, GERARD G. MEDIONI AND GUEE-SANG LEE
1032
geneous in the appropriate feature space, the labeling process approximately divides the image into layers. Noise processes however cause deviations from the homogeneous surroundings and will therefore lie outside of the text layers. In the proposed approach, the tensor voting in 3D is used to extract the homogeneous layers as continuous components with high surface saliency, and to characterize noise as pixels with low surface saliency. Noise pixels are then removed by a fuzzy median filter. Finally, the improved images are segmented by use a clustering method. The mode detection method is described in section 5 and Fig. 1 shows the overall framework of the proposed method for text image restoration in natural scenes.
3. SEPARATION OF COLOR COMPONENTS As * There are many color models for processing color image [2, 22-24]. For pictures acquired by digital cameras, the most popular is the RGB model and according to the tristimulus theory, color can be represented by the three components, resulting from three separate color filters Sx, X = RGB, and on the light radiance E(λ) according to the equations:
R = ∫ E (λ ) S R (λ )d λ , G = ∫ E (λ ) SG (λ )d λ , B = ∫ E (λ ) S B (λ )d λ. λ
λ
λ
(1)
In image segmentation, reducing the dependence on changing in space lighting intensities is a desirable goal. There are many color models based on human color perception. For such models, refer to HSI, CIE L * u * v *, CIE L * a * b * and YUV [14]. Here, the HSI (Hue, Saturation and Intensity) space, converted from the RGB space of the input image, is used. In the HSI space, the numerical values about achromatic and chromatic regions can be adapted to the tensor voting, which originally classifies pixels into perceptual structures, based on the pixels’ orientation. Instead of finding the orientation of a pixel by edge orientation (or direction), the value of the hue component is used in the tensor voting. In addition, the intensity values are also represented, such as the angle of the hue components. Moreover, the hue components, which are determined by the reflective property of one object surface, are invariant to certain types of highlights, shading and shadows, providing considerable stability over the original RGB space analysis. In achromatic regions, the hue component may be unstable or meaningless, such as in a gray level region or pure grayscale image. In such achromatic regions, the intensity components are used for distinguishing objects in an image [25]. In general, natural color images consist of achromatic and chromatic regions. Using only the monochrome components for the segmentation can be unstable in low level computer vision. Therefore, a decision function is proposed for separating pixels as chromatic or achromatic, such that the appropriate features are used in the segmentation. The proposed method can separate the color components, based on the sum of differences, by using the R, G and B components that are independent of the illumination. The equation of the decision function is described as F (x, y) =
|R(x, y) − G(x, y)| + |G(x, y) − B(x, y)| + |R(x, y) − B(x, y)| . 3
(2)
TEXT IMAGE RESTORATION AND TENSOR VOTING
1033
If the F(x, y) value is small, the pixel is closer to the achromatic component. Otherwise, the pixel is chromatic. In algorithm 1, leaving a gap between two feature ranges prevents achromatic and chromatic regions overlapped during the clustering. In addition, the values near 0.6 and 1.0 are clustered as one mode, due to the cyclic property of the hue component. The final values corresponding to one image in the range [0 ~ 1], called the chromaticity labeled image, are applied to the tensor voting in 3D. Algorithm 1 Separating color components Step 1: Read input image; Step 2: If F(x, y) > TH1, F(x, y) = Hue(x, y); // chromatic components Else, F(x, y) = Int(x, y); // achromatic components Step 3: Achromatic components are normalized into the range 0.0 to 0.4; Chromatic components are normalized into the range 0.6 to 1.0; Step 4: Chromaticity labeled image from 0.0 to 1.0; In general, hue components are affected by both intensity and saturation components and this shows that saturation varies with illumination. It can be observed that some parts, as perceptually achromatic regions, have high saturation. Meanwhile, the sum in Eq. (1) is low in all achromatic regions and high in all chromatic regions. Moreover, it has been observed that a photograph by a digital camera should be analyzed depending on its perceptual property rather than the originally painted hue values. The level of chromaticity is proportional to F(x, y) in Eq. (2). A threshold value TH1 = 20 is used (determined heuristically) to classify pixels with RGB components in the range [0 ~ 255]. Values below TH1 are classified as being achromatic, and are analyzed using the intensity component Int(x, y) in the HSI space. The remaining pixels are chromatic, and are analyzed using the hue component Hue(x, y).
4. SECOND ORDER SYMMETRIC 3D STRUCTURE TENSORS This section briefly reviews the original second order symmetric tensor, and shows how it is augmented by second order representation and voting, that enables detection of the discontinuities or structure terminations in the data [18, 26]. Firstly, the representation is described, then the voting mechanism is illustrated, and the concept of voting fields, and how they are derived from the 2D second order fundamental stick field, is introduced. Tensor voting is a local method to aggregate and propagate the information in the image. An initial set of input tokens, at specific locations, broadcast their information in a fixed size neighborhood, by applying a “field” which encodes the local smoothness. All sites aggregate the received votes to produce a local estimate of structure, such as curves or surfaces. A local matching process can then extract the most salient structures. The tokens, in general, represent the position of elements such as points, curves, or surfaces, and can also convey other information, such as orientation of curves or surfaces. Tokens can be generated by processes that detect the presence of certain features, such as edges, corners, pixel correspondences or surface patches. Token generation is application specific, and the token used in the proposed algorithm denotes a point or a pixel with its intensity or hue value.
JONG-HYUN PARK, GERARD G. MEDIONI AND GUEE-SANG LEE
1034
4.1 Data Representation by Second Order Symmetric 3D Structure Tensors The focus for this work is the perceptual organization of the generic tokens where each token represents the potential presence of a perceptual structure at its position. The representation of a token consists of a second order symmetric tensor that encodes saliency, and a vector that encodes polarity. The tensor essentially indicates the saliency of each type of perceptual structure the token belongs to and its preferred normal and tangent orientations. The polarity vector, on the other hand, encodes the likelihood of the token being on the boundary of a perceptual structure. In 3D, there are three possible types of inputs: unoriented, elementary curves, and elementary surfaces. Unoriented inputs are the most general case, have no preference of orientation, and the type of structure they may belong to can only be inferred based on the configuration of their neighbors. Their representation should be isotropic with respect to orientation. Here, oriented tokens are represented with their normals instead of their tangents. Therefore, an elementary surface patch is encoded with a tensor that is aligned with the patch’s normal. A curved element, on the other hand, has a set of normals that span a 2D subspace in 3D space. The curve’s tangent is orthogonal to this subspace. The curves are represented by a tensor that is orthogonal to its tangent, therefore belonging to the normal subspace. These tensors are presented in the following paragraphs. The first order representation for all cases is initialized to zero, since no a-priori information is available. In this case, input tokens are first encoded as 3D ball tensors in a 3-dimensional space (x, y, value of position in a chromaticity labeled image). These initial tensors communicate with each other to understand the most preferred orientation information at each position. The votes are accumulated at all positions by tensor addition based on the voting field. The result of one position is given in matrix form by: ⎡λ1 T = ⎢⎢ 0 ⎢⎣ 0
0
λ2 0
0⎤ 0 ⎥⎥ ; λ3 ⎥⎦
T = λ1eˆ1eˆ1T + λ2 eˆ2 eˆ2T + λ3 eˆ3 eˆ3T .
(3)
(4)
Rearranging the eigen system, the ellipsoid is given by
T = (λ1 − λ2 ) S + (λ2 − λ3 ) P + λ3 B,
(5)
where S defines a stick tensor, P defines a plate tensor and B defines a ball tensor:
S = eˆ1eˆ1T , P = eˆ1eˆ1T + eˆ2 eˆ2T , and B = eˆ1eˆ1T + eˆ2 eˆ2T + eˆ3eˆ3T . Note that the eigenvalues are nonnegative since the tensor is nonnegative definite. For instance, when λ1 = 1, λ2 = λ3 = 0, only the first term in Eq. (5) remains, which corresponds to a degenerate elongated ellipsoid, termed hereafter the stick tensor, that represents an elementary surface token with ê1 as its surface normal. When λ1 = λ2 = 1, λ3 = 0,
TEXT IMAGE RESTORATION AND TENSOR VOTING
1035
only the second term remains, which corresponds to a degenerate disk-shaped ellipsoid, termed hereafter the plate tensor, that represents a curve (or a surface intersection) with ê3 as its tangent or, in other words, with ê1 and ê2 as the two normals that span the subspace of orientations that are orthogonal to the curve. Finally, when all the eigenvalues are equal, only the third term remains, this corresponds to a sphere, termed the ball tensor, which corresponds to an unoriented token, which can be a volume inlier or a junction. The size of the tensor indicates the certainty of the information represented by the tensor. A generic tensor can be decomposed, as in Eq. (5), and each type of saliency can be evaluated. The size of the stick component (λ1 − λ2) indicates surface saliency, the size of the plate component (λ2 − λ3) indicates curve saliency, and that of the ball component (λ3) junction or volume saliency. The shape of the tensor defines the geometric information (point, curve, or surface elements), and its size represents the saliency. In 3D space, a surface is represented by a tensor in the shape of an elongated ellipsoid (stick tensor) with its major axis along the surface normal. A curve is represented by a tensor in the shape of a flat ellipsoid (plate tensor) that is perpendicular to the curve’s tangent. An isolated point has no orientation preference and is represented by a tensor in the shape of a spherical ellipsoid (ball tensor). In this paper, an input token is a point with its hue or intensity value and hence the tensors can be initialized as balls with no preference of orientation. Since the noise of the text image used here, such as creaks, graffiti and streaks, is for non-surface elements, e.g. dots or curves, the surface saliency of the token needs to be computed. A surface is represented by a stick tensor in 3D space, and the size of the stick component (λ1 − λ2) defines the surface saliency. 4.2 Tensor Voting
Each input token votes, or is made to align, with precomputed, discrete versions of the basis tensors in a convolution-like way, propagating the preferred direction in a neighborhood. These precomputed basis tensors are known as voting fields. As a result, the preferred orientation information is propagated and gathered at each input site. This voting process consists of two phases: − Token refinement: the tensor votes are collected at the input sites. − Dense extrapolation: the tensor votes fill the volume for the feature extraction.
Given a set of input tokens, they are first encoded as tensors. These initial tensors communicate with each other by token refinement and dense extrapolation. In essence, token refinement entails each token collecting all the tensor values cast at its location by all the other tokens in a neighborhood. The resulting tensor value is the tensor sum of all the tensor votes cast at the token location. In dense extrapolation, each token is first decomposed into its corresponding elements. By using an appropriate voting field, each token broadcasts the information in a neighborhood, the size of which is given by the size of the voting field used. As a result, a tensor value is placed at every location in the neighborhood. The resulting dense information can be used for feature extraction in which the first derivatives are computed. In general, the input tokens encoded as tensors cast votes to their neighborhood
1036
JONG-HYUN PARK, GERARD G. MEDIONI AND GUEE-SANG LEE
through a voting kernel or a decay function, as indicated in Eq. (6). The voting field explains how the tokens relate their information, such as orientation and magnitude, to their neighborhood in order to ensure smooth continuation. In spherical coordinates, the decay of the fundamental 2D stick field takes the following form: DF(s, k, σ) = e
−( s
2 +ck 2 ) σ2
, s=
2sin(θ ) lθ ,k= . sin(θ ) l
(6)
The parameter s is the arc length OP, k is the curvature, c is a constant, and σ is the scale of the voting field controlling the size of the voting neighborhood, and the strength of votes, as seen in Fig. 2, which also shows that the orientation of the stick vote is normal to the smoothest circular path connecting the voter and the receiver.
Fig. 2. The generation of the tensor voting field in 3D space.
Note that the connection, as given by the osculating circle, becomes less likely if the uur angle subtended by N and OP is less than 45°. Therefore, only the set of orientations for which the angle defined above is not less than 45°. Now that the most likely type of feature at each token has been estimated, the dense structures that can be inferred from the tokens can now be computed. This can be achieved by casting votes to all locations, whether they contain a token or not, using the same voting fields and voting mechanism. Then each site contains two features, the indicating feature saliency and its direction. A smooth structure can be inferred, that connects the tokens with high feature saliencies, computed by using λ2 − λ3 for the surface saliency. Given this dense information, in 3D space, true surface points are analyzed and connected. The feature analysis, based on tensor voting for corrupted text images, is detailed in the next section.
5. RESTORATION BASED ON ADAPTIVE FUZZY MEDICAN FILTER AND ITERATIVE VOTING In this section, the 3D version is specialized and applied to the analysis of corrupted text images. The transforming of each match is described, as in section 4, into a point in the 3D space of tensor voting. Then the following subsections are performed, which are depicted as shaded processes in the flowchart of Fig. 1. 5.1 Tensor Representation and Analysis of Corrupted Text Images
In general, texts are made to appear as regions of homogeneous color. However, the
TEXT IMAGE RESTORATION AND TENSOR VOTING
1037
image may also be noisy, as the physical surface of the sign degrades due to corrosion, dirt, intentional defacing, etc. Noise features caused by processes such as cracks or graffiti are more inhomogeneous, so that the corrupted regions comprise severely different values. Even though the corrupted regions appear to have similar values, their region size is small. In the experiments performed to test the research, a color image, with a size of 256 × 256, has been used. Corrupted regions can be regarded as smaller than 10 × 10 (this can be adjusted according to image size), and the size of texts by experimental experiences. The same result is achieved by tensor voting. In order to perform the tensor voting procedure, tokens of input data can be represented as [x, y, F(x, y)]. Here, x and y indicate the position in the image and F(x, y) is the token value in Eq. (2), which corresponds to the position in a labeled image. Each 3D point, which corresponds to a potential match, is first encoded as a 3D ball tensor. Then, these input balls communicate with each other, propagating ball votes in a neighborhood. After each input site has collected all the 3D tensor votes in its neighborhood, the resulting tensor is decomposed into the corresponding three components. Since a surface is to be inferred, the 3D ball component is discarded as it corresponds to surface information, which should not be propagated in the dense voting stage. 5.2 Analysis of Corrupted Region by Tensor Voting
After the input has been tensorized, the stick component at each input tensor is made to align with the 3D stick voting field to obtain a densified structure {(s, nˆ )}, which indicates surfaceness. A dense vector field encodes the surface normals nˆ associated with saliency values s. To illustrate, suppose the dense structure as obtained after the dense extrapolation stage, or densification, is dense and continuous, i.e., {(s, nˆ )} is defined for every position in the corrupted text image. In corrupted text images, it has been observed that noise or corrupted regions are shown in homogeneous components smaller than 10 × 10. From such an observation, and the experimental data shown in Fig. 3 (a), it has been found that the threshold (THt) can be selected between [0 ~ 2.87] (here THt = 1.0 is used) when the maximum value of surface saliency in a given image is 4.29 based on σ = 8. In addition, if the value of a selected threshold is close to 0, the noise occupying broad homogeneous regions may not be removed clearly, and then the remaining noise can be removed through some iterations.
(a) Natural image. (b) Surface saliency of each position. Fig. 3. Experimental result of the surface saliency after tensor voting.
1038
JONG-HYUN PARK, GERARD G. MEDIONI AND GUEE-SANG LEE
After tensor voting, as described in Fig. 4 (b), a “surface saliency map” defines the surface saliency at every pixel in a given image. The map is able to indicate the presence of noise on characters, as seen in Fig. 4 (c), by the white regions which can be replaced by applying an adaptive fuzzy median filter to the saliency information.
(a) (b) (c) Fig. 4. The result by tensor voting in a real image; (a) Corrupted image; (b) The data in the tensor voting framework where a red circle indicates noises; (c) Normalized representation of surface saliency map in the range [0 ~ 255].
5.3 Iterative Image Restoration Using an Adaptive Fuzzy Median Filter
A surface saliency map for the input image is generated by tensor voting. In the salient surface map, low surface saliency regions are primarily considered as noise, and should be replaced with values of the high surface saliency neighbors. This section describes a novel approach for smoothing the surface, using a fuzzy median filter in noise corrupted regions. Median and order statistic-based filters are extensively used in signal processing, especially in image processing, due to their ability to reject outliers and preserve important features, such as edges or monotonic regions. Although the median filter is widely used in many practical applications due to its effectiveness in preserving the information structures, it is advantageous to introduce some weighted averaging of the samples, particularly among similarly valued samples. Moreover, the information regarding the spread of samples is not taken into account. Utilizing the techniques of fuzzy set theory, fuzzy order statistics [27-29] have been developed to address these drawbacks and further developed into the fuzzy median filtering [30]. The fuzzy methods allow real-valued relations between samples, where these can be set as a function of the sample spread. A real-valued fuzzy membership function is denoted by μ R% (a, b) : ℜ × ℜ a [0, 1], where a and b are samples. The relation function μ R% (a, b) can be any shape that reflects the most relevant information between samples for the problem at hand. While a wide range of fuzzy membership functions can be defined, the following constraints are commonly imposed [30]:
lim|a −b|→0 μ R% (a, b) = 1 lim|a −b|→∞ μ R% (a, b) = 0
(7)
a1 − b1 ≤ a2 − b2 ⇒ μ R% (a1 , b1 ) ≥ μ R% (a2 , b2 ). The intuitive justification for these constraints is that two identical samples should have relation 1, while the relation of two infinitely distant samples should be 0. Addi-
TEXT IMAGE RESTORATION AND TENSOR VOTING
1039
tionally, the relation between samples should increase as the distance between them decreases. Many membership functions, such as rectangular and triangular membership functions, satisfy these constraints. The commonly used Gaussian membership function can be found in [30], and used in this research:
μG(a, b) = e−(a−b)2/2σ2,
(8)
where σ > 0 ∈ ℜ controls the spread of the membership function. The fuzzy relation μ R% (a, b) can be considered as a generalization of the crisp relation μC(a, b), ⎧1, ⎩0,
μC(a, b) = a ∩ b = ⎨
a=b a ≠ b.
(9)
Note that the crisp relation is a simple AND operator, while the fuzzy relation operates on the sample spread. For an observation window Ω = {x1, x2, …, xN ∈ ℜ}, the output of the fuzzy median filter is defined as
∑ xi R%i, (δ ) = i =N1 ∑ i =1 R%i, (δ ) N
xFM
(10)
where R%i ,(δ ) = μ R% ( xi , x(δ ) ) is the fuzzy relation between xi and x(δ) where x(δ) is the classical median, i.e., δ = (N + 1)/2. Using the median, instead of the center sample, as the reference point to compute filter weights, yields a fuzzy median filter that is more robust to noise than the center sample [30]. The fuzzy median preserves the edge transitions while performing more effective noise smoothing. These characteristics are the result of averaging, based on the membership function measuring relations among samples. Namely, in uniform regions, all samples are likely to have strong memberships with the median, resulting in effective averaging of the additive noise. Conversely, the use of the membership function at edge transitions ensures that only samples on the majority side of the edge have significant weights, thus disregarding samples on the minority side. If a pixel is judged to be noisy from the tensor voting analysis, neighbors surrounding the pixel in a (3 × 3) window are initially examined to find high surface saliency with which to replace the value in the pixel. If the noise region is broad, however, the 3 × 3 window may be insufficient to find the high surface saliency as defined by THt. The size of the window ((m + s) × (n + v)) is therefore increased until the proper number of high surface saliency pixels is detected. Then, a value is selected from the high surface saliency pixels within the final window. This process removes noise on the text and background regions, making text region segmentation more effective for text recognition. The steps below represent the detailed process of this adaptive fuzzy median filter. Fig. 5 shows an example of the restoration in a corrupted text image, using the steps in Table 1 and Fig. 5 (a) shows the results after the tensor voting. The noise aspects are shown as the black regions in the image and the remaining pixels are described by the values of labeled chromaticity images. Fig. 5 (b) shows the rough shape at the boundaries of the texts. On the other hand, Fig. 5 (c) shows the result at the boundaries of the texts
1040
JONG-HYUN PARK, GERARD G. MEDIONI AND GUEE-SANG LEE
(a) (b) (c) Fig. 5. Restoration of corrupted regions by using an adaptive fuzzy median filter; (a) Saliency map image by tensor voting; (b) The resulting image after the first fuzzy median filtering; (c) The resulting image after the second fuzzy median filtering.
Table 1. Corrupted region restoration using adaptive fuzzy median filter. // It uses adaptive FUZZY MEDIAN FILTER to compute the most likely normal region at the token. Then ball tensors are computed by integrating the resulting normal votes cast by voter. Let F(x, y) be the pixel value computed by Eq. (2) of the input image and Fnew(x, y) be the pixel value computed by applying the fuzzy median filter. S(x, y) denotes the surface saliency computed from tensor voting. // Step1: Compute the surface saliency in the (m + s) × (n + v) window surrounding the noise pixel. S(x, y), 1 ≤ x ≤ m + s, 1 ≤ y ≤ n + v (as an initial value, m = n = 3 and s = v = 0.) // The number of high surface saliency pixels in the window. // IF (S(x, y) ≥ THt) count = count + 1; (here, THt = 1.0) // The window size is changed for adaptive fuzzy median filter. // IF (count < THc) s = s + 2, v = v + 2, Goto Step 1 (here, THc = 8.) ELSE, Goto Step 2 Step2: Enumerate values of pixels corresponding to high surface saliency in the increased window: // Let window Ω{x1, x2, …, xN} be of size (m + s) × (n + v) and centered at (x, y). // Let XFM denote the result of applying the fuzzy median filter to Ω as shown in Eq. (10). Fnew(x, y) = XFM, 1 ≤ x ≤ m + s, 1 ≤ y ≤ n + v
after the second tensor voting. Namely, the first iteration of the proposed method does not find pixels corresponding to high surface saliency. From the iterative procedure, the candidate positions of the pixels can be made, while the values in the candidate positions are enumerated. The fuzzy median value among them is used to replace the corrupted regions. 5.4 Image Segmentation by Separate Clustering
When tensor voting and fuzzy median filtering have been applied, the image has been mostly recovered from noises. But, the resulting image is composed of pixels with gray level values, i.e., the text region is not segmented from the background. This section describes how the text can be segmented by clustering, for the evaluation of the results of
TEXT IMAGE RESTORATION AND TENSOR VOTING
1041
text restoration obtained in the previous step. The segmentation result should be given as a set of clusters and each cluster is composed of a group of pixels corresponding to the connected component of each text stroke or one of background patches. The segmentation is carried out by k-means clustering. Since the pixel values are separated as chromatic or achromatic components as shown in section 3, the clustering method exploits the properties of those components. Two different k-means clustering algorithms are used because the achromatic, or intensity, values are linearly scaled, while the chromatic, or hue, values are characterized with the cyclic property. Fig. 6 shows the proposed method using separate k-means clustering, which is applied to the values in the improved text image II(x, y) in order to segment text from the background. In the case of achromatic components, the intensity value falls within the range of [0.0 ~ 0.4] and the Euclidean distance to the seed value in the same range is computed for the clustering. In the case of chromatic components, the hue value falls within the range of [0.6 ~ 1.0] and the k-means clustering is performed by considering the cyclic property of the chromatic components. Since hue is represented by a circular region, the start point and the end point indicates the same color. Therefore the values near the minimum of (0.6) and the maximum of (1.0) in the hue range [0.6 ~ 1.0] should be clustered as the same mode. Details on the use of the cyclic property in the clustering can be found in [25].
Fig. 6. The proposed segmentation scheme using the separated k-means algorithm.
6. EXPERIMENTAL RESULTS The proposed method has been applied for segmenting corrupted color images. The images are corrupted by various noise processes. In order to perform segmentation, text regions are manually captured from natural images, which are corrupted by noise such as graffiti, streaks and overlapping. To experimentally test the proposed method, a number of pictures have been acquired using a digital camera, and images selected from the ICDAR dataset are also used [31]. Fig. 7 shows the experimental results of the new proposed method. The images contain some corruptions and confusions on the text regions, which can typically cause
1042
JONG-HYUN PARK, GERARD G. MEDIONI AND GUEE-SANG LEE
(a) Corrupted text images.
(b) Segmented images. Fig. 7. The results by the new proposed method.
(a) Original natural scenes.
(b) Segmented image. Fig. 8. Examples of experimental results primarily containing achromatic regions.
problems when using the text images for image segmentation. The results show that the proposed method considers the corrupted parts in the textual regions as well as remove the noise. In Fig. 8, it can be seen that the proposed approach handles corrupted images, such as graffiti (a), overlapping (b) and separated text (c). The given images are corrupted in a more complex type, as texts are often damaged by graffiti, overlapping and separation. These noise effects have to be removed as in the previous preprocessing step. In the result, although the boundary of the text region is not smooth, the tests verify that uniform regions are created about the textual objects. Fig. 9 compares the proposed method with a state-of-art segmentation method of EDISON [32] and median filter + EDISON. Here, the EDISON is performed after median filtering for noise removal. In order to experiment on the segmentation in complex
TEXT IMAGE RESTORATION AND TENSOR VOTING
1043
(a) (b) (c) (d) Fig. 9. The comparison with an existent segmentation approach; (a) Corrupted text images; (b) Results via EDISON; (c) Results segmented by EDISON after median filtering; (d) Results by new proposed approach.
Table 2. Description of the images used in Fig. 9. 1st image 2nd image 3rd image 4th image
Scratched image using a pencil tool in Photoshop tool. Textured and scratched image using a pencil and texture tools in Photoshop tool. Textured and Gaussian noise of 10% added by Photoshop tool. Textured and Gaussian noise of 30% added by Photoshop tool.
images, four images have been corrupted using the PHOTOSHOP tool on the original images. The description of the used images is presented in Fig. 9. The proposed method performs a good segmentation on the region of text objects, whereas the conventional EDISON algorithm and median filter and the EDISON method degrade them. The background and textual regions are regarded as the same region in the segmented result of the proposed method in complex noisy regions, while the segmentation of the EDISON contains many small regions.
JONG-HYUN PARK, GERARD G. MEDIONI AND GUEE-SANG LEE
1044
(a) Corrupted Images
(b) Ground truth images
(c) Median + EDISON
(d) Proposed method
Fig. 10. Performance comparison of the new approach to other segmentations or tools; (a) Corrupted images; (b) Ground truth to assess the performance; (c) Errors of median + EDISON; (d) Errors of the proposed method (FP: white, MD: black).
Finally, Fig. 10 shows a comparison of the proposed approach to two other segmentation methods, in respect of the error rates. Fig. 10 (a) illustrates the image data extracted from the original natural scenes, and Fig. 10 (b) shows the results of the segmentation in manually labeled ground truth images. Compared to the results segmented by the separated clustering method, errors are indicated as both FP and MD in Figs. 10 (c) and 10 (d). FP (false positive) indicates that background pixels have been classified as character pixels in a segmented image, and MD (missing detection) indicates that character pixels have been classified as background pixels, or noise values in a segmented image. The result of the proposed approach shows the lowest error rate among the 3 approaches. To show the error rate (ER) as one numerical value, the similarity between the results segmented from the ground truth images and original noisy images have been calculated by:
TEXT IMAGE RESTORATION AND TENSOR VOTING
Similarity =
segmented_result_in_corrupted_image I ground_truth_image , segmented_result_in_corrupted_image U ground_truth_image
ER(%) = [1 − Similarity] × 100.
1045
(11) (12)
Similarity in Eq. (12) measures the ratio of pixels with the same assignment in the ground truth, and the results achieved by the proposed approach. Exact matching and nomatching have an ER of 0% and 100% respectively. Table 3 shows the statistical data of the ER. The experimental results by using the proposed approach is the closest to 0% in Table 3, showing that it has performed better segmentation, potentially improving accuracy and reducing the computational complexity of OCR algorithms. Also, the proposed method provides a superior segmentation through significantly reducing the noise aspects from the damaged textual images. Table 3. Performance comparison of four approaches with error rates (ER) in Fig. 10 (a). 1st image 2nd image 3rd image
Proposed Method (%) 10.55 2.10 0.99
EDISON (%) 35.61 26.69 29.38
Median + EDISON 11.28 1.78 5.33
4. CONCLUSIONS A new approach for restoring and segmenting corrupted text images has been presented. The method presented associates with the second order tensor fields based on a fuzzy median filter and the separated clustering method. Data in the given images have been considered by the chromatic and achromatic features. Selected data has been described with tokens by second order tensor fields, which can detect the presence of noise such as cracks or graffiti in corrupted textual images. A fuzzy median filter provides proper values to replace the noise values, which are present on textual regions in the images. Finally, the restored image is clustered by a separated k-means method with an adaptive mean shift to find the proper modes. The proposed approach can significantly eliminate various noise effects while segmenting the text as one object. The results can contribute to restoring damaged regions as well as eliminating noise in corrupted textual images.
REFERENCES 1. D. Chen, H. Bourlard, and J. P. Thiran, “Text identification in complex background using SVM,” in Proceedings of International Conference on Computer Vision and Pattern Recognition, Vol. 2, 2001, pp. 621-626. 2. Y. Zhong, K. Karu, and A. K. Jain, “Locating text in complex color images,” Pattern Recognition, Vol. 28, 1995, pp. 1523-1536. 3. K. Jain and B. Yu, “Automatic text location in images and video frames,” Pattern
1046
JONG-HYUN PARK, GERARD G. MEDIONI AND GUEE-SANG LEE
Recognition, Vol. 31, 1998, pp. 2055-2076. 4. I. Haritaoglu, “Scene text extraction and translation for handheld devices,” in Proceedings of IEEE Conference on Computer Vision and Pattern Recognition, 2001, pp. 408-413. 5. J. Zhang, X. Chen, J. Yang, and A. Waibel, “A PDA-based sign translator,” in Proceedings of IEEE International Conference on Multimodal Interfaces, 2002, pp. 217-222. 6. S. M. Lucas, A. Panaretos, L. Sosa, A. Tang, S. Wong, and R. Young, “ICDAR 2003 robust reading competitions,” in Proceedings of IEEE International Conference on Document Analysis and Recognition, 2003, pp. 682-687. 7. M. Motwani, M. Gadiya, R. Motwani, and F. C. Harris, “A survey of image denoising techniques,” in Proceedings of International Signal Processing Conference of GSPx, 2004. 8. R. C. Gonzalez and P. Wintz, Digital Image Procesing, Addison Wesley, Reading, MA, 1977. 9. J. S. Lim, Two-Dimensional Signal and Image Processing, Prentice Hall, Englewood Cliffs, NJ, 1999. 10. H. Kaiqi, W. Zhenyang, and W. Qiao, “Image enhancement based on the statistics of visual representation,” Image and Vision Computing, Vol. 23, 2005, pp. 51-57. 11. M. Bertalmio, A. L. Bertozzi, and G. Spapiro, “Navier-stokes, fluid dynamics, and image and video inpainting,” in Proceedings of IEEE International Conference on Computer Vision and Pattern Recognition, 2001, pp. 1-9. 12. C. Braverman, Photoshop Retouching Handbook, IDG Books Worldwide, Foster City, California, London, 1998. 13. M. Bertalmoi, G. Sapiro, V. Caselles, and C. Ballester, “Image inpainting,” in Proceedings of SIGGRAPH, 2000, pp. 1-8. 14. A. Criminisi, P. Perez, and K. Toyama, “Object removal by exemplar-based inpainting,” in Proceedings of IEEE International Conference on Computer Vision and Pattern Recognition, Vol. 2, 2003, pp. 721-728. 15. E. N. Mortensen and W. A. Barrett, “Intelligent scissors for image composition,” in Proceedings of the 22nd Annual Conference on Computer Graphics and Interactive Techniques, 1995, pp. 191-198. 16. P. Perez, A. Blake, and M. Gangnet, “Jetstream: probabilistic contour extraction with particles,” in Proceedings of International Conference on Computer Vision, Vol. 2, 2001, pp. 524-531. 17. T. Chan and J. Shen, “Non-texture inpaintings by curvature-driven diffusions,” Technical Report 00-35, Department of Mathematics, University of California at Los Angeles, 2000. 18. G. Medioni, M. S. Lee, and C. K. Tang, A Computational Framework for Segmentation and Grouping, Elsevier, Amsterdam, 2000. 19. M. S. Lee and G. Medioni, “Grouping ., -, →, 0-, into regions, curves, and junctions,” Computer Vision and Image Understanding, Vol. 76, 1999, pp. 54-69. 20. J. Jia and C. K. Tang, “Inference of segmented color and texture description by tensor voting,” IEEE Transactions on Pattern Analysis and Machine Intelligence, Vol. 26, 2004, pp. 771-786. 21. W. S. Tong, C. K. Tang, P. Mordohai, and G. Medioni, “First order augmentation to
TEXT IMAGE RESTORATION AND TENSOR VOTING
22. 23. 24. 25. 26. 27. 28. 29. 30. 31. 32.
1047
tensor voting for boundary inference and multiscale analysis in 3D,” IEEE Transactions on Pattern Analysis and Machine Intelligence, Vol. 26, 2004, pp. 569-611. N. R. Pal and S. K. Pal, “A review on image segmentation techniques,” Pattern Recognition, Vol. 26, 1993, pp. 1277-1294. X. Jie and S. P. Fei, “Natural color image segmentation,” in Proceedings of IEEE International Conference on Image Processing, Vol. 1, 2003, pp. 14-17. H. D. Cheng, X. H. Jiang, Y. Sun, and J. Wang, “Color image segmentation: advances and prospects,” Pattern Recognition, Vol. 34, 2001, pp. 2259-2281. C. Zhang and P. Wang, “A new method of color image segmentation based on intensity and hue clustering,” in Proceedings of IEEE International Conference on Pattern Recognition, Vol. 3, 2000, pp. 3617-3621. J. Jia and C. K. Tang, “Image repairing: robust image synthesis by adaptive ND tensor voting,” IEEE Computer Vision and Pattern Recognition, Vol. 1, 2003, pp. 643-650. A. Flaig, K. E. Barner, and G. R. Arce, “Fuzzy ranking: theory and applications,” Signal Processing, Special Issue on Fuzzy Processing, Vol. 80, 2000, pp. 2849-2852. K. E. Barner and R. Hardie, Spatial-Rank Order Selection Filters, Nonlinear Image Processing, Academic Press, San Diego, 2001, pp. 69-110. K. E. Barner, “Fuzzy theory, methods, and applications in nonlinear signal processing,” Signal, Image, and Speech Processing, Vol. 3, 2003, pp. 49-101. Y. Shen and K. E. Barner, “Fuzzy vector median-based surface smoothing,” IEEE Transactions on Visualization and Computer Graphics, Vol. 10, 2004, pp. 252-265. ICDAR Competitions, http://algoval.essex.ac.uk/icdar/Datasets.html. D. Comaniciu and P. Meer, “Mean shift: A robust approach towards feature space analysis,” IEEE Transactions on Pattern Analysis and Machine Intelligence, Vol. 24, 2001, pp. 1-18. Jong-Hyun Park received the M.S. and Ph.D. degrees in Electronics Engineering from Mokpo National University, Korea, in 1997 and 2001, respectively. He researched as a Postdoctoral fellowship in Computer Science from Chonbuk National University from 2003 to 2004. He was a visiting scholar in Computer Science from University of Southern California (USC), Los Angeles, California, in 2004 and 2006. He is currently a Research Processor of the School of Electronics and Computer Engineering in Chonnam National University. His research interests include low to mid-level visions such as segmentation, shape analysis, pattern recognition, medical image processing, computer vision and mobile system application. Gerard G. Medioni received the Diplome d’Ingenieur Civil from the Ecole Nationale Superieure des Telecommunications, Paris, France, in 1977 and the M.S. and Ph.D. degrees in Computer Science from the University of Southern California, Los Angeles, in 1980 and 1983, respectively. He has been with
1048
JONG-HYUN PARK, GERARD G. MEDIONI AND GUEE-SANG LEE
USC since 1983, where he is currently a Professor of Computer Science and Electrical Engineering, codirector of the Computer Vision Laboratory, and chairman of the Computer Science Department. He was a visiting scientist at INRIA Sophia Antipolis in 1993 and chief technical officer of Geometrix, Inc. during his sabbatical leave in 2000. His research interests cover a broad spectrum of the computer vision field and he has studied techniques for edge detection, perceptual grouping, shape description, stereo analysis, range image understanding, image to map correspondence, object recognition, and image sequence analysis. Guee-Sang Lee received the B.S. degree in Electrical Engineering and the M.S. degree in Computer Engineering from Seoul National University, Korea in 1980 and 1982, respectively. He received the Ph.D. degree in Computer Science from Pennsylvania State University in 1991. He is currently a Professor of the Department of Electronics and Computer Engineering in Chonnam National University, Korea. His research interests are mainly in the field of image processing, computer vision and video technology.