Email: {firstname.lastname}@unifr.ch ... step, an algorithm takes the layout recognition results as an input, ... First, a layout analysis is performed to recognize.
2013 12th International Conference on Document Analysis and Recognition
Text Line Extraction using DMLP Classifiers for Historical Manuscripts Micheal Baechler, Marcus Liwicki, and Rolf Ingold DIVA Group, Department of Informatics, University of Fribourg, Switzerland Email: {firstname.lastname}@unifr.ch Abstract—This paper proposes a novel text line extraction method for historical documents. The method works in two steps. In the first step, layout analysis is performed to recognize the physical structure of a given document using a classification technique, more precisely the pixels of a coloured document image are classified into five classes: text-block, core-text-line, decoration, background, and periphery. This layout recognition is achieved by a cascade of two Dynamic Multilayer Perceptron (DMLP) classifiers and works without binarisation. In the second step, an algorithm takes the layout recognition results as an input, extracts the text lines, and groups them into blocks using the connected components approach. Finally, the algorithm refines the boundaries of the text lines using the binary image and the layout recognition results. Our system is evaluated on three historical manuscripts with a test set of 49 pages. The best obtained hit rate for text lines is 96.3%.
I.
I NTRODUCTION
The last decade has witnessed increasing activities in the digital libraries field to preserve historical manuscripts and to offer public access for these manuscripts through Internet. The work on this paper is motivated by the HisDoc project [1] which aims to exploit such manuscript images and transform them into a searchable electronic text edition. The HisDoc Project is composed of three modules: the layout analysis module extracts text line images, the recognition module transcribes these images into text, and the information retrieval module performs a robust text search engine on transcription result. This paper relates to the first module and describes a novel text line extraction method. The literature proposes various document image segmentation techniques. A general survey about text line segmentation techniques is provided by Likforman-Sulem et al. [2]. Wellknown segmentation techniques for documents are the Projection Profile Algorithm [3], [4], [5], Hough Transformation [6], [7], and Run Length Smoothing Algorithm [8], [9]. Recently, several approaches differing from the classic techniques have been proposed. Zhong and Cheriet [10] identified the text-block by using Gabor filters as features. Their method starts by dividing the document image into patches. Then it computes Gabor features for each patch and reduces the data dimensionality by using multi-linear discriminant analysis. Finally, the method trains a random forest classifier for identifying the class of the patch. Journet et al. [11] discriminate drawing and text block in gray level images by using multiresolution texture features. Sarkar et al. [12] classifies the foreground pixels in printed document into handwriting, printed text, printed graphics, and noise. First he segments the images into fragments, then these fragments are classified by 1520-5363/13 $26.00 © 2013 IEEE DOI 10.1109/ICDAR.2013.206
a two stages classification. He uses the result of the first stage to augment the feature employed in the second stage. Garz et al. [13] presented a binarization-free text line segmentation method. It firstly extracts interest points representing parts of characters. It secondly groups them into word clusters and excludes touching components of these clusters. Text lines are lastly generated by concatenating these word clusters using an estimated orientation of word clusters. Liwicki et al. [14] used dynamic programming to determine text line boundaries by computing minimum cost paths between consecutive text lines. The method of Li et al. [15] uses a level set approach to first generate rough estimations of the text line boundaries and refines them at later stages. The method is applied on binary images. The use of pyramidal approaches, which have been successfully applied to related problems in image processing [16], to the best of the authors’ knowledge have not yet been investigated for segmenting text lines in colored document images. In this paper we propose to apply a pyramidal approach as follows: first, we segment a small scaled image to extract a rough global view of the layout; second, we increase the image size to refine the boundary of elements contained in the physical structure. This could be repeated until we recover all the physical structure of the document. Starting by processing an image of small size rather than an image of big size results in a significant gain in terms of time processing. The overall method proposed in this paper exploits machine learning techniques to perform text line extraction for historical manuscripts. First, a layout analysis is performed to recognize the physical structure of a document. Therefore two cascading classifiers label the pixels of the document image with five labels: text-block, core-text-line, decoration, background, and periphery. The first classifier segments the image into periphery, background, text-block, and decoration. The second classifier takes the image pixels identified as text-block and their surrounding pixels to reclassify them into core-text-line, background, and decoration. Note, that the core-text-line is the region between the median line and baseline of a text line without any ascenders and any descenders. Both classifiers use DMLP [17] to classify the pixels of a scaled image. Second, a grouping algorithm arranges the pixels identified as coretext-line into text lines and subsequently into text blocks. This algorithm uses the connected-components approach and changes the boundaries of the text lines in order to include the ascenders and the descenders. The rest of this paper is organized as follows. Section II describes the data corpus used to evaluate our system. Section III details our text line extraction system. Section IV details our 1029
factors 8 and 32. Thus at lowest resolution the image has a size of about 60 × 90 pixels, where as the resolution of the medium image is 4 × 4 times larger.
(a)
(b)
Based on these images the classification is performed in two levels as shown in Figure 2. The first level consists of a classifier that labels each pixel of the scaled image at lowest resolution by using as inputs the features (see below) extracted from the image. The second level maps the classification result of the first level to the image at medium resolution, then reclassifies the pixels which were identified as text-block and their surrounding pixels, i.e., pixels within a range of 4 pixels.
(c)
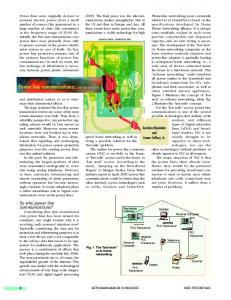
Fig. 1. Document image examples of : a) Saint Gall set (Cod. Sang, 562, page 5), b) Parzival set (Cod. 857, page 144) and c) George Washington set (letterbook 1, page 278).
evaluation of the proposed method. Finally, Section V draws some conclusions. II.
DATA C ORPUS
The HisDoc project [1] provides public access to three data sets for developing handwriting recognition systems1 . The first data set is the Saint Gall set and consists of 60 manuscript pages taken from a medieval manuscript written in Latin.2 The second data set is the Parzival set and consists of 47 pages written in German by three writers.3 The third data set is the George Washington set and consists of 20 pages written in English.4
Fig. 2. Overview of the classification step. (Image taken from Parzival set Cod. 857 page 125)
The first two data sets consist of colour images of manuscripts written with ink on parchment. The George Washington data set consists of gray-level images of manuscript written with ink on paper and the image is in gray levels. The images have about 6 mega pixels corresponding to a resolution above 300 dpi. Figure 1 shows typical examples of the three data sets.
1) Feature Extraction: The basic set of features extracted at each level is the same. However, there are two additional features used at the first level and one additional feature at the second level. We start to present the features that are common to both levels: 1) 2) 3)
All data were already available as raw images together with the aligned transcription. In order to retrieve the ground-truth for text line extraction, we annotated the physical structure for these sets using the XML format specified in [18]. III.
S YSTEM D ESCRIPTION
A. Layout Recognition using a Pyramidal Approach In the pyramidal approach we lower the resolution of the images by down-sampling the original images linearly by 1 http://www.iam.unibe.ch/fki/databases/iam-historical-document-database 2 It contains the hagiography Vita sancti Galli by Walafrid Strabo. The Abbey Library has a copy of this manuscript within the Cod. Sang. 562. The e-codices project makes it available through the internet at: http://www.e-codices.unifr.ch 3 These pages were taken from a medieval German manuscript from the 13th century and contain the epic poem Parzival by Wolfram von Eschenbach. The Abbey Library of Saint Gall has a copy in Cod. 857. An electronic manuscript edition was published on CD-ROM by the German Language Institute of the University of Bern, Switzerland: http://www.parzival.unibe.ch 4 These pages are taken from letters written by George Washington and his associates in the 18th century. The Library of Congress makes them available on line. George Washington Papers at the Library of Congress from 1741 to 1799, Series 2, to be found at: http://memory.loc.gov/ammem/gwhtml/gwseries2.html
4)
The coordinates of the pixel (x,y) The color values of the pixel (r,g,b) Considering a horizontal neighborhood of d pixels located respectively on the left and on the right of pixel p(x, y) we use the following features; extracted for k = {1, 2, . . . , d}: • Minimum values of {p(x + k, y), p(x − k, y)} • Maximum values of {p(x + k, y), p(x − k, y)} • p(x + d, y) ∗ p(x − d, y) Doing this for d = 4 and for the color planes R (red) and B (blue) we collect thus 4 × 2 × 3 = 24 features. Finally, we add the minimum and the maximum values of all the pixel in the neighborhood {p(x − d, y), p(x − d + 1, y), ..p(x + d, y).} The same features as in 3) is used by considering a vertical neighborhood.
Additionally for the first level we consider the 9 × 9 matrix centered at the pixel p(x, y), i.e., all pixels within a range of 4 pixels. From this matrix we use the sum of all the pixels in this matrix. Furthermore, we sum over all pixels in the image at the given resolution with the same x-coordinate. For the second level we use also the neural outputs produced by the DMLP of a lower resolution. We enumerated the labels present in each level and passed the label numbers as
1030
2) 3)
4) Fig. 3. A DMLP with three input neurons, four hidden neurons, and two output neurons. Note that a standard MLP have fully connected layers, i.e, including the dashed links, and a DMLP does not.
5)
a feature to the higher level. Notice that all the features are normalized by using the min-max normalization [17] to fit the range [-1, 1] which is suitable for MLP. 2) Classification: For classification we use the Dynamic Multilayer Perceptrons (DMLP) [17], which directly inherit the structure and functionality from standard Multilayer Perceptrons (MLP). However, they additionally restrict the topology of the nets as is shown by Figure 3: The output layer of the DMLP is partially connected to the last hidden layer, i.e, for a given neuron j of the output layer we dedicate n hidden neurons to be connected exclusively to this neuron j. We chose n = 4 by visual investigation on sample data from the training set. According to Bloechle [17], this restricted topology avoids that a big and frequent training data set of one class influences the whole classification system during the training phase, and biases the classification results in favor of that class. This is convenient for our layout analysis purposed, because the size of training samples varies a lot from one class to another. We use a DMLP with three layers where the input layer and hidden layer are fully connected. Notice that each level of the pyramidal approach has its own DMLP and also that each set of our corpus has its own specialized DMLPs. Furthermore the number of input and output neurons is determined by the size of the feature vector and the number of classes. B. Grouping Algorithm The classification described above provides the physical structure of the document, especially the location of the coretext-lines in the image. Figure 2 highlights the pixels classified as core-text-lines in cyan color. Subsequently, the grouping algorithm maps these classification results to the highest resolution, and processes them in two phases. The first phase extracts the text lines and groups them into blocks. The second phase refines the boundary of these text lines by including the ascenders, the descenders, and as well as diacritics.
At the end of these steps, the bounding box for each line delimits the core part of the text line as is shown by Figure 4 b). Finally we reject blocks with few lines (less than three) to eliminate errors produced by the classification and by the text blocks in margin. In the scope of the HisDoc project this step is feasible since small text blocks with only a few text lines are not considered for the recognition [1]. a) b) c) d) e) Fig. 4. Illustrations for refining phase: a) pixels identified as a core-textline in the classification result, b) bounding box delimiting the core-text-line computed form a), c) the binary image of the text line, d) the result of refining phase, and e) the resulting bounding polygon delimitating the text line.
The Refining phase extends the bounding box of the text lines obtained in the grouping phase to include the missing parts of the text line by using the binary version of the image computed by the Sauvola algorithm on a gray level version of the document image. This phase processes each bounding box as follows: 1)
The basic idea of the grouping phase is to merge the closest core-text-lines horizontally in order to recover the text lines and grouping them together to get text blocks. This text reconstruction is divided into the following steps: 1)
Extract the CCs from the binary image. Cluster the CCs into blocks by using the following property: two CCs belong to the same block if and only if their bounding boxes could be connected by a horizontal or vertical straight segment having a length smaller than a threshold t. Note that t is a parameter depending on the script. Project on the y axis the gravity centers of the CCs belonging to the same block and identify the text lines using the following property: two CCs belong to the same text line if the distance between their projected centers is smaller than a fixed threshold d. Compute the mean and the standard deviation for the heights of these core-text-lines and then apply the following: if the height of a line is larger than a weighted sum of the mean height and of the standard deviation, divide the line into several lines by assuming that a text height is the mean height.
2)
Transform the classification results into a binary image by representing the pixels identified as a coretext-line as black pixels. Normally we obtain for each text line one or more Connected Components (CCs) as it shown by Figure 4 a).
3)
1031
Extract the binary image of the text line which is delimited by the bounding box of the previous text line and the bounding box of the following text line, cf. Figure 4 c). Estimate the median line and the baseline by using the locations of the CCs which are intersected with the bounding box of the text line by using the coordinates x,y of the CCs and their height h. Therefore, a smoothing data technique called average windows is applied to the coordinates x,y (receptively to x,y +h) which is followed by a linear interpolation. Draw the median line and the baseline on the binary image to preserve all CCs located between these two
4)
5)
6)
lines until the final step — even those at the extreme left and the extreme right (as the point in Figure 4 d)). Exclude pixels that have been classified as decoration in the classification results, and also exclude those CCs which are touching the bounding box of the previous line or of the following line. Keep CCs which are located in a range of c pixels from the median line assuming that they are the diacritics of the text line, however, remove CCs that are located at a distance of more than c pixels from median line. Compute a polygon delimiting the remaining CCs as is shown by Figure 4 e.
The resulting polygon represents the border of the text line. IV.
(a)
(b)
(c)
(d)
E XPERIMENTS
Previous work on the database [1] provides a partition of the corpus into training sets, validation sets and testing sets. Table I gives an overview of set sizes. We decided to use only the training set and the testing set to perform the evaluation of our method, since no validation is required. For each of Parzival, Saint Gall, G. Washington data set two DMLPs were trained and all parameters occurring in Section III were optimized by visual inspection on sample data of the training set. In the testing phase our method processes automatically the testing image to first extract the core-text-line and then to extract the boundary of each text line. Figure 5 b) highlights in red the pixels identified as core-text-line in the classification result which are computed by overlapping the classification results of the first level with the ones of the second level. The boundaries of text lines are highlighted in red in Figure 5 d). TABLE I.
S IZES OF TRAINING , VALIDATION AND TESTING SET Parzival Saint Gall G. Washington
Training 24 20 10
Validation 9 10 5
Testing 14 30 5
For evaluating the pixel classification we decided to take the confusion matrix presented by Table II. This confusion matrix is computed by comparing the classification results and the ground truth of the layout. Examples of ground truth and classification result are represented in Figure 5 b) and c). However, this measure is strict and doesn’t permit to define a tolerance between classes, i.e, it doesn’t allow to define a criteria for a set of pixels that could be accepted in two or three classes. This is needed to avoid difficulties in defining the boundaries between blocks of text and text lines in the physical structure, and receptively between decorations and background. As can be seen in Table II, our layout recognition often makes confusion between two classes text block and core-text-line. If we fuse these two classes in one class named text, the pixel classification achieves a much higher performance. For evaluating the performance of our grouping algorithm, the pixel-level hit rate and the line accuracy measure presented by [15] and by [13] are applied on the binary image in where the foreground (text) is represented in black and background in white, respectively. Therefore, we compute the Matrix P =
Fig. 5. Illustration for our experiment: a) an example testing Image taken from Parzival data set Cod. 857 page 263, b) results of the classification, c) ground truth of the layout, and finally d) text lines and text blocks extracted by our methods. The core-text-lines is emphasized red, the text blocks in blue, the decorations in orange, background in gray and periphery in green. TABLE II.
C ONFUSION MATRIX PRESENTED IN PERCENTAGE
Parzival block core-line deco. backgr. periph.
block 82.5 14.9 13.8 13.8 0.3
core-line 14.7 83.3 2.4 0.3 0.1
deco. 0.3 0.6 59.7 0.3 0.1
backgr. 2.4 1.2 23.6 83.5 23.4
periph. 0 0 0.5 2.1 76.2
Saint Gall block core-line deco. backgr. periph.
block 88.2 15.1 8.4 5.4 0.2
core-line 9.6 83.8 1.4 0.1 0
deco. 0 0 73.1 0.1 0
backgr. 2.1 1.1 17.1 92.1 2.5
periph. 0 0 0 2.3 97.3
G. Washington block core-line deco. backgr. periph.
block 86.9 30.0 0 42.5 0.2
core-line 11.7 69.5 0 2.1 0.1
deco. 0 0 0 0 0
backgr. 1.1 0.3 0 51.3 6.5
periph. 0.3 0.2 0 4.1 93.3
(pij )M ×N where pij is the number of common black-pixels between i-th ground-truth line and j-th extracted line for i = 1, 2, . . . , M and j = 1, 2, . . . , N . For an assignment S(i) = j between groundtruth lines and � detected lines, [15] defined a goodness measure G(S) = k pkS(k) , which corresponds to the total number of shared pixels. The overall pixel-level hit
1032
rate is defined as G(Smax ) � , where Smax = argmax G(S) , H= |GT R| S
as t, d, n, .... This can be done if some pages of the manuscripts already contain layout information, e.g., in a scenario where an expert annotates the first two or three pages and the rest should be done automatically.
where GT is the set of all black pixels in the ground truth; R represents all black pixels found by our method including error pixels which are not in the ground truth.
R EFERENCES [1]
We have also evaluated our approach at the text line level. As defined in [15], a line i in the groundtruth is correctly G (S ) G (S ) ≥ 0.9 and ij|Rjmax ≥ 0.9 detected if and only if ij|GTmax | i| where GTi represents the black pixel set in the groundtruth for the line i, Rj is the set of black pixels founded by our approach for the line j, Gij represents the total number of shared pixel between the line i in groundtruth and its hypothesis line j in the result.
[2]
[3]
Table III presents the accuracy and the hit rate achieved for each manuscript by our method. Our system achieves high accuracy and hit rates for the Saint Gall set and Parzival set (see Table III). On the George Washington set, however, it achieves a weaker performance in layout recognition (see Table II) and grouping. We believe that this is due to the lack of training data for this manuscript. Furthermore the George Washington set uses only grey levels whereas our feature extraction and classification process have been designed for color images. TABLE III.
[4]
[5]
[6]
[7]
ACCURACY AND HIT RATE OF LINE SEGMENTATION
Data set Parzival Saint Gall G. Washington
Accuracy 0.964 0.954 0.849
Hit rate 0.963 0.960 0.860
Number of text line 1404 720 166
[8]
[9]
V.
C ONCLUSION
This paper has presented a method to extract the physical structure, specifically text lines, from historical manuscripts. The method performs in two phases. The first phase is based on machine learning techniques and segments the document image into five areas: text-block, core-text-line, decoration, background and periphery. In this phase we use a pyramidal approach. The second phase consists of a grouping algorithm based on Connected Component analysis that delimits the text blocks and text lines by using classification results and document binary images. The main advantage of our method is that the text line segmentation is based on our layout analysis to perform the line extraction, thus our system is capable of extracting text lines and simultaneously excluding other elements of the physical structure. Our experiments on three types of historical manuscripts show encouraging segmentation quality for specific classes. In order to optimize our system for all classes, we currently investigate several alternative learning algorithms and introduce other features specially for gray level images. Finally, we plan to compare our method with other line segmentation techniques by performing an evaluation of our method on the GERMANA Dataset5 . In future we plan to improve the proposed method to automatically determine parameters, such 5 The
[10]
[11]
[12]
[13]
[14]
[15]
[16] [17]
[18]
GERMANA Dataset consists of 764 pages written in Spanish and is publicly available through the Internet via: https://prhlt.iti.upv.es/page/projects/multimodal/idoc/germana
1033
A. Fischer, H. Bunke, N. Naji, J. Savoy, M. Baechler, and R. Ingold, “The hisdoc project. automatic analysis, recognition, and retrieval of handwritten historical documents for digital libraries.” in the proceedings of InterNational and InterDisciplinary Aspects of Scholarly Editing, 2012, to appear. L. Likforman-Sulem, A. Zahour, and B. Taconet, “Text line segmentation of historical documents: a survey,” International Journal on Document Analysis and Recognition, vol. 9, no. 2, pp. 123–138, 2007. N. Tripathy and U. Pal, “Handwriting segmentation of unconstrained oriya text,” in Ninth International Workshop on Frontiers in Handwriting Recognition, 2004, pp. 306 – 311. A. Zahour, B. Taconet, P. Mercy, and S. Ramdane, “Arabic handwritten text-line extraction,” in Proceedings of the Sixth International Conference on Document Analysis and Recognition, 2001, pp. 281 – 285. M. Bulacu, R. van Koert, L. Schomaker, and T. van Der Zant, “Layout analysis of handwritten historical documents for searching the archive of the cabinet of the dutch queen,” in Ninth International Conference on Document Analysis and Recognition, vol. 1, sept. 2007, pp. 357 –361. L. Likforman-Sulem, A. Hanimyan, and C. Faure, “A hough based algorithm for extracting text lines in handwritten documents,” in Proceedings of the Third International Conference on Document Analysis and Recognition, vol. 2, 1995, pp. 774 –777 vol.2. G. Louloudis, B. Gatos, I. Pratikakis, and C. Halatsis, “Text line detection in handwritten documents,” Pattern Recognition, vol. 41, no. 12, pp. 3758–3772, Dec. 2008. F. M. Wahl, K. Y. Wong, and R. G. Casey, “Block segmentation and text extraction in mixed text/image documents,” Computer Graphics and Image Processing, vol. 20, no. 4, pp. 375 – 390, 1982. N. Nikolaou, M. Makridis, B. Gatos, N. Stamatopoulos, and N. Papamarkos, “Segmentation of historical machine-printed documents using adaptive run length smoothing and skeleton segmentation paths,” Image and Vision Computing, vol. 28, no. 4, pp. 590–604, 2010. G. Zhong and M. Cheriet, “Image patches analysis for text block identification,” in 11th International Conference on Information Science, Signal Processing and their Applications, july 2012, pp. 1241 –1246. N. Journet, J.-Y. Ramel, R. Mullot, and V. Eglin, “Document Image Characterization Using a Multiresolution Analysis of the Texture: Application to Old Documents ,” International Journal on Document Analysis and Recognition, vol. 11, no. 1, pp. 9–18, Oct. 2008. P. Sarkar, E. Saund, and J. Lin, “Classifying foreground pixels in document images,” in International Conference on Document Analysis and Recognition, 2009, pp. 641–645. A. Garz, A. Fischer, R. Sablatnig, and H. Bunke, “Binarization-free text line segmentation for historical documents based on interest point clustering,” in 10th IAPR International Workshop on Document Analysis Systems, 2012, pp. 95 –99. M. Liwicki, E. Inderm¨uhle, and H. Bunke, “On-line handwritten text line detection using dynamic programming,” in International Conference on Document Analysis and Recognition, 2007, pp. 447–451. Y. Li, Y. Zheng, D. Doermann, S. Jaeger, and Y. Li, “Script-independent text line segmentation in freestyle handwritten documents,” IEEE Transactions on Pattern Analysis and Machine Intelligence, vol. 30, no. 8, pp. 1313–1329, 2008. P. J. Burt, “Fast filter transform for image processing,” Computer Graphics and Image Processing, vol. 16, no. 1, pp. 20 – 51, 1981. J.-L. Bloechle, “Physical and logical structure recognition of pdf documents.” Ph.D. dissertation, Faculty of Science, University of Fribourg, June 2010. M. Baechler and R. Ingold, “Medieval manuscript layout model,” in Proceedings of the 10th ACM symposium on Document engineering. New York, NY, USA: ACM, 2010, pp. 275–278.