Dec 8, 2009 - if gray(x) > μr(x) + k · Ïr(x);. 100, other, ... smoothing term k is set to 0.4 in practical. It is noted .... to train the MST distance metric and 550 text lines was la- beled to .... ogy and Applications (ICITA'05), pages 680â685, Sydney,.
2009 10th International Conference on Document Analysis and Recognition
Text Localization in Natural Scene Images based on Conditional Random Field Yi-Feng Pan, Xinwen Hou, Cheng-Lin Liu National Laboratory of Pattern Recognition Institute of Automation, Chinese Academy of Sciences 95 Zhongguancun East Road, Beijing 100190, P. R. China E-mails: {yfpan, xwhou, liucl}@nlpr.ia.ac.cn Abstract
butions and enclosed contours. These methods generally contain three stages: 1) CC extraction to segment CCs from images, 2) CC analysis to determine whether or not they are text components by heuristic rules or classifiers and 3) postprocessing to group text components into text regions (e.g. words, lines). Although some existing methods have reported promissing results, there still remains several problems difficult to be solved. For CC-based methods, text components are hard to be segmented accurately without prior information of text position and scale. Furthermore, designing fast and reliable CC analysis method is also difficult since there are too many text-like components in images. On the other hand, the performance of region-based methods is sensitive to the text orientation and cluster number. Most of these methods can only localize texts containing many characters in horizontal alignment. To overcome these difficulties, we propose a hybrid method to robustly and accurately localize texts in natural scene images. A text region detector is designed to generate a text confidence map, based on which components are segmented with local binarization. Then a Conditional Random Field (CRF) model considering of both the unary component property and neighboring component relationship is presented for component analysis. Finally, a energy minimization based approach is used to group text components into text lines. We evaluate our method on ICDAR 2003 competition dataset and the results show that the text localization accuracy is improved.
This paper proposes a novel hybrid method to robustly and accurately localize texts in natural scene images. A text region detector is designed to generate a text confidence map, based on which text components can be segmented by local binarization approach. A Conditional Random Field (CRF) model, considering the unary component property as well as binary neighboring component relationship, is then presented to label components as ”text” or ”non-text”. Last, text components are grouped into text lines with an energy minimization approach. Experimental results show that the proposed method gives promising performance comparing with the existing methods on ICDAR 2003 competition dataset.
1. Introduction With the widely use of digital image capturing devices, text localization/detection, as a key part of the image text information extraction system [3], has been studied intensively. Though many efforts have been devoted to, it remains a challenge due to variations of texts’ size, font, array orientation and degraded images with the cluttered background and noises [5]. The existing methods can be categorized into two classes: region-based methods and connected component (CC)-based ones. Region-based methods [3, 5, 14] are based on observations that text regions have distinct characteristics from nontext regions such as distinctive gradient distribution, texture and structure. These methods generally consist of two stages: text detection and text localization. For text detection, features of local regions are extracted to determine if they contain texts. Then specific grouping or clustering approaches are employed to localize text regions accurately. CC-based methods [3, 5, 14] are based on observations that texts can be seen as sets of separate connected components, each of which has distinct intensity, color distri978-0-7695-3725-2/09 $25.00 © 2009 IEEE DOI 10.1109/ICDAR.2009.97
2. System Overview For scene texts localization, the process of our method consists of three stages: 1) pre-processing, designing a text region detector to generate the text confidence map, based on which text components can be segmented by local binarization, 2) CC analysis, presenting a CRF model to formulate component analysis into component labeling problem, which is solved by minimum classification error (MCE) 6
Authorized licensed use limited to: INSTITUTE OF AUTOMATION CAS. Downloaded on December 8, 2009 at 18:43 from IEEE Xplore. Restrictions apply.
where all likelihoods Pt (s|x) are calculated on the validation set during the training procedure. In this way, each confidence map of the image pyramid can be calculated, whose pixel confidence and scale values are then projected back into corresponding pixels of the text confidence map for the original image which is used for subsequent stages.
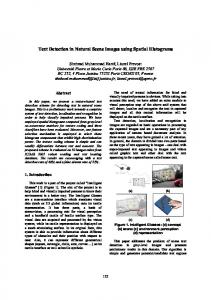
learning and graph cuts inference algorithm and 3) text line grouping, where component minimum spanning tree is built with a learned distance metric and inter-line edges are cut off with an energy minimization model. The flawchat of the proposed method is shown in Fig. 1 and detailed descriptions will be given in the following sections. Pre-processing Input image
x�Text region detector ���x� Text confidence map ���x� Local binarization
Connected component analysis
3.3
x�Component labeling with a CRF model
Niblack’s binarization algorithm [7] is adopted to segment connected components from the image. The formula to binarize each pixel is defined as �
Text line grouping ��x� Minimum spanning tree ��x� Edge cut
Output localization results
b(x) =
Figure 1. Flowchat of the proposed method.
0, 255, 100,
if gray(x) < μr (x) − k · σr (x); if gray(x) > μr (x) + k · σr (x); other,
(2)
where μr (x) and σr (x) are the intensity mean and STD within a r radius window centered on the pixel x and the smoothing term k is set to 0.4 in practical. It is noted that the value of window radius r for each pixel is calculated based on the corresponding pixel value of the text confidence map. For a binarized image, components with 0 or 255 value are extracted as candidate text components while 100 ones are not considered further. An example of the preprocessing stage is shown in Fig. 3.
3. Pre-processing For utilizing region information, a text region detector is designed to measure confidences of containing texts for local image regions, based on which components can be segmented and analyzed accurately.
3.1
Image Segmentation
Text Region Detector
4. Connected Component Analysis The color image is first converted into the gray-level image, on which image pyramids are built with nearest interpolation to capture texts with various sizes. Motivated by our previous work [8], a text region detector is designed by integrating Histograms of Oriented Gradients (HOG) feature extractor and boosted cascade classifier. For each local region in one image of pyramids, HOG features are extracted as an input to a variation of cascade boosting classifier, WaldBoost [10], to estimate whether this region contains texts. The major difference between WaldBoost and other cascade boosting classifiers is that it directly ensemble weak learners to build a strong classifier and each of them can be used to filter out negative objects individually.
3.2
For CCA, a Conditional Random Field (CRF) model is proposed to label components as ”text” or ”non-text” by considering of both the unary component property and neighboring component relationship.
4.1
Brief Introduction to CRF
CRF [4] is a undirected graphical model to estimate probability distribution global conditioned on observations. Formally, Let G = (X, E) be a graph constructed on random variables X = (x1 , ..., xn ) with labels Y = (y1 , ..., yn ). Then (X, Y ) is a CRF when probability of Y conditioned on X obeys the Markov property: P (yi |x, yj , j �= i) = P (yi |x, yj , j ∈ ni ), where ni is the neighborhood set (clique) for xi . In implementation, P (Y |X) can be approximated by arbitrary real-valued energy function E(X, Y, N, Λ) with clique set N and parameters Λ as
Text Confidence Map
To measure the confidence that one region contains texts, we translate the Waldboost output, no matter accepted or rejected, into posterior probability based on a boosted classifier calibration method [12]. Posterior probabilities of the observation variable x, x ∈{text,non-text}, conditioned on the state variable s, s ∈{accept,reject}, at stage t can be estimated based on the Bayes’ formula as
P (Y |X) =
1 exp(−E(X, Y, N, λ)), Z(X)
(3)
where Z(X) is the normalization constant which could not be considered if ignoring the probability explanation. Then the best label Y ∗ can be found from maximizing conditional probability P (Y |X) to minimizing the total graph energy: Y ∗ = arg maxY P (Y |X) = arg minY E(X, Y, N, λ).
Pt (s|x)Pt−1 (x|accept) Pt (s|x)Pt (x) = � , Pt (x|s) = � P (s|x)P (x) P (s|x)Pt−1 (x|accept) t t x x t (1) 7
Authorized licensed use limited to: INSTITUTE OF AUTOMATION CAS. Downloaded on December 8, 2009 at 18:43 from IEEE Xplore. Restrictions apply.
…
…
(a)
(b)
(c)
(d)
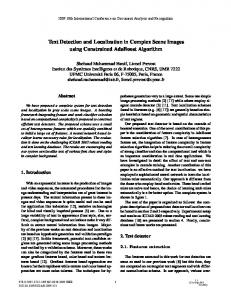
Figure 2. Example of the pre-processing stage. (a) the original image. (b) text confidence maps for the image pyramid (brightness of pixels represents the probability as ”text”). (c) the text confidence map for the original image. (d) binarized image.
4.2
Unary feature normalized width normalized height aspect ratio occupy ratio compactness confidence contour gradient (R,G,B) average run-length number
CC labeling with CRF
Based on the definition of CRF, we formulate CC analysis into CC labeling problem: given the component set X = (x1 , x2 , ...), on which a 2D undirected graph is constructed, the objective is to find the best component label Y ∗ = (y1∗ , y2∗ , ...) to minimize the total graph energy E. 4.2.1
Neighborhood Graph
Table 1: Unary and binary features.
Considering the geometric and spatial relationship of components, we construct the neighborhood graph with a component linkage rule defined as
4.2.3
where dist(·, ·) is the centroid distance between two components and w and h are component width and height respectively. Any two components whose spatial relationship obeys this rule can be linked together by an edge. Energy Function
L(X, Λ) =
Considering the effectiveness and efficiency, we utilize unary and binary cliques on the graph to construct the CRF model, where multi-layer perceptron (MLP) is selected to approximate the unary and binary energy function. The total energy function is defined as � E(X, Y, N, λ) =
ωc ·
�
1 , 1 + exp(−ξ(d(X, Λ)))
(6)
based on which parameters can be iteratively optimized by stochastic gradient decent algorithm as Λt+1 = Λt − εt ·
( (Eun (xi , yi , ωun ) +
i
Learning and Inference
For parameter estimation of the CRF model, we use Minimum Classification Error (MCE) criterion [2] since it can be directly integrated with the MLP optimization. In MCE training, the misclassification measure can be approximated by d(X, Λ) = −E(X, Y c , N, Λ) + E(X, Y r , N, Λ), where Y c and Y r are the true and rival label respectively and Λ represents CRF model parameters {ωun , ωbi , ωc }. The measurement can be transformed into loss function
dist(xi , xj ) < 2 ∗ min( max( wi , hi ), max( wj , hj ) ), (4)
4.2.2
Binary feature centroid distance scale ratio shape difference (horizontal and vertical) overlap degree (horizontal and vertical) color difference (R,G,B) confidence (minimum and maximum)
∂L(X, Λ) |Λ=Λt . ∂Λ
(7)
When energy function parameters are learned fixed, graph cuts (α-expansion) algorithm [1] is selected to find the best label Y ∗ of components to minimize the total energy since it can achieve approximate optimal results and is much efficient than other inference algrothms. During the training procedure, we use coupling strategy to learn energy function parameters: at each time, the energy function is first fixed and graph cuts is used to label components, then the total energy value for fixed graph labels is used to optimize parameters based on MCE criterion. This updating process continues until the total energy only have very few changes. During the test procedure, to speed up the process, some apparent non-text components
Ebi (xi , xj , yi , yj , j ∈ ni , ωbi ) ),(5)
ci
where values of Eun (·, ωun ) and Ebi (·, ωbi ) are outputs of two-class (”text”, ”non-text”) and three-class (both texts, both non-texts and different style) MLPs on unary and binary features, and ωc is a combination coefficient. Unary and binary features (defined in Table 1, refer to [11]), some of which are calculated with the text confidence map, are extracted to represent the component property and component neighboring relationship. 8
Authorized licensed use limited to: INSTITUTE OF AUTOMATION CAS. Downloaded on December 8, 2009 at 18:43 from IEEE Xplore. Restrictions apply.
defined as in Table 2 (refer to [15]), and {ωi } are classifier weight coefficients, whose values are learned with MCE criterion. A recursive strategy is employed to inference edge labels: initially, edges are all labeled as ”link”. At each time, one edge is labeled as ”cut” if the new energy is minimized and smaller than the last time. This process continues until the energy is minimal. Although this recursive approach can not be proved to find the optimal labels, experimental results are still satisfactory. Finally, text lines corresponding to sub-trees can be extracted and those containing too small components are removed. An example of the text line grouping stage is shown in Fig. 5.
are firstly filtered out based on unary feature thresholds before using the CRF model. Values of these thresholds are set very weak to accept all text components in the training set. Fig. 4 gives an example of the CC analysis stage.
(a)
(b)
(c)
Figure 3. Example of the CC analysis stage. (a) components pass through unary thresholds. (b) component neighborhood graph (with blue edges). (c) components labeled as ”text” with the learned CRF model.
5
Text Line Grouping
To group text components into text lines, we presented a learning based method by building neighboring components into minimum spanning tree (MST) and cutting off interline edge with an energy minimization model.
5.1
(a)
6
Based on observations that components belonging to one text line are adjacent along specific orientation, we cluster text components into a MST. Motivated by Yin’s work [13], we define a linear distance metric whose parameters are learned with the perceptron algorithm to estimate the similarity measurement between two components, where features are defined as Table 2. Then a MST can be built with the learned distance metric by Kruskal’s algorithm [9].
Experimental Results
To evaluate the performance of the proposed method, we have done experiments on ICDAR 2003 text locating competition dataset which includes 258 training images and 249 test images with English and Arab number texts. For training text region detector, 5000 text samples were collected by manually and non-text samples are extracted randomly from training images. The size of detector was fixed to 16×16 and 4-orientation HOG were used to extract region features. Interval step was fixed to 1.2 to generate image pyramid and totally 612 weak learners were selected to build WaldBoost. For more details, please refer to [8]. 4900 text components and 13000 non-text components were labeled from segmented images to train the CRF model. In order to achieve the optimal performance, parameters of two MLPs were initialized with standard back propagation algorithm and then the CRF model was jointly optimized with coupling training strategy. 10000 neighboring edges and 80000 non-neighboring edges were selected to train the MST distance metric and 550 text lines was labeled to train the energy function for edge cuts. Our system was coded with C++ language and all experiments evaluated on a Pentium 4 3.4GHz desktop computer with Window XP OS. To evaluate the proposed CRF model, we compared component classification performance with three different classifier settings: 1) MLP, only unary energy function is
Text line feature line regression error line height line number cut edge score inter-line distance (horizontal and vertical)
Table 2: Distance metric and text line features.
5.2
(c)
Figure 4. Example of the text line grouping stage (a) building MST with the learned distance metric. (b) edge cut with an energy minimization model. (c) final text localization results.
MST Building
Distance metric feature centroid distance (horizontal and vertical) box boundary distance (horizontal and vertical) shape difference color difference
(b)
Edge Cut
To separate MST into text lines with irregular alignments, we formulate edge cut into edge labeling problem which is solved in the similar way as CC analysis in Section 4. Briefly, for a MST graph GM ST (X, Y ) on edges X with labels Y ,�a learned energy function is defined as EM ST (X, Y ) = i ωi ·fi , where {fi } are text line features 9
Authorized licensed use limited to: INSTITUTE OF AUTOMATION CAS. Downloaded on December 8, 2009 at 18:43 from IEEE Xplore. Restrictions apply.
used, 2) CRF-ωc , unary and binary functions were all used but only combination coefficient ωc was optimized with MCE criterion and 3) CRF-Λ, all energy function parameters Λ(ωun , ωbi , ωc ) were optimized with MCE criterion. Results in Table 3 shows that the CRF model is better than unary MLP as considering relationship between neighboring components and parameters fully learned with MCE is better than only optimizing the combination coefficient. MLP CRF-ωc CRF-Λ
Recall rate(%) 79.04 80.77 83.12
for valuable comments and Xiang-Dong Zhou and Fei Yin for their helpful discussions.
References [1] Y. Boykov, O. Veksler, and R. Zabih. Fast approximate energy minimization via graph cuts. IEEE Trans. Pattern Anal. Mach. Intell., 23(11):1222–1239, 2001. [2] B.-H. Juang and S. Katagiri. Discriminative learning for minimum error classification. IEEE Trans. Signal Processing, 40(12):3043–3054, 1992. [3] K. Jung, K. I. Kim, and A. K. Jain. Text information extraction in images and video: A survey. Pattern Recogntion, 37(5):977–997, 2004. [4] J. Lafferty, A. McCallum, and F. Pereira. Conditional random fields: Probabilistic models for segmenting and labeling sequence data. In Proc. Eighteenth Int.l Conf. Machine Learning (ICML’01), pages 282–289, San Francisco, USA, 2001. [5] J. Liang, D. Doermann, and H. P. Li. Camera-based analysis of text and documents: a survey. Int’l J. Document Analysis and Recognition, 7(2-3):84–104, 2005. [6] S. Lucas. ICDAR 2005 text locating competition results. In Proc. Eighth Int.l Conf. Document Analysis and Recognition (ICDAR’05), pages 80–84, Seoul, South Korea, 2005. [7] W. Niblack. An Introduction to Digital Image Processing. Strandberg Publishing Company, Birkeroed, Denmark, 1985. [8] Y.-F. Pan, X. W. Hou, and C.-L. Liu. A robust system to detect and localize texts in natural scene images. In Proc. Eighth IAPR Workshop on Document Analysis Syetems (DAS’08), pages 35–42, Nara, Japan, 2008. [9] R. Sedgewick. Algorithms in C, Part 5: Graph Algorithms, Third Edition. Addison-Wesley Professional, 2001. [10] J. Sochman and J. Matas. Waldboost – learning for time constrained sequential detection. In Proc. IEEE Conf. Computer Vision and Pattern Recognition (CVPR’05), pages 150–156, San Diego, USA, 2005. [11] H. Takahashi. Region graph based text extraction from outdoor images. In Proc. Third Int.l Conf. Information Technology and Applications (ICITA’05), pages 680–685, Sydney, Australia, 2005. [12] H. Takatsuka, M. Tanaka, and M. Okutomi. Distributionbased face detection using calibrated boosted cascade classifier. In Proc. 14th Int.l Conf. Image Analysis and Processing (ICIAP’07), pages 351–356, Modena, Italy, 2007. [13] F. Yin and C.-L. Liu. Handwritten text line segmentation by clustering with distance metric learning. In Int’l Conf. Frontiers in Handwriting Recognition (ICFHR’08), pages 229– 234, Montreal, Canada, 2008. [14] J. Zhang and R. Kasturi. Extraction of text objects in video documents: Recent progress. In Proc. Eighth IAPR Workshop on Document Analysis Syetems (DAS’08), pages 1–13, Nara, Japan, 2008. [15] X.-D. Zhou, D.-H. Wang, and C.-L. Liu. Grouping text lines in online handwritten Japanese documents by combining temporal and spatial information. In Proc. Eighth IAPR Workshop on Document Analysis Syetems (DAS’08), pages 61–68, Nara, Japan, 2008.
Precision rate(%) 78.61 82.81 83.77
Table 3: Component classification results for different classifier settings. To evaluate the proposed text localization method, we compared our method with several existing methods: the top two participants of ICDAR 2005 text location competition [6] and our previous method [8]. We adopted the performance evaluation criterion by defining precision rate and recall rate based on area matching ratio as the ICDAR 2005 competition. As shown in Table 4, the proposed method is still comparative with the existing methods and the recall rate is improved than our previous region-based work, even there are different test images and evaluation units (word vs. line) between ours and competition methods. 1st ICDAR’05 2nd ICDAR’05 Our previous method The proposed method
Recall rate(%) 62 60 68 71
Precision rate(%) 67 60 67 67
Table 4: Text localization results of different methods.
7
Conclusions
In this paper, we present a hybrid method to localize scene texts by using region as well as component information. Furthermore, the neighboring component relationship, in addition to the unary component property, is used to construct a CRF model for CC analysis, whose model parameters are optimized with MCE learning and graph cuts inference algorithms. Experimental results have demonstrated that our method is meaningful for unconstrained scene text localization. However, until now, we just implemented a primary version of the proposed method which need to be investigated and improved further.
8
Acknowledgements
This work is supported by the National Natural Science Foundation of China (NSFC) under grant no.60775004 and no.60825301. The authors thank the anonymous reviewers 10
Authorized licensed use limited to: INSTITUTE OF AUTOMATION CAS. Downloaded on December 8, 2009 at 18:43 from IEEE Xplore. Restrictions apply.