IEEE TRANSACTIONS ON IMAGE PROCESSING, VOL. 15, NO. 6, JUNE 2006
1389
Texture Characterization for Joint Compression and Classification Based on Human Perception in the Wavelet Domain Gamal Fahmy, Member, IEEE, John Black, Jr., and Sethuraman Panchanathan, Fellow, IEEE
Abstract—Today’s multimedia applications demand sophisticated compression and classification techniques in order to store, transmit, and retrieve audio-visual information efficiently. Over the last decade, perceptually based image compression methods have been gaining importance. These methods take into account the abilities (and the limitations) of human visual perception (HVP) when performing compression. The upcoming MPEG 7 standard also addresses the need for succinct classification and indexing of visual content for efficient retrieval. However, there has been no research that has attempted to exploit the characteristics of the human visual system to perform both compression and classification jointly. One area of HVP that has unexplored potential for joint compression and classification is spatial frequency perception. Spatial frequency content that is perceived by humans can be characterized in terms of three parameters, which are: 1) magnitude; 2) phase; and 3) orientation. While the magnitude of spatial frequency content has been exploited in several existing image compression techniques, the novel contribution of this paper is its focus on the use of phase coherence for joint compression and classification in the wavelet domain. Specifically, this paper describes a human visual system-based method for measuring the degree to which an image contains coherent (perceptible) phase information, and then exploits that information to provide joint compression and classification. Simulation results that demonstrate the efficiency of this method are presented. Index Terms—Human vision, joint compression and classification, perceptual image compression.
I. INTRODUCTION
T
EXTURE HAS emerged as a powerful visual primitive to succinctly describe image content. Texture analysis and characterization has been widely studied over the last three decades in a variety of applications, including medical imaging, remote sensing, image compression, industrial inspection, and texture-based image retrieval. However, there has been little work in the domain of human visual system (HVS)-based texture characterization algorithms for joint image compression
Manuscript received December 29, 2004; revised June 11, 205. This work was supported in part by the State of Arizona Proposition 301. The associate editor coordinating the review of this manuscript and approving it for publication was Dr. Amir Said. G. Fahmy was with the Lane Department of Computer Science and Electrical Engineering, West Virginia University, Morgantown, WV 26506-6009 USA. He is now with the Faculty of Media Engineering and Technology, German University in Cairo, Cairo, Egypt (e-mail:
[email protected]). J. Black, Jr. and S. Panchanathan are with the Computer Science Department, Arizona State University, Tempe, AZ 85287-8809 USA (e-mail:
[email protected];
[email protected]). Digital Object Identifier 10.1109/TIP.2006.871160
and classification. This is the principal motivation for the work done in this paper. Despite rapid progress in mass-storage density, processor speeds, and digital communication system performance, the demand for data storage and data-transmission bandwidth continues to surpass the capabilities of available technologies. Hence, there have been increasing efforts to develop reliable compression techniques that provide cost-effective solutions for the storage and transmission of visual data. These efforts have led to the proliferation of a variety of compression standards, including the recent MPEG-4 [18] and JPEG2000 [15] standards for video/image compression. It is therefore likely that visual media will be increasingly stored in the compressed format. Visual classification and indexing techniques are also becoming important because of the need to retrieve visual information from multimedia databases. The upcoming MPEG-7 [20] standard proposes content descriptors that succinctly describes visual content for the purpose of efficient retrieval. Since not all images/videos are indexed prior to compression, there is a need for compressed domain indexing (classification) techniques to allow visual information to be retrieved based on compressed domain features. Since both compression and classification (indexing) rely on efficient information extraction and representation, it is our belief that they should be treated jointly. In other words, transform coefficients should be used not only as the basis for compression, but also to index the visual content—and possibly even to bring special compression algorithms into play, based upon the indexed category. One goal of image or video compression is to remove redundancy from the data stream in a manner that allows the redundant data to be regenerated during the decompression process. These lossless compression techniques use mathematical algorithms to remove all (or most) of the redundancy. Techniques that allow redundancy extraction often use spatial frequency transforms (such as discrete cosine transform (DCT) or wavelet) that simplify the process of redundancy removal. Once all (or most) of the data redundancies have been removed from the visual data, there are still opportunities for further compression, based on the perceptual limitations of the HVS. These limitations have been extensively studied during the last decade, allowing researchers to distinguish between perceived and unperceived visual data. These limits of visual perception provide an opportunity to discard further (unperceiv-
1057-7149/$20.00 © 2006 IEEE
1390
able) data. This discarding of unperceivable data is known as lossy compression. Early lossy image compression techniques relied on minimizing the distortion between the original image and the reconstructed image using mathematical measures, such as peak-to-peak signal-to noise ratio (PSNR) or root mean square error (RMSE). However, these mathematical measures were later shown to correlate rather poorly with human subjective judgments of reconstruction quality. Early research into perceptually based compression was done primarily by audio and speech researchers [11]. Later, a new class of perceptually-based image compression algorithms was developed. These new algorithms used perceptually based metrics (which were based on the contrast, luminance, and frequency patterns in the image) and provided superior compression ratios, while maintaining the same level of perceived reconstruction quality as the earlier lossless compression algorithms. It is this perceptually based approach that is the subject of this paper. Color compression was one of the earliest lossy compression techniques. It assigned more bandwidth to luminance and less bandwidth to chrominance, based on the fact that humans are able to perceive finer resolution in luminance than chrominance. The reconstruction quality of such a color compression technique is best measured using a perceptual measure, instead of a mathematical measure. Spatial frequency compression is most effective for textural images, which contain a wide range of spatial frequency content. Due to the increased importance of textural data, many research efforts during the last decade have focused on spatial frequency-based lossy compression, which discards data that are unperceivable by HVP. This compression is done by decomposing the image into multiple spatial frequency bands, and then quantizing each band with a value that is based on the limits of human visual perception within that band. As was the case with color compression, the reconstruction quality of such a compression technique is best measured using a perceptual measure, instead of a mathematical measure. Traditional texture classification relies on extracting statistics from the uncompressed pixel domain data (using measures such as variance, histograms, autocorrelation, and moments) in order to derive features for classification. With the increased use of image compression (and since not all textures are indexed before compression), there is now a need to develop techniques for extracting indexing statistics from compressed files, based on the transform-domain coefficients. In the last decade, further compression has been achieved by bit-stream encoding the transform coefficients (which removes a large amount of redundancy and the last stage of arithmetic coding). This further encoding (which involves a considerable amount of processing) has provided a new motivation to extract features at the compressed bit-stream level, in order to obviate the need to decode the compressed bit stream back to the transform-domain level. Regardless of what techniques are used to classify textures (at the uncompressed, compressed, or bit-stream level), the resulting classifications should be reviewed and validated by comparing them to the classifications that humans apply to the same set of textures. In other words, some method should be used to
IEEE TRANSACTIONS ON IMAGE PROCESSING, VOL. 15, NO. 6, JUNE 2006
verify that this classification is consistent with human subjective judgment. In this paper, we introduce a perceptually based joint compression and classification method for textures that exploit phase coherence within textural images. The proposed approach not only exploits phase coherence for compression purposes, but also uses them to classify the compressed textures. Hence, it achieves the ultimate goal of joint compression and classification. II. BACKGROUND The DCT was one of the first successful transforms that decomposed data into multiple spatial frequency bands. This success was largely due to its energy concentration characteristics. Several perceptually based compression techniques have used DCT. For example, Watson [9] achieved superior compression results with the DCTune perceptual coding method, which uses DCT and then uses an image-dependent quantization matrix (based on the frequency sensitivity and contrast masking of the HVS at each spatial frequency) to modify the resulting DCT coefficients. Hontsch and Karam [16] modified Watson’s image-dependent quantization matrix at the block level, based on the DCT coefficients within each block, achieving even better compression. Wavelets have recently emerged as a powerful tool for image compression. The discrete wavelet transform maps an image into a set of coefficients that constitute a multiscale representation of the image. In [3], a promising perceptual image coder (PIC) technique that employed the wavelet transform is presented, where a fixed HVP-based quantization level is used for each wavelet band (i.e., each range of spatial frequencies). In the recent JPEG2000 standard [15], HVS-based quantization is adopted as one of the compression modes. More recent techniques include Gabor filters and wavelet models [13]. It has been found that the response patterns of cells in visual cortex of the primate brain can be modeled with Gabor functions. Hence, Gabor filters are being explored in the context of texture analysis. They provide multiscale and multiresolution processing of textural information. Another multiscale approach to texture analysis is based on the use of wavelets. Similar to Gabor filters, separable wavelet filters perform multiscale texture analysis, but at a significantly lower computational cost. Compressed domain texture classification techniques have become increasingly important due to the fact that modern image databases store images in a compressed format. Since the DCT and the wavelet transform are the most popular compression transforms (and are adopted in many compression standards), most of the compressed domain classification techniques reported in the literature have been done in these domains. A texture discrimination technique has also been detailed in [12] in the DCT domain, where the energies of the subbands are used to characterize each texture. In [17], a wavelet-based indexing technique based on histograms in the wavelet domain has been detailed. Only features derived from the high-frequency bands are used to distinguish between various textures. Acceptable retrieval results have been
FAHMY et al.: TEXTURE CHARACTERIZATION FOR JOINT COMPRESSION AND CLASSIFICATION
obtained using this approach. However, it is computationally expensive, primarily because of the relatively large size of the compressed domain coefficient matrix for the higher spatial frequency bands. In [14], a combined compression and indexing system in the wavelet domain is presented. It employs Legendre moments of the wavelet coefficients as an index, and provides improved indexing performance. In [22], a texture classification approach was presented that uses the Mallat exponential [4] to model textures in all of the wavelet levels. A technique for texture classification using co-occurrence was first proposed by [1], which was later used in wavelet domain by [19]. Second-order statistics were extracted using these co-occurrence signatures. Successful superior retrieval results were obtained through this method along with its efficient texture descriptors; however, it still was not robust to scale and orientation variations. In [23], an autoregressive model in the wavelet domain was used in texture classification, where a variable size window was scanned in the horizontal, vertical, and diagonal directions. Superior retrieval results were obtained through this method and it was robust to most of the orientation and scale variations problems. In [10], a texture analysis scheme is presented that is based on an irregular tree decomposition structure, where the middle resolution sub-band coefficients are used for texture matching. In this scheme, an -dimensional feature vector is generated, based on the energies of the N most important sub-bands. Indexing is performed by matching the resulting feature vector of the query image with those of the target images in the database. In [21], a joint compression and classification approach was introduced at the compressed bit-stream level in the JPEG2000 framework. Compression and classification were compromised to achieve the best tradeoff point between them. We note here that all of the texture classification approaches reported in the literature are unidirectional in that the compression parameters are processed further to derive indices rather than the indices being used to enhance compression. It is our belief that significant performance gains can be achieved in addition to savings in computational complexity by exploring compression and indexing jointly. This is a critical motivation for the research work presented in this paper. Psycho-visual studies indicate that the HVS processes visual information in a multiscale manner like the wavelet transform. Based on this fact (and the fact that wavelet-based coding has been chosen as the transform technique for JPEG2000), we have chosen to explore the possibilities of using HVS-based texture characterization for joint compression and classification in the wavelet domain. In the HVS literature, many texture characterization techniques describe texture in terms of three main parameters, which are 1) spatial frequency magnitude (SFM), which refers to the local contrast as represented by each spatial frequency coefficient; 2) spatial frequency phase (SFP), which represents the spatial position (both up/down and right/left) of edges within a local region; and 3) spatial frequency orientation (SFO), which represents the angle of edges within a local region. In [2], Marr hypothesized that the content of images is analyzed by the HVS through several independent spatial frequency channels. Marr’s Laplacian-of-Gaussian (LOG) filters each represent a band of spatial frequencies with a different center spa-
1391
Fig. 1. Shows how an edge can be detected by a LOG (second derivative).
Fig. 2. Different signals crossing from positive to negative and all having a zero value at the same instant.
Fig. 3. Image after processing through four different LOG kernels that detect zero crossings.
tial frequency for each filter. Marr applied these filters that detect edges (Fig. 1) according to the following equation: (1) where is a two-dimensional (2-D) Gaussian filter, is the radial distance from the center of the circularly the variance of the symmetrical Gaussian function, and Gaussian. The LOG effectively detects edges in the image to which it is applied. Marr applied these filters to images, and observed that there are often points in the image where all of the filter outputs have zero crossings at the same spatial location (Figs. 2 and 3) These points are known as coincidents. Marr was able to detect these coincidents in any image by processing it through a number of filters that each represent a different spatial frequency. In general, previous HVP-based image compression algorithms have exploited SFM by quantizing the amplitude of each spatial frequency in such a way as to effectively assign fewer bits to the less important spatial frequency coefficients. However, both SFP and SFO have not yet been fully exploited for image compression. It is our contention that there are unexplored opportunities for perceptually based joint compression and classification, using SFP. In this paper, we will present a method for exploiting SFP. III. THEORY In the HVS, the content of the image is analyzed through a number of independent spatial frequency channels. Although
1392
IEEE TRANSACTIONS ON IMAGE PROCESSING, VOL. 15, NO. 6, JUNE 2006
Fig. 4. Two 90 phase-shift points from where you can calculate the magnitude of the signal and discard the phase.
these channels do not interfere substantially with each other, there are some points in the image where the spatial phase of all (or most) of the channels correlate with each other, and this produces a perceived visual feature. These points of coherence are known as coincidents. These coherence points are perceived as features when the signals of various spatial frequency channels at these points all have a zero value at the same location. The degree of spatial correlation of these coincident points represents the level of phase coherence between bands. Images that do not contain any coincidents are perceived to have no salient features. When the phase information in an image does not correlate between spatial frequency bands, its value is not well perceived. Hence, we can discard all (or most) of the SFP information in each wavelet band (spatial frequency band) during the compression process, and then assign an arbitrary phase value to each band when the image is reconstructed, without affecting the perceived content of the image. Although the original and the reconstructed images are represented by a different set of wavelet coefficients, the images are not perceived to be substantially different. Examples of these images include stochastic texture images, such as metal, fabric, etc. We define this type of spatial frequency phase as a translation phase. is defined by a phase component, Any sinusoidal signal and a magnitude component that can be calculated by taking the root of the sum of squares of any two 90 phase shift points in that signal, according to the following equation (Fig. 4): (2) The wavelet transform is accomplished with a pair of filters (a high-pass filter and a low-pass filter). The high-pass filter can be envisioned as the product of a pure sinusoid and a Gaussian signal, as shown in Fig. 6. The wavelet coefficient produced by this high-pass filter indicates the magnitude of a single spatial frequency in the original image within the filter’s neighborhood. By using two coefficients that are 90 apart, it is possible to compute the magnitude of this sinusoidal component, while ignoring the phase. In computing the magnitude for each neighborhood (while discarding the phase information), we derive a single value from each original pair of 90 phase-shifted wavelet coefficients. Thus, the amount of data used to represent the magnitude of the spatial frequency content is only half of that needed in the wavelet domain for that band. If this magnitude information can be shown to adequately represent the spatial frequency content
Fig. 5. Two 90 phase-shift points from a signal that is convolved with a wavelet function.
Fig. 6. High-pass kernel that is a product of a Gaussian signal with a pure sinusoid.
without the phase information, we can double the compression ratio, compared to wavelet compression alone. Fig. 5 shows the values used to implement a seven-element high-pass wavelet filter kernel as in [7]. The first element of this kernel corresponds to the zero crossing of the sinusoidal component of the high-pass filter. The fourth element corresponds to the peak value of that same sinusoidal component of the high-pass filter. Therefore, these two elements correspond to two points on that sinusoidal component that are 90 apart. This implies that wavelet coefficients that are shifted three locations apart in the transformed image correspond to samples taken 90 apart in the spatial domain if the seven-element high-pass wavelet filter kernel as in [7] is used, as in Fig. 5. In this paper, we apply Marr’s method (with some modifications) on multiple wavelet bands to characterize textures. We note here that Marr measured these coincidents across several frequency bands using a circularly symmetric LOG filter that does not pass any orientation data. However, the wavelet transform employs two spatial frequency filters, (one horizontal and one vertical) which do pass orientation data. The wavelet transform produces a 2-D matrix of wavelet coefficients: LL, LH, HL, and HH (Fig. 9). These coefficients collectively encode the spatial frequency magnitude and orientation at each locality within the original image. Applying this algorithm will discard the phase data in the LH and HL bands, which contain horizontal (low-pass horizontal data and high-pass vertical data) and the vertical direction phase data, respectively. However, there is no directional phase information in the LL and HH bands due to the circular symmetric kernels used to produce them. Hence, our proposed algorithm is only useful in the LH and HL bands. Our hypothesis is that these coherence points (coincidents) represent points of higher neural activity in the HVS. Based on this hypothesis, these points are perceived as “visual features” that can be used to gauge the similarity between texture images, which would be important in the classification of these images. For example, classification might be based on the density of coincidents.
FAHMY et al.: TEXTURE CHARACTERIZATION FOR JOINT COMPRESSION AND CLASSIFICATION
1393
Fig. 7. Four wavelet bands for one level of decomposition, where the shaded areas represents the results set of coefficients after applying our compression approach. This approach is only applied on the HL and LH bands and only in the low-pass power spectra direction for this band.
Fig. 8. Two figures showing a 2-D matrix of coefficients and their resulting matrixes after applying our coding approach (removing the phase coherence. (a) Without considering the difference of the signs on the resulting matrix and (b) considering the difference of the signs on the resulting matrix.
IV. EXTRACTING THE COINCIDENTS DATA FOR JOINT COMPRESSION AND CLASSIFICATION We first calculate the number of coincidents in an image in an attempt to characterize and classify texture. The number of coincidents in the image is a measure of the amount of perceptible phase information and, thus, the amount of perceived visual information that will be lost if the phase information is discarded. Thus, the number of coincidents can be thought of as a metric for the anticipated image degradation if our compression method is used. Step 1: Process the Image Through 16 Different Spatial Frequency Channels: In calculating the number of coincidents in the image, we follow a technique similar to Marr’s. We first process the image into 16 different spatial frequency bands. This is done with a 9 7 wavelet kernel, [7], using five levels of dyadic decomposition. Using this particular wavelet kernel makes our proposed approach compatible with the JPEG2000 standard. Step 2: Measure the Correlation Across All Bands: We then determine the number of coincidents in the image by: 1) counting the number of zero crossings at each point in the image across all 16 spatial frequency bands and 2) thresholding the summations at an empirically chosen value. Any value that survives the thresholding operation is considered to be a coincident. We note here that in order to overcome the problem of different subsampled wavelet channels with different sizes when counting the number of zero crossings in Step 1, we consider the spatial location of each zero crossing point with respect to the size of the 2-D channels as its location. Proposed Compression Algorithm: In order to discard the phase information, we replace each pair of coefficients at the two 90 shift points with the square root of the sum of the squares of the coefficients according to the following equation: (3) is the wavelet coefficient at the 0 phase-shift where is the wavelet coefficient at the 90 phasepoint and shift point for the kernel used. In order to make our algorithm compatible with JPEG2000, we use the 9 7 default kernel size. This single magnitude value then replaces both 90 phaseshift coefficient values; when synthesized at the decoder side, it is split back into two coefficients that are spaced by 3 (the equivalent of a 90 shift for the seven-element high-pass kernel is shifted by three coefficients which is half in [7]).
the length of the 9 7 kernel used. In case of another kernel, will be used where is half the length of the used kernel. The phase value that is used to split the single magnitude value into two coefficients is chosen arbitrary; however, it should be in the same quadrant of the original phase to minimize distortion. Hence, every two 90 shift points are replaced with their square root of the sum of the squares in addition to the signs of both the 90 shift points. These quadrant data (that are represented by the two signs) is important for reconstruction. (This will be explained next.) For the 2-D wavelet domain, we apply (3) in the high-pass kernel direction (vertical) Since the LH band contains only horizontal spatial frequency information, we can apply (3) only in the column direction (high-pass direction), as this is the direction that contains phase data. Similarly, in the HL band, (3) can only be applied in the row direction (high-pass direction). The shaded (gray) blocks in Fig. 7 show the resulting wavelet coefficients, after removing the translation phase in the image. Hence, for any wavelet decomposition, the arrays of coefficients for the LH band and the HL band can be shrunk to half their original sizes as in Fig. 7 according to (3) in the LH band in the horizontal direction, and the HL band in the vertical direction. The key idea here is that any two coefficients that have a phase shift of 90 can be replaced by one single coefficient and then the phase can be assigned arbitrary at the decoder side. It is not possible, however, to combined more than two coefficients and discard their phase as the amplitude component will be lost. Justification for Retaining the Phase Quadrant Data: Sometimes the wavelet coefficients at the two 90 phase-shift points used in (3) have the same sign, and sometimes they have different signs. However, this information is lost when the magnitude is computed, using the (positive) square root of the sum of the squares as shown in Fig. 8(a) (when the quadrant data are discarded). Some improvement in the reconstructed image can be obtained by retaining the signs of the original coefficients, which represent the quadrant of the original coefficient pair. In doing so, we retain a small portion of the spatial frequency phase encoded by the original wavelet coefficient pair, as shown in Fig. 8(b).
1394
IEEE TRANSACTIONS ON IMAGE PROCESSING, VOL. 15, NO. 6, JUNE 2006
Fig. 9. One-level wavelet decomposition showing each of the LL, LH, HL, and HH bands how it is processed through the low-pass or the high-pass kernels (dotted line) in both the horizontal and vertical directions (solid line).
Since the number of coefficients has been reduced to half, the resulting coefficient array looks like Fig. 7, where the shaded region represents the resulting coefficients. In our algorithm, we used the same phase angle value at the decoder side with all coefficients and with all channels but after determining the corresponding phase quadrant for each singe magnitude value. In order to measure the compression performance for our approach, we ran the subjective test to measure the quality for the reconstructed images. In order to measure the classification performance based on this approach, we ran subjective experiments to measure the perceived similarities between pairs within a set of textures. V. EXPERIMENTAL PROCEDURE Compression: We selected 100 texture images from wellknown texture databases [24] and [25]. We then calculated the number of coincidents in all of these images, using the method described in the previous section. Then, we applied our proposed compression technique to all of these images. The original and reconstructed images were then shown to subjects on a Sony 19-in monitor with a resolution of 1152 864 pixels. The viewing distance was 60 cm and the luminance conditions were according to the Consultative Committee for International Radio (CCIR) recommendations [6]. Both the original and the reconstructed images were displayed simultaneously, side-byside. Some of the subjects had a prior image processing background, and some did not. All of the subjects were all asked to give an evaluation of the degradation in the reconstructed image (as compared to the original image) according to the following scale: (5) “imperceptible;” (4) “perceptible, not annoying;” (3) ”slightly annoying;” (2) “annoying;” (1) “very annoying.” Fifty-five subjects participated in the experiment. Classification: In order to measure the similarities between textures, a subset of the 100 texture images was constructed, which consisted of 20 different texture classes, such as flower, sand, metal,…,etc. Each of these textures classes is represented by three or four images in the 100-image database. Subjects were given a query texture image from this subset of 20 different
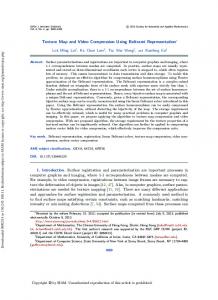
Fig. 10. Relation between the number of coincidents in different images and their MOS reconstruction quality after discarding phase information.
Fig. 11. Plot of the subjective similar on the horizontal axis (value of zero means the two images are identical, a value of 20 means they are the least similar), and a plot of the difference of the number of coincidents on the vertical axis. For three different texture images. Each line represents an image.
textures and asked to find the 20 images in the 100-textures images that looked the most similar (or as close as possible) to the query texture. Then they were asked to rank these 20 selected images from the most similar to the least similar. Subjects were asked to make this selection only based on their perception/consciousness or feeling, as this is usually resulted from the HVS neurons response from each image. For every query image, a metric was calculated based on the measured subjective similarity where a zero value between the query image and any candidate image indicated that they were identical (to the subject) and a 20 value meant that this candidate image was the least similar to this query image. VI. SIMULATION RESULTS Fig. 10 shows a plot of the mean opinion score (MOS) of the subjects, versus the number of coincidents for all of the 100 images. (Each point on this plot represents a single texture image.) Fig. 13 shows a sample of our original and reconstructed images using our proposed approach of discarding unperceived data. Fig. 11 shows a plot between the similarity metric (that ranges from 0 to 20 as described in the previous section) for a query image and its 20 retrieved images, and the differences between this pair of images in the number of coincidents. This curve is shown for three query images, where a type of line represents the curve for each image.
FAHMY et al.: TEXTURE CHARACTERIZATION FOR JOINT COMPRESSION AND CLASSIFICATION
Fig. 12. Changing the luminance and contrast in the image will result in changing the number of detected zeros crossing with the LOG model.
1395
decide whether phase removal will be useful. Increasing or decreasing the contrast of the original image (prior to compression) can change the MOS of the reconstructed image. This is due to the fact that distortions introduced by the compression/reconstruction process might be below the threshold of HVP when the original contrast is low, but are elevated above that threshold as the image contrast is increased. However, our proposed preprocessing step (which counts the number of coincidents) also includes a thresholding step in the wavelet transform process (due to a roundoff of the real number coefficients) so that low contrast images produce fewer zero crossings than high contrast images—and, thus, fewer coincidents. Thus, it is able to successfully predict whether the algorithm will produce satisfactory results to human evaluators. Fig. 12 shows the zero crossings detected within two metal images, one of which had its contrast enhanced, thus increasing its number of zero crossings. The number of zero crossings detected in the higher contrast image is clearly greater. Some subjects in our subjective translation phase removal experiments indicated that the reconstructed image is sometimes better than the original one, especially when the original image is somewhat blurred. We relate this to the fact that our approach discards the translation phases in different wavelet channels, and then assigns an arbitrary phase that is the same in all channels. This addition of a consistent phase to all channels produces more phase coherence in the reconstructed image, which allows the human observer to perceive additional features that were not perceived in the original blurred image. This seems to indicate that the addition of perceivable features to a blurred image decreases the perceived blurriness and, thus, increases the perceived image quality. This phenomenon might be useful in image enhancement and restoration applications. VIII. CONCLUSIONS
Fig. 13. Sample of images from our experiments, where the original image (left) and the reconstructed image looks identical for many subjects.
VII. DISCUSSION There is a hyperbolic relationship between the number of coincidents in an image and the reconstructed quality, as expressed by the MOS. In general, the higher the number of coincidents is in an image, the higher the degree of correlation is between the spatial frequency channels of the decomposed images, and the more likely humans can detect differences between the original and reconstructed images. Thus, the lower the MOS will be. In this paper, a method that determines the number of coincident points in any image, and then uses that information to
The exploitation of SFP and SFO is an immature (but promising) field of research. In this paper, we have presented a texture characterization approach that discards nonperceivable SFP images for joint compression and classification purposes. Our proposed approach exploited the phase coherence between different spatial frequency bands of the image as well as the circular symmetric radial phase coherence that exists in some spatial frequency bands. Extensive simulations have been performed with the proposed approach, where both types of coherences are exploited to enhance both the compression and classification performance. The proposed approach demonstrates its usefulness and has many promising future directions of research. REFERENCES [1] R. M. Haralick, K. Shanmugan, and I. Dinstein, “Texture features for image classification,” IEEE Trans. Syst., Man, Cybern., vol. SMC-3, no. 6, pp. 610–621, Nov. 1973. [2] D. Marr, Vision. San Francisco, CA: W. H. Freeman, 1982. [3] R. J. Safranek and J. D. Johnston, “A perceptually tuned subband image coder with image dependent quantization and post-quantization,” in Proc. ICASSP, Glasgow, U.K., 1989.
1396
[4] S. Mallat, “Theory for multiresolution signal decomposition: The wavelet representation,” IEEE Trans. Pattern Anal. Mach. Intell., vol. 11, no. 7, pp. 674–693, Jul. 1989. [5] M. Tuceryan and A. K. Jain, “Texture segmentation using Voronoi polygons,” IEEE Trans Pattern Anal. Mach. Intell., vol. 12, no. 2, pp. 211–216, Feb. 1990. [6] “Method for subjective assessment of quality of television pictures,” Int. Telecom Union, Geneva, Switzerland, CCIR Rec. 600-1, 1990. [7] M. Anotonini, M. Barlaud, P. Mathieu, and I. Duabechies, “Image coding using wavelet transform,” IEEE Trans. Image Process., vol. 1, no. 2, pp. 205–220, Apr. 1992. [8] M. Tuceryan and A. K. Jain, Texture Analysis. Handbook of Pattern Recognition and Computer Vision. Singapore: World Scientific, 1993, pp. 235–276. [9] B. Watson, “DCTune: A technique for visual optimization of DCT quantization matrices for individual images,” in SID Tech. Dig., vol. XXIV, 1993, pp. 946–949. [10] T. Chang and C.-C. J. Kuo, “Texture analysis and classification with tree-structured wavelet transform,” IEEE Trans. Image Process., vol. 2, no. 4, pp. 429–441, Oct. 1993. [11] T. Painter and A. Spanias, “A review of algorithms for perceptual coding of digital audio signals,” in Proc. Int. Conf. Digital Signal Processing, 1994, pp. 671–681. [12] J. R. Smith and S. F. Chang, “Transform features for texture classification and discrimination in large image databases,” in Proc. IEEE Intl. Conf. Image Processing, vol. 3, 1994, pp. 407–411. [13] B. S. Manjunath and W. Y. Ma, “Texture features for browsing and retrieval of image data,” IEEE Trans. Pattern Anal. Mach. Intell., vol. 18, no. 8, pp. 837–842, Aug. 1996. [14] M. K. Mandal, S. Panchanathan, and T. Aboulnasr, “Image indexing using translation and scale-invariant moments and wavelets,” Proc. SPIE: Storage Retrieval for Image Video Databases V, vol. 3022, pp. 380–389, Feb. 1997. [15] “Document N390R, New Work Item. JPEG 2000 Image Coding System,” ISO/IEC JTC1/SC29/WG1, 1997. [16] Hontsch and L. Karam, “APIC: Adapative perceptual image coding based on subband decomposition with locally adaptive weighting,” in Proc. ICIP, Washington, DC, 1997. [17] M. K. Mandal, “Wavelet based coding and indexing of image and videos,” Dept. Elect. Eng., Ph.D. dissertation, Univ. Ottawa, Ottawa, ON, Canada, 1998. [18] “Document N2502 (MPEG-4). Coding of moving pictures and audio,” ISO/IEC JTC1/SC29/WG11, 1998. [19] G. Van de Wouwer, P. Scheunders, and V. D. Dyck, “Statistical texture characterization from discrete wavelet representations image processing,” IEEE Trans. Image Process., vol. 8, no. 4, pp. 592–598, Apr. 1999. [20] “Document N3445 (MPEG-7). Overview of the MPEG 7 Standard,” ISO/IEC JTC1/SC29/WG11, 2000. [21] C. Liu and M. Mandal, “Image indexing in the JPEG2000 framework,” in Proc. ITCOM, SPIE, Boston, MA, Nov. 2000. [22] J. Bhalod, “Content-based image indexing in the wavelet domain,” M.Sc. thesis, Elect. Eng. Dept., Arizona State Univ., Tempe, AZ, 2000. [23] J. Bhalod, G. Fahmy, and S. Panchanathan, “A multi-resolution auto regressive model for texture classification,” in Proc. ISSPIT, Cairo, Egypt, 2001. [24] The NaturePix Reference Image Set is in the Public Domain, and May be Downloaded. [Online]. Available: http://cubic.asu.edu/vccl/imagesets/naturepix [25] “Vistex Database at the Vision and Modeling Group,” Mass. Inst. Technol. Media Lab, Cambridge, MA, 1995.
IEEE TRANSACTIONS ON IMAGE PROCESSING, VOL. 15, NO. 6, JUNE 2006
Gamal Fahmy (M’00) was born in Leeds, U.K. in 1973. He received the B.Sc. and M.Sc. degrees from Assiut University, Assiut, Egypt, in 1996 and 1998, respectively, and the Ph.D. degree in electrical engineering from Arizona State University, Tempe, in 2003. Currently, he is with the Faculty of Media Engineering and Technology at the German University in Cairo, Cairo, Egypt. From 2003 to 2005, he was a Research Assistant Professor with West Virginia University, Morgantown, where he worked on several identification and recognition projects in collaboration with different federal agencies in the United States, such as the Federal Bureau of Investigation, the National Institute of Justice, Transportation Security Administration, and the Department of Homeland Security. His research interests include image super-resolution, perceptual image compression, human vision, and biometrics (IRIS recognition and 3-D face recognition). Dr. Fahmy has served as a technical committee member and reviewer for several international conferences.
John Black, Jr. was born in Mexico, MO, on February 9, 1949. He received the B.S.E.E., M.S.E.E., and Ph.D. degrees in computer science from Arizona State University (ASU), Tempe, in 1972, 1984, and 2004, respectively. He was a Captain in the U.S. Army Reserve, worked in the industry for 13 years with Motorola, Phoenix, AZ, and Sperry Flight Systems, Phoenix; was a Founder of OpenSystems Publishing, Phoenix; and is the President of Micrology pbt, Inc., Phoenix. Currently, he is a Research Scientist with ASU. In 1981, he authored the VMEbus specification, which was approved by ANSI/IEEE and the IEC, as an international standard in 1987. He edited The System Engineer Handbook (Academic, 1992). Dr. Black is a member of ACM, and has served as the chairman of the ANSI/IEEE Standard 1014-1987 Technical Subcommittee.
Sethuraman Panchanathan (F’01) received the B.Sc. degree in physics from the University of Madras, Madras, India, in 1981, the B.E. degree in electronics and communication engineering from the Indian Institute of Science, Bangalore, in 1984, the M.Tech degree in electrical engineering from the Indian Institute of Technology, Madras, in 1986, and the Ph.D. degree in electrical engineering from the University of Ottawa, Ottawa, ON, Canada, in 1989. Currently, he is a Professor and Chair of the Computer Science and Engineering Department as well as the Director of the Institute for Computing and Information Sciences and Engineering, and Director of the Research Center on Ubiquitous Computing (CUbiC), Arizona State University, Tempe. He has published many research papers in journals and conferences and edited books. Dr. Panchanathan is a Fellow of the Society of Optical Engineering (SPIE). He has chaired several conferences and is an editorial board member of six international journals. He has also served as a Guest Editor of six special issues.