Food Biophysics (2013) 8:203–208 DOI 10.1007/s11483-013-9303-6
SPECIAL ISSUE ARTICLE
The Action of Ligands in the Aggregation Process of Soft Colloidal Solution Monitored by Raman Spectroscopy S. Caponi & M. Mattarelli & C. M. C. Gambi & F. Rossi & M. Montagna
Received: 1 March 2013 / Accepted: 5 June 2013 / Published online: 25 June 2013 # Springer Science+Business Media New York 2013
Abstract The formation of soft colloidal particles in solution and their aggregation process has been studied by Raman spectroscopy. The soft colloidal particles makes up at room temperature by the Sodium Dodecyl Sulfate (SDS) solution over the critical micellar concentration, while the micellar clustering is obtained adding in solution two different ligands: the Kryptofix 2.2.2 (K222) and crown ether 18-Crown-6 (18C6). The chosen ligands molecules are able to interact with the micellar interface inducing the cluster phase formation. Vibrational peaks fingerprints of the micelles formation have been observed and the evidences of the cluster-phase formation have been also achieved in the case of micelles solution doped with the two different macro-cyclic ligands. The ligands action is however different in the two cases as evinced by the careful analysis of the intensity and wavenumber evolution of characteristic Raman peaks at different ligants concentration values. The cluster phase formation and the effects induced on the hydration layer are analyzed showing how Raman spectroscopy is able to gain insight into selfassembly of soft colloidal particles. Keywords Soft colloids, micellar solutions . Aggregation processes . Raman spectroscopy S. Caponi (*) Istituto di Biofisica, Consiglio Nazionale delle Ricerche, c/o FBK via alla Cascata 56/C, 38123 Trento, Italy e-mail:
[email protected] M. Mattarelli NiPS Laboratory, Dipartimento di Fisica, Università di Perugia, Via A. Pascoli, 06123 Perugia, Italy C. M. C. Gambi Dipartimento di Fisica, Università di Firenze and CNISM, via G. Sansone, 50019 Sesto Fiorentino, Firenze, Italy F. Rossi : M. Montagna Dipartimento di Fisica, Università di Trento, via Sommarive 14, 38123 Povo, Trento, Italy
Introduction The complex behavior of soft matter offers often surprising physical results. For this reason in the last years suspensions of colloids or nanoparticles have attracted considerable attentions from both fundamental and practical viewpoints [1–3]. For example new and unexplored aggregation states, both ordered (colloidal crystals) and disordered (gels and glasses), can be developed [4–7]. The phase diagram of hard sphere colloidal solution shows the presence of attractive glasses, repulsive glasses and re-entrant liquid phases [8]. Increasing the particles complexity as in the case of soft colloids or patchy particles, due to their deformable shape and sophisticated inter-particle potentials, new scenarios in the phenomenology of aggregation processes and arrested states can be revelled [9( 10]. In this framework, aqueous micellar solutions of ionic surfactants represent an interesting colloidal self-assembling system not only as a model system in soft matter physics but also because of the numerous applications in different technological fields. In fact, they allow the formation of the simplest self assembled amphiphilic vesicles which can mimic other more complex structures, such as oil-in-water microemulsions, bilayers vesicles and phospholipid membranes. All these systems, of clear biological and technological interest, share with micelles the same interfacial region between the external surface and the aqueous dispersing medium. In the present work, we study aqueous self-assembled micellar solutions obtained by Sodium Dodecyl Sulphate (SDS) over the critical micellar concentration (cmc), which is 8.1 mM at temperature T=22 °C [11]. The surfactant polar head of SDS is composed by the sulfate group with one negative charge and by the positive sodium counter-ion, partly bound to the heads and partly dispersed on the diffuse layer [11], while the hydrophobic tail is constituted by a saturated hydrocarbon chain (−C12H25). The colloidal suspension is composed by charged
204
soft particles and the aggregation can be only induced by the addition of ligands, particles or polymers able to link the micelles surface screening their charge. In fact, the ligands are neutral organic molecules, able to selectively form stable non-covalent host/guest complexes. They enclose some of the sodium counter-ions in solution and they migrate to the micellar surface reducing its net charge as reported in the literature [11]. The ligand affinity to complex counter-ions in solution seems to be the main driving force to significantly change the micellar microstructure and the inter-micelle interactions. The complex micelle-ligants gives rise to decorated micelles or patchy-micelles. In fact, the system can be modeled as a suspension of particles decorated on their surface with a well-defined number of adhesive sites (the ligand molecules in our case) which are able to link similar sites on other micelle aggregate, giving rise to the formation of clusters [12]. From the microscopic point of view, the delicate balance between short-range attractive and long-range repulsive potential turns in the appearance of stable kinetically arrested cluster phases, where single particles stuck and form relatively large complexes [13( 14]. In order to study the influence of the ligand in the cluster properties, two different types of attractive ligands were considered: Kryptofix 2.2.2 (K222) specific to complex Na+ and a non-specific one the crown ether 18Crown-6 (18C6) [15( 16]. It was found that K222 ligand is more efficient to induce micellar aggregation than the 18C6. Furthermore, the cluster size increases proportionally to the ligand content. The experimental techniques able to gain insight on the shape and size of the micelles and their aggregates are small-angle x-ray scattering (SAXS), small-angle neutron scattering (SANS) or dynamic light scattering (DLS) [11]. Recently, these systems were probed by dielectric and Raman spectroscopies which are able to analyze the relaxational and the vibrational dynamics and their changes with the cluster formation [15( 16]. These new experimental techniques confirm the previous results: the dielectric spectroscopy showing how the addition of ligands causes relevant changes in the overall dielectric relaxation spectrum [15]; the Raman spectroscopy evidencing the aggregation process by following the evolution of both the intensity and the wavenumber of characteristic Raman peaks [16]. In a recent publication we quantified the effect of the aggregation of micelles by comparing the spectra of the mixed system, namely micelles doped with ligands, with the sum of the spectra of the two single components in the right concentrations ratio [16]. Here, we present new experimental data on SDS micelles in water and of decorated micelles in clusters, aimed to show in greater detail the effects on the vibrational properties arising from the use of different macrocyclic ligands.
Food Biophysics (2013) 8:203–208
Experimental SDS purchased from BDH, England (C12H25SO4−Na+, Mw 288.4 g/mol purity 99 %) was dissolved in water at molar concentration of 0.3 M, well above the critical micelle concentration equal t o 8.1 mM at 22 °C. The solutions were obtained using high purity water taken from a Millipore Milli-Q apparatus. K222 (C18H36N2O6, Mw 376.50 g/mol) and 18C6 (C12H24O6, Mw 264.32 g/mol) purchased from Merck were added to the micellar solutions with different molar ratios (0.5, 1.0 and 1.5 ligand/surfactant) and samples of pure ligands solution at the concentrations of 0.13 M, 0.25 M and 0.37 M (corresponding to the same concentration as the doped SDS solution) were also prepared. The Raman spectra are performed usind a micro-Raman setup (Horiba Jobin-Yvon, model LabRam Aramis), equipped with a HeNe laser, an edge filter, a 1,800 grooves/mm grating, and a Peltier cooled CCD detector. The used exciting source was 632.8 nm, it was focused onto the sample through a 10X objective. The dried samples were deposited onto a glass slide under the microscope-objective, whereas the aqueous samples were contained in a glass tube on the microscopestage and the laser beam was horizontally deflected by a 45° mirror mounted on the microscope. Spectra were collected in the 100–3,800 cm−1 range with a resolution of about 2 cm−1. The spectra are corrected subtracting the luminescence contribution.
Results and Discussion Figure 1 shows the Raman spectrum of clusterized SDS micelles at 0.3 M doped with K222 at the ligand/surfactant molar ratio of 1.0. For comparison, the spectrum of water and the spectra of micelles, already present in the literature [17–19], and K222 solutions are also shown. The spectra of the SDS solution over the CMC present the vibrational peaks fingerprints of the micelles formation. In particular the modification of the symmetrical and antisymmetrical vibration modes of CH2 groups situated in the region 2,800–3,000 cm−1 and of the skeletal vibrations (C-C binding) in the region 1,050–1,150 cm−1, can be associated with a disorder–order transition [17]. To analyse in deeper detail the vibrational properties of the micelles cluster phase, we removed the bulk water contribution from the spectra. The Raman data of aqueous samples were normalized to the O-H stretching band of water (3,000–3,800 cm−1) and the water spectrum was subtracted from those of the solutions. The so obtained solvent free spectra are reported in Figs. 2 and 3 in a wide frequency range for the SDS micelles at 0.3 M respectively doped with K222 and 18C6 at three different molar ratio (0.5, 1.0 and 1.5
Food Biophysics (2013) 8:203–208
205
a
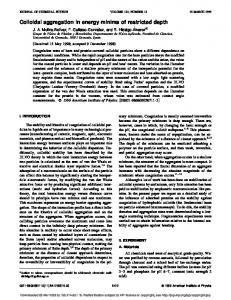
b Fig. 2 Raman spectra of SDS micelles at 0.3 M respectively doped with K222 at three different molar ratio (0.5, 1.0 and 1.5 ligand/surfactant). For comparison, in the figure the spectra of the SDS micelles (green circles) are also reported
Fig. 1 Comparison between the spectra of water, thin blue line, the aqueous ligand K222, solid black line, the aqueous SDS micelles at 0.3 M, green line with circles, and the SDS micelles doped with ligand K222 at 1.0 ligand/surfactant molar ratio, squares magenta, in the vibrational region 500–3,600 cm−1 (a), and in the expanded wavenumber range 400–1,600 cm−1 (b)
ligand/surfactant). For comparison, spectra of the SDS micelles are also reported. From the simple comparison of the Figs. 2 and 3, it is clearly visible that the modifications in the vibrational dynamics are more pronounced in the case of the ligands K222, where a large number of additionally peaks appear in the spectra, than in the case of 18C6. This simple observation confirms that the K222 ligand is more efficient than 18C6 to link the micelles as expected by its specific ability to complex the Na+ ions. The data show that the intensity of the peak at 1,063 cm−1 assigned to the C-C trans skeletal vibrations [19] remains constant while the other peaks show a clear modification when the ligands are added in solution or its relative concentration is modified. In particular, just from the raw data reported in Fig. 1, the vibrations in the frequency region between 400 and 850 cm−1 undergo well visible changes. Clear peaks located at 540, 740 and 840 cm−1 appears in the
spectra. According to molecular simulations [16( 17] they have to be attributed to the SDS polar heads vibrations, in particular of SO3 (between 400 and 650 cm−1) and SO-C groups (around 840 cm−1). The measurements show that the vibrations of SO3 group are influenced by the interaction with the ligand molecules or with Na+ counter-ion complexed by the ligands. In fact, both ligands are able to form stable noncovalent host/guest complexes enclosing the sodium counterions of the Gouy–Chapman layer. The sodium/ligand complex migrates from the bulk solution to the interfacial region of the micelles modifying the micellar surface and reducing the charge of the micelles [20( 21]. The main modifications in the vibrational dynamics are hence expected for the atoms located near the interaction surface.
Fig. 3 Raman spectra of SDS micelles at 0.3 M respectively doped with 18C6 at three different molar ratio (0.5, 1.0 and 1.5 ligand/surfactant). For comparison, in the figure the spectrum of the SDS micelles (green circles) is also reported
206
Raman spectra corroborate this expectation: the peak at 1,063 cm−1, whose frequency and intensity are not appreciably modified, is associated to C-C trans skeletal vibrations of the hydrophobic tail which remains protected inside the micelles structure. On the contrary the vibrations of the polar heads, exposed to the surface, strongly experience the interactions. New peaks appear in the spectra in Figs. 2 and 3. The main ones, found at 840–880 and 1,470 cm−1, are related to the modification of the vibrational modes of the micelles and the ligands once the sodium/ligand complex is formed and the interaction with the micelles surfaces takes place. The modifications include the frequency region where the SO-C group vibrations (around 840 cm−1) are present, as well as the frequency region characteristic of CH2 bending mode around 1,470 cm−1 [16]. In fact, such peaks can be considered markers of the cluster formation and their presence have been found using both ligands. We would emphasize that the CH2 group even if present in the SDS tail, it is also found in the macro-cyclic ligands whose vibrations, independently from the cluster formation, will be modified once the host/guest complexes are formed. In order to gain deeper insight into the characteristic features of the cluster phase vibrational modes, we studied in particular the region of the S-OC stretching, which shows strong modification once the aggregation process took place as evident in Fig. 4. In the figure, we report the Raman spectra of SDS micelles at 0.3 M doped with ligands at three different molar ratio (0.5, 1.0 and 1.5 ligand/surfactant). The data of the upper panel are relative to K222, those of the lower panel to 18C6. For comparison the spectra of the pure ligands in solution and of the undoped micelles are also shown. The spectrum of SDS micelles doped with K222 shows that new relatively strong structures appear in a region (around 840 cm−1) where no Raman active modes of the micelles and of the ligands alone are present. The intensity of the new peaks in the frequency range between 800 and 860 cm−1 increase with the ligand concentration, but a saturation effect seems to be present, since the spectrum for 1.5 is very similar to that for 1.0. The number of ligand molecules that can attach to the micelle is limited by the number of free Na+ in solution. One should expect that the saturation occurs for equal concentrations of SDS and ligands. However the efficiency of the linking process is lower that one and a significant fraction of ligand molecules may remain in solution at any concentration [21]. In any case for the K222 a saturation effect appears at about 1 ligand/surfactant molar ratio, so that, probably for a steric effect, not any polar head is effectively screened. Over this concentration, additional ligands molecules will not induce a further aggregation but will remain free in solution. A similar saturation effect seems to be present also in the system with the 18C6 ligands. The main effect of the micelle-ligand interaction is the appearance of a peak
Food Biophysics (2013) 8:203–208
a
b
Fig. 4 a Raman spectra of SDS micelles at 0.3 M respectively doped with K222 at three different molar ratio (0.5, 1.0 and 1.5 ligand/surfactant). The spectra of the solution of pure ligand (1.5 concentration) and of SDS micelles at 0.3 M are also shown. b Raman spectra of SDS micelles at 0.3 M respectively doped with 18C6 at three different molar ratio (0.5, 1.0 and 1.5 ligand/surfactant). Solid line report the spectrum of the solution of pure ligand (1.0 concentration) spectra of SDS micelles at 0.3 M
centered at 870 cm−1, on the high frequency side of the 860 cm−1 peak of the free ligand. Both peaks increase in intensity with the ligand concentration going from 0.5 to 1.5, but in the last step the first peak of the free ligand becomes again dominant. Again, this saturation effect occurs at a concentration ratio ligand/surfactant of about one. Figures 5 and 6 show the Raman spectra in two different spectral regions, where bending vibrations of CH2 and CH3 are located. These vibrations involve atoms located along the hydrophobic chain of the SDS and along the ring of the ligands [15]. Again, the data of the upper panels are relative to K222, those of the lower panel to 18C6. Also in this case, the spectra of the pure ligands in solution are shown for comparison and in the upper panel the spectrum of the dry ligand powder is also shown. The powder spectrum is arbitrarily scaled, since the experimental conditions on powders and liquid in a cell are very different. A first important observation is that the Raman spectra in these frequency regions are quite different in the dry and hydrated systems for both ligands (and also of the SDS, not reported). This is
Food Biophysics (2013) 8:203–208
207
because the hydratation water strongly changes the dynamics of bending of the chains. A second observation is that the spectra of Fig. 5b for 18C6 appear nearly as the sum of the separated contributions of the micelles and the ligand in solution respectively. This is not the case for K222, where a number of new peaks appear in the cluster spectrum. These peaks resemble the features of the spectrum of the dry K222 ligand even if they are slightly shifted in frequency. The shift can be explained by the modification in the vibrational modes related to the strong interaction between the CH2 when the complex K222 - Na+ ion is formed. The appearance of the features of the dry spectrum seems to indicate that once the cluster phase is formed the water is removed from the patchy sites located between two different ligands. Similar indication can be achieved by Fig. 6. The peak at 1,470 cm−1 in the K222-micelle spectra is not present in the
a
b
a
b
Fig. 5 a Raman spectra of SDS micelles at 0.3 M respectively doped with K222 at three different molar ratio (0.5, 1.0 and 1.5 ligand/surfactant) as shown in the caption. For comparison, in the figure the spectra of the SDS micelles are also reported (green circles) together with the 0.37 M ligands solution and the spectrum of the crystalline ligands powder. b Raman spectra of SDS micelles at 0.3 M respectively doped with the ligands 18C6 at three different molar ratio (0.5, 1.0 and 1.5 ligand/surfactant) the spectra of the SDS micelles alone and 0.25 M ligand solution as shown in the label
Fig. 6 a Raman spectra of SDS micelles at 0.3 M respectively doped with K222 at three different molar ratio (0.5, 1.0 and 1.5 ligand/surfactant) as shown in the caption. For comparison, the spectra of the SDS micelles (green circles) together with the ligand solution (thin blue line) and the spectrum of the crystalline ligands powder (black line) are also reported. b Raman spectra of SDS micelles at 0.3 M respectively doped with the ligands 18C6 at three different molar ratio (0.5, 1.0 and 1.5 ligand/surfactant). For comparison, the spectra of the SDS micelles (green circles) together with the ligand solution (thin blue line) and the spectrum of the crystalline ligands powder (black line) are also reported
spectra of the micelles and the K222 alone. Also in this case, even if slightly hidden by the growth of the broad free ligand contribution, the saturation effect is observable. On the contrary, in this frequency range no evident features typical of the 18C6-micelles system are observed and the Raman spectra are nearly the sum of the contribution of the two independent systems. The previous analysis evidences the different microscopical action of the two kinds of ligands. It is known that 18C6 has a minor affinity than K222 to complex the Na+, for this reason K222 is more efficient into inducing clusterization of micelles. In particular, it has been found that the percentage of interfacial ligand molecules in relation to the total surfactant ones, in the case of 18C6 is about 10–15 %, which is about 1/5 of the value obtained for K222 [21]. Our Raman data confirm this picture. The Raman spectra of the micelles cluster obtained using the ligand 18C6 show
208
minor modification of the vibrational dynamics of components, micelles and ligands. In the case of K222, new evident features appear in the Raman spectra of the K222-micelles cluster. This suggests the ability of K222 to link the Na+ ions, to efficiently induce the micelles aggregation process and to partially remove the water from the patchy region.
Conclusions Raman spectroscopy, which is largely used for to characterize a huge amount of different materials ranging from glasses and polymers [22( 23] to sugar solution [24( 25], ancient artifacts [26] and porous systems [27], has been used to provide information on the local interaction and the vibrational modification induced by the aggregation processes in micellar solutions. In the present paper, we studied the aggregation of surfactant molecules in water. They form organized self-assemblies which are of interest as analogues of biological structures, as model systems for studying complex phase behaviour, and because of their technological importance, for example to the food and paint industries. This last argument presents implications of clear interest in food science, where the common example of colloidal aggregation in the casein micelles is intensely investigated [28–31]. In order to understand the properties of casein micelles it is in fact necessary to appreciate their colloidal character and the understanding of their aggregation mechanisms is of crucial importance for the production of flocculated and gelled products such as yogurt, cheese, and ice-cream. By our work we confirm that, doping with the two different ligands the SDS micelles solution, the cluster phase formation is obtained. In fact new vibrational peaks appeared in the spectra: they were the signature of the interaction between the ligand-micelle and the ligand-ligand in the patchy site. The different interaction ability of the two ligands was here analysed. Important changes of shape and intensity of the Raman bands of the ligands has been obtained in the case of the ligand K222 confirming that it is more efficient than 18C6 to complex the ion Na+ and to drive the micelles aggregation. An important insight has been also obtained for the characterization of the local microscopic environment around the K222 ligand in the cluster phase: the hydration shell is strongly modified and a vibrational dynamics similar to that of the dry systems seems to appear. This indicates that water is removed from the region of the aggregation. The same behaviour is not obtained in the case of the SDS-18C6 aggregates, where instead the spectrum of the ligand in solution is the dominant contribution. A saturation effect, for which the ligands remain free in solution over a critical concentration, evidenced by precedent SANS results [16], has been also confirmed by our data.
Food Biophysics (2013) 8:203–208
The sensitivity of the Raman spectroscopy to the local arrangement of the vibrating units is a powerful tool for the characterization of the local environment in the patchy region and for the analysis of interactions that drive to the formation of aggregates. This additional information about the microscopic environment and its modification probed following the vibrational dynamics of different atomic groups allowed by Raman spectroscopy to fruitful integrate the complementary information obtained by the usual experimental techniques able to characterize the shape and size or the cluster phase. Acknowledgements We thank Nanomax (N-CHEM) Progetto Bandiera (CNR) for partially supporting this activity.
References 1. 2. 3. 4. 5. 6. 7. 8. 9. 10. 11. 12. 13. 14. 15. 16. 17. 18. 19.
20. 21. 22. 23. 24. 25. 26. 27. 28. 29. 30. 31.
F. Romano, F. Sciortino, Nat. Mater. 10, 171 (2011) D.J. Kraft et al., PNAS 109, 10787 (2012) S. Corezzi, D. Fioretto, F. Sciortino, Soft Matter 8, 11207 (2012) M. Mattarelli, M. Montagna, T. Still, D. Schneider, G. Fytas, Soft Matter 8, 4235 (2012) T. Still, M. Mattarelli, D. Kiefer, G. Fytas, M. Montagna, J. Phys. Chem. Lett. 1, 2440 (2010) S. Caponi, S. Corezzi, D. Fioretto, A. Fontana, G. Monaco, F. Rossi, Phys. Rev. Lett. 102, 027402 (2009) D. Fioretto et al., J. Chem. Phys. 128, 214502 (2008) K.N. Pham et al., Science 296, 104 (2002) B. Ruzicka et al., Nat. Mater. 10, 56 (2011) B. Capone et al., Phys. Rev. Lett. 109, 238301 (2012) S. Marchetti et al., J. Phys. Chem. B 117, 3613 (2013). and references therein L. Lanzi, M. Carlà, L. Lanzi, C.M.C. Gambi, J. Colloid Interface Sci. 330, 156 (2009) D. Truzzolillo, F. Bordi, F. Sciortino, C. Cametti, Eur. Phys. J. E 29, 229 (2009) F. Bordi, C. Cametti, C. Marianecci, S. Sennato, J. Phys. Condens. Matter 17, S3423 (2005) S. Sennato, S. Marchetti, C.M.C. Gambi, C. Cametti, J. Non-Cryst. Solids 357, 754 (2011) G. Cazzolli et al., J. Raman Spectrosc. 43, 1877 (2012) M. Picquart, J. Phys. Chem. 90, 243 (1986) R.P. Sperline, Langmuir 13, 3715 (1997) A.R. Paschoal, A.P. Ayala, R.C.F. Pinto, C.W.A. Paschoal, A.A. Tanaka, J.S. Boaventura Filho, N.M. Josè, J. Raman Spectrosc. 42, 1601 (2011) P. Baglioni, C.M.C. Gambi, R. Giordano, J. Teixeira, Colloids Surf. A 121, 47 (1997) L. Scaffei, L. Lanzi, C.M.C. Gambi, R. Giordano, P. Baglioni, J. Teixeira, J. Phys. Chem. B 106, 10771 (2002) M. Zanatta et al., J. Chem. Phys. 135, 174506 (2011) B. Rossi et al., J. Phys. Chem. B116(17), 5323–5327 (2012) B. Rossi et al., J. of Raman Spectroscopy 42, 1479 (2011) L. Comez et al., J. Phys. Chem. Lett. 4, 1188–1192 (2013) S. Gialanella et al., Archaeometry 53, 950–962 (2011) S. Caponi et al., J. of Non-Cryst. Solids 307, 135–141 (2002) R. Tuinier, C.G. de Kruif, J. Chem. Phys. 117, 1290 (2002) D. Michael Byler, H.M. Farrell Jr., J. Heino Susi, Dairy Sci. 71, 2622 (1988) A. Syrbe, W.J. Bauer, H. Klostermeyer, Int. Dairy J. 8(3), 179 (1998) J.A. Lucey, H. Singh, Food Res. Int. 30, 529–542 (1997)