Economic Design ELSEVIER
EconomicDesign 2 (1996) 163-192
The allocation of a shared resource within an organization John O. Ledyard a, Charles Noussair b,. , David Porter
a
a California Institute of Technology, Pasadena CA 91125, USA b Department of Economics, Krannert School of Management, Purdue University, West Lafayette, IN 47907, USA
Revised 1 June 1996
Abstract Many resources such as supercomputers, legal advisors, and university classrooms are shared by many members of an organization. When the supply of shared resources is limited, conflict usually results between contending demanders. If these conflicts can be adequately resolved, then value is created for the organization. In this paper we use the methodology of applied mechanism design to examine alternative processes for the resolution of such conflicts for a particular class of scheduling problems. We construct a laboratory environment, within which we evaluate the outcomes of various allocation mechanisms. In particular, we are able to measure efficiency, the value attained by the resulting allocations as a percentage of the maximum possible value. Our choice of environment and parameters is guided by a specific application, the allocation of time on NASA's Deep Space Network, but the results also provide insights relevant to other scheduling and allocation applications. We find (1) experienced user committees using decision support algorithms produce reasonably efficient allocations in lower conflict situations but perform badly when there is a high level of conflict between demanders, (2) there is a mechanism, called the Adaptive User Selection Mechanism (AUSM), which charges users for time and yields high efficiencies in high conflict situations but, because of the prices paid, in which the net surplus available to the users is less than that resulting from the inefficient user committee (a reason why users may not appreciate 'market solutions' to organization problems) and (3) there is a modification of AUSM in which
* Corresponding author. Tel.: (+1)
[email protected].
317-494-4416; fax: (+1) 317-494-9658; e-mail:
0928-5040/96/$15.00 Copyright 9 1996 Elsevier Science B.V. All rights reserved. PII S0928-5040(96)00010-6
164
J.O. Ledyard et al. / Economic Design 2 (1996) 163-192
tokens, or internal money, replaces real money, which results in highly efficient allocations without extracting any of the users' surplus. Although the distribution of surplus is still an issue, the significant increase in efficiency provides users with a strong incentive to replace inefficient user committees with the more efficient AUSM. JEL classification: C92 Keywords: Scheduling; Auctions; Mechanism design
1. Introduction Typically, shared resources are centrally financed and managed by an organization and used in various ways and intensities by diverse members of that organization. Examples of such resources include supercomputers, observatories, motor pools, legal advisors, lab facilities, etc . . . . i The methods and processes by which shared resources are allocated often evolve in a common pattern. We offer our stylized version here. In the beginning, the resource is proposed by potential users, designed by engineers, and financed and managed by bureaucrats. Many of these actors have a political stake in the performance and utility of the resources: thus, they want to keep control. The initial management structure is often a combination of user committees and bureaucratic responsibility. As long as desired use is not much larger than capacity, committee meetings and bureaucratic negotiation can usually overcome what little conflicts may arise in determining who gets what use of the shared facility. However, increases in demand or decreases in usable capacity can easily lead to congestion in the system and to contentious non-negotiable conflicts among users. If it is not possible, or is costly to expand the resources, the next step usually involves asking users and bureaucrats to streamline their decision processes. Decision Support Teams are often summoned to help facilitate the process. They provide computer programs (sometimes involving various voting mechanisms) which are intended to speed up the existing processes. Using valuation and resource requirement information provided by the users, the algorithms may heuristically solve very complex optimization problems in an attempt to compute good allocations. Unfortunately, these support programs tend to ignore the fact that users have incentives to bias the information they provide to the algorithm in order to achieve more favorable allocations. The new support systems work faster but congestion remains as much of a problem as before. Value is foregone.
i Another similar class of situations includes resources managed by the government for the private sector such as the electromagnetic spectrum managed by the FCC and airports managed by local governments. Virtually everything in this paper applies to these publicly managed assets. See for example Bykowsky et al. (1995) for related work on the FCC spectrum problem.
J.O. Ledyard et aL/ Economic Design 2 (1996) 163-192
165
At this point, in desperation, economists are sometimes called for advice. Their usual response is 'auction it off' or 'price it at marginal cost', forgetting at least two facts that lead users to ignore the economists' advice. First, users who have been getting something for nothing will now have to pay to obtain an allocation. Thus, even if allocative efficiency improves and value increases, the users can be worse off because the bureaucracy may capture more in rents than the increase in the value of the allocations. So the users will use whatever political clout they have to block these 'economic solutions'. Second, even if the political resistance can be overcome, for example by the use of grandfathered allocations, 2 these scheduling problems can involve significant non-convexities which cause prices to be unable to function as coordinating devices. Thus even if the economists' advice is taken seriously, the results may be less than satisfactory and yield allocations no better for users than current processes are producing (see Banks et al., 1989). In this paper we explore a different approach to finding solutions for congestion in shared resources: applied mechanism design. (See Ledyard (1993) for a summary of the approach.) We argue that new processes can be designed which improve upon congested user committees and other regulatory administrative procedures. The constraints on the design process, in addition to those familiar to economists such as incentive compatibility and budget balancing, include limits on the computational capability of any algorithm used and political constraints which must be satisfied if the mechanism is to be acceptable to the parties involved as a replacement to current procedures. This approach to the design of new mechanisms is ideally pursued by the combination of theorists, who can analyze some of the properties of an allocation mechanism, and experimental economists, who use the laboratory to test the performance and refine the procedures for demonstration and actual use. When theoretical knowledge is not sufficient to describe the behavior of individuals in a mechanism in the environment under study, the economist can still create new mechanisms, the choice guided by theoretical intuition and previous empirical evidence from other environments. The laboratory can then be used to test and improve the performance of the new mechanism in an environment based on the field application of interest. This approach to design is similar in spirit to the aircraft designer who uses wind tunnels to create new airplanes. In this paper, we report the results from a set of experiments designed to provide a testbed and a demonstration of proof of concept. We based our experiments on a systematic study of a specific shared resource problem, the allocation of tracking time of NASA's worldwide Deep Space Network (DSN) of antennas. While one may or may not be interested in the DSN allocation problem,
2 An interesting example of this can be found in Riker and Sened (1991) based on work of Grether et al. (1981).
166
J.O. Ledyard et a l . / Economic Design 2 (1996) 163-192
the approach we take and the results of our performance tests have a wide range of application to scheduling and other allocation problems. Our approach is straightforward to replicate. We first try to extract those elements of the situation that are most relevant to the mechanism design problem. For the DSN problem, we report this aspect of our research in Section 2 and Section 3 below. Using these historical and theoretical analyses, we then create a class of environments, our wind tunnel parameters, within which to test various organization designs. Next, we try to construct an experimentally testable version of the current process as a benchmark against which to test new designs. Then we create, being guided by relevant theory and experimental evidence, new mechanisms which we think will solve the allocation problem. Finally, we test the mechanisms in the environments. At this point we can eliminate designs with obviously poor performance and can fine tune the procedures (including stopping rules, information structures, etc.) for the designs that seem promising. The results of this experimental analysis are contained in Section 6. We conclude with a summary of lessons learned. We turn now to the details.
2. A little background The Deep Space Network is a worldwide network of antennas managed by the Jet Propulsion Laboratory (JPL) for NASA. The network is used to provide uplink and downlink communication with spacecraft in deep space. There are currently ten flight projects in deep space using the network, four ground based radio/radar astronomy projects and maintenance activities, three planned missions, and five pre-planning stage missions which will require use of the antennas. The antennas are located at three different locations, allowing for continuous tracking of a spacecraft, and there are three types of antennas (34 meter High Efficiency, 34 meter beam waveguide, and 70 meter) at each location. Each antenna may be directed to at most one user at a time. Demand varies greatly among users and across their lifetimes. For example, the Voyager and Pioneer missions are over 15 years old, have completed their prime missions, and are now in an extended mission mode at the outer reaches of o u r solar system; on the other hand, the Galileo mission to Jupiter and Ulysses solar polar mission are still en route to their prime targets. In addition, demands are interrelated since the goal of the organization is overall mission success. Therefore, scheduling in this environment is a very dynamic process. Scheduling of the antenna time has been facilitated by the use of a decision support system and a series of user committees. There are currently the equivalent of 15 full time employees involved in constructing and updating time schedules, which tentatively assign each antenna beginning ten years in advance. For two years in advance, detailed minute by minute schedules are provided which can be
3".0. Ledyard et aL / Economic Design 2 (1996) 163-192
167
edited until the date scheduled. Heuristic look ahead algorithms help with the provision of initial schedules and aid long-term planning. However, despite the amount of resources used in the scheduling process, there remains widespread contention for resources and significant amounts of committee time used to resolve schedule conflicts. Recently, some effort has been made to commit to resource 'allocations' early so that projects can plan well in advance. However, there is still an oversubscription of resources and changes are commonplace.
3. A theoretical framework The DSN is an example of a shared resource. T h e abstract structure of the allocation problem associated with shared resources is straightforward. There is a set, X, of resources to be allocated. Examples include time on an antenna, a computer memory, volume in the bay of a space shuttle, time with a consultant, the draw o f power from a shared battery, or broadcasting over a particular spectrum band in a specific geographic area. There are a set of potential users of these resources, I = {1. . . . . n}. A feasible allocation assigns a subset X; G X to each i so that the collection of sets X 0, X 1. . . . X, is a partition 3 of X. In some cases there are natural obvious partitions, as for example with rooms in a dormitory, and in other cases there is not, as in time on an antenna. Users get utility or profits from each subset which we denote u i ( x i ) . 4 We will assume throughout that a user's total utility is u i ( x i ) - yi where Yi is the money paid to receive the use of X i. An efficient feasible allocation a = ( X I . . . . . X.) is one such that there is no other feasible allocation d = ( X t'. . . . . X ' ) such that ~ .>i = l Uni( X i ), n 32i~ 1U i (Xi). Thus, an efficient allocation solves max
Eui(xi)
(1)
X1''"'X~v i
subject to n
Ux, c_x
(2)
i=1
and
X~ N Xj = QV i,j e I.
(3)
3 U ~_ o Xi = X and X i [7 Xj = ~ for all i,j ~ L X o is the subset of unassigned resources. 4 We think of U~(X~) in the DSN problem as the scientific return to user i from receiving a subset of the resources. We suppose that the organization, JPL, is interested in maximizing the overall scientific return from the resources. Since each user wants to maximize his own return, he will generally want to acquire more resources than he would receive at the organization's optimum. We are assuming the U ~does not include any private, non-scientific benefits to user i, a reasonable assumption for the DSN example.
168
J.O. Ledyard et al. / Economic Design 2 (1996) 163-192
If the u i ( . ) were known, this would be a complex non-linear computation which, in principle, could be solved or approximated. One might be tempted to simply turn it over to the operations research department. The only difficulties would be computational complexities. However, in many applications the users want to maximize their own interests and not those of the group. Therefore, getting accurate information on U i becomes a problem. Standard bureaucratic processes ask for data on U i but the distortions created by incentive compatibility constraints may actually lead the processes to choose allocations with ~~.iUi(xi ) significantly less than the maximum possible. Setting up markets is an alternative often mentioned. One way to do this would be to organize a market for each x ~ X, with a price p ( x ) ~ R, so that i would pay fx, P ( x ) d x for the set X r For problems like ours, if a market equilibrium exists, the prices would support the solution. That is, for all i and all X[, U i( X o) _ fx, ~P( x )d x _> U i(X~) - fx~ P( x ) d x where X/~ is the optimal allocation. However,if the demands for the items are highly complementary or if serious non-convexities exist, then a simple set of markets (one for each resource) is unlikely to solve the problem (see Koopmans and Beckman, 1957). In order to discover and support optimal allocations, the price adjustment process requires information about the complementarity of demands and about the extent of non-convexities (see Calsamiglia, 1977; Hurwicz, 1994; Jordan, 1987; Saari and Simon, 1978). In extreme cases one might require price information for all subsets of X, rather than only of x (see Papal, 1994). When bureaucratic processes and simple markets will not work very well, some success has been realized using a special type of ascending bid auction. These auction mechanisms are relatively easy to understand and achieve fairly high efficiencies. They are called AUSM (Adaptive User Selection Mechanisms). The basic components of AUSM include: (i) a bid, (A ~k, bi), where A t c__X and b ~ R, read as i bids b i to receive A ik, and (ii) a provisional allocation, (X 0, X I . . . . . Xn), where X~ is composed of provisionally accepted bids and X~ = U k A~k, the union of all x, which i receives in the provisional allocation. The ascending bid nature of the mechanism comes from the rule which determines whether any new bid is to be included in the provisional allocation and which bids are then to be removed. This revision rule is simple: (A g*, b i*) is accepted if bi*> ~ / ~ z b / k where z = {fk] A/~ ('1 A i* :~ Q}. That is i must agree to pay at least as much as those who will be displaced if i's bid is accepted. With this rule, the sum of the accepted bids Y'./kb/k is always increasing. The continuous version of AUSM allows bids to be submitted at any time with a rule that specifies when bidding stops. This form of the process is computationally simple but it does leave open the possibility that users who only want small subsets may have difficulty displacing users who have successfully bid for a large subset. This problem has been addressed by adding a standby queue, described in Banks et al. (1989) and below in Section 4.2. The queue appears to work reasonably well but it is possible that another design would be better. That remains an open question.
J.O. Ledyardet al./ EconomicDesign 2 (1996)163-192
169
To summarize, the generic problem facing the mechanism designer for a given environment X is to find a process which produces allocations (partitions) with high values of EiUi(xi). For our DSN problem, X is a collection of heterogeneous items called slots numbered j = 1. . . . . J which can be occupied by one and only one user. This is a one to many assignment problem. The relevant optimization problem for DSN is described in Section 4.3. We now turn to that specific example of a shared resource problem.
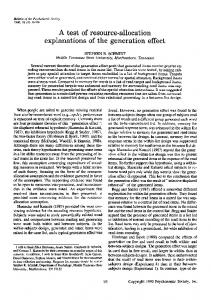
4. Our laboratory environment 4.1. Supply The commodities to be allocated are called slots. Each slot is completely specified by a resource and a time. Let S denote the set of slots and s,~ t ~ S denote the slot on resource m, at time t. There are M resources and T times, where m = (1 . . . . . M ) and t = (1 . . . . . T). The slots can be represented by an M• matrix as in Fig. 1. Let Pj denote package j, where P j c S and let j = 1. . . . . J where J = 2 M r - 1. Any collection of slots can be considered a package. In the experimental testbed we developed, M = 2 and T = 10 so that there are 20 slots to be allocated and 2 20 - 1 possible packages. This is shown in Fig. 1.
4.2. Demand All subjects in the experiments are demanders. There are I demanders, denoted by i = (1 . . . . . I), each of whom has a private valuation for each package. Let V~j denote demander i's valuation for package j. The valuation indicates the monetary value demander i will receive if i obtains all of the slots in the package. V,.j is given in terms of an experimental currency, which is called 'francs'. At the end of each experimental session, subjects are paid an amount of U.S. dollars proportional to the total amount of francs they earn by obtaining packages of slots. In this
Time
Resources
1
2
3
4
5
6
7
8
9
a
b Fig. 1. Commodityto be allocated (20 slots).
10
170
z o. Ledyard et al./Economic Design 2 (1996) 163-192
way, valuations are induced, so that subjects have a monetary incentive to 5 maximize the total number of francs they earn. In choosing a set of demanders' types, or utility functions, we tried to capture the general qualities of the requirements of the DSN users, while keeping the types simple and the number of types small. We decided on the following four generic types of demand structures. 1. Contiguous. A contiguous demander values packages that are composed of slots at adjacent times on the same resource. Often, users of the DSN require long periods of continuous coverage during important phases of their mission; for example, when mapping a planet or repairing an antenna. In the experiment, contiguous demanders must obtain the same resource for at least two times in a row to receive any value. Thus, values for contiguous packages are superadditive. 2. Periodic. A periodic demander values packages that are composed of times separated by a fixed interval on the same resource. Some users of the D S N require contact with their spacecraft at regular time intervals. For example, Pioneer 10 must be contacted at least once every 36 hours to readjust its communications equipment in order to guarantee future contact. In our experimental design, periodic demanders need to use slots on the same resource spaced at five time slots apart or otherwise their value is zero. This is an example of nonconvexity in the demand structure. 3. Array. An array demander values packages that are composed of slots at the same time on multiple resources. Often, it may be desirable to point two antennae in the same direction in order to increase the data return rate. An example of this occurs during an encounter when all instruments want to be sending data using the 70 meter antenna and the 34 meter antennas at the same location simultaneously allow for a higher data transmission rate with lower error (data loss) rates. In our design, array demanders require two resources at the same time. 4. Maintenance. A maintenance demander values as many single slot packages on resources as he can acquire. This is a representation of the preferences of the DSN maintenance staff who are largely indifferent about the time the antenna is shut down for maintenance.
One feature of the information structure in the DSN environment is the common knowledge of the times of day at each location which can be of use to demanders (all users know when each project is on the same side of the earth as a particular antenna complex). These times are referred to as a spacecraft viewperiod. In the experiments, each demander was assigned one of two possible
5 See Smith (1976) for more on the theory of induced valuation.
J.O. Ledyard et al./ Economic Design 2 (1996) 163-192
171
viewperiods, and the number of demanders with each viewperiod was known to all subjects. Subjects possessing viewperiods 1 and 2 had a zero valuation for any slot in times (columns) 1, 2, 6, or 7 (for viewperiod 1) or in times 4, 5, 9, and 10 (for viewperiod 2) respectively. In each of our experimental sessions, there were six demanders. Demanders did not know the valuations of any other demanders, but they knew that there were a total of three subjects possessing each viewperiod. They also knew the set of possible types, but not the exact valuations which demanders of the various types would have. Each demander was assigned an identification number, one of the four types discussed above and one of the two possible viewperiods. Fig. 2 relates the identification numbers, the types, and the viewperiods.
4.3. Schedule A schedule is an assignment of slots to demanders. A schedule is feasible if it satisfies
~_, ~, Xij < 1; Vm,t
(4)
i~ l j ~ Cmt
and
Xij ~ {0, 1}
(5)
where Cmt c J is the set of packages that contain slot sin, and Xij = 1 if demander i receives package j and zero otherwise. A slot can be included in at most one package that is allocated. Each package can be allocated to at most one demander. Also, a slot cannot be subdivided but must be assigned in its entirety. A schedule is efficient if it solves max ~
E V,j Xij
(6)
i~lj~J
User 1
2
3
4
5
6
Type
C
C
P
P
A
M
View period
1
1
2
I
2
Fig. 2. Users (6). C = contiguous, P = periodic, A = array, M = maintenance. Viewperiod 1 ~ 3,4,5,8,9,10; Viewperiod 2 = usable slots ~ columns 1,2,3,6,7,8.
usable slots ~ columns
172
J.O. Ledyard et al. / Economic Design 2 (1996) 163-192
subject to Eqs. (4) and (5). 6 An efficient schedule achieves the highest possible total value to demanders of any feasible schedule. Define the e f f i c i e n c y of an allocation X ~ as E =
•
* 100
(7)
where E is the efficiency and ~/ is the optimal value. 4.4. P a r a m e t e r s
Although the non-existence of market equilibrium prices for these slot allocation problems is of interest and important, that aspect has been studied in, for example, Banks et al. (1989) and Bykowsky et al. (1995). In the research reported in this paper, we were interested in finding an acceptable mechanism which was much better than the existing process. We therefore focused on environments which were reasonably well-behaved. Our experiments were conducted using two sets of parameters (valuations) which differed in their level of 'contention'. The contention level gives us an indication as to how much conflict between users is present in the system. Our measure of contention (following Olson and Porter (1994)) is E j E , ~ e, P,
7
(8)
where V is the value of the objective function evaluated at the solution to the maximization problem and p~ is the equilibrium price of slot s, as defined in Section 3. The levels of contention are 0.55 and 0.25 for our high and low contention conditions respectively. It can be verified from inspection of Tables 1-4, which contain the valuations and the prices for all packages and slots for both the High and Low contention treatments that the prices are indeed competitive equilibrium prices for the parameters used in the experiment.
5. Allocation (scheduling) mechanisms In this section we describe the general features of the three mechanisms whose performance we test in the environments of Section 3. The first mechanism we test
6 This is a form of the problemknown in integer programmingas the knapsack problem.The idea is to choose items to take in a knapsack when one goes on a trip. Each object has value, but it also has weight. The problem is to maximizethe total value of the items taken subject to the condition that the total weight is less than or equal to some constant.This type of problem is NP-complete.The efficient allocation problem is more complicated,with one constraintper slot and a number of packages (objects which could be put in the knapsack) that equals 2 M r - 1.
J.O. Ledyard et al. / Economic Design 2 (1996) 163-192
173
Table 1 Demanders' valuations: High contention condition a
i
s ~ Pj l 1 *1 "1 "2 "2 2 2 3 3 *3 3 "4 4 "4 4 4 "5 5 5 5 "6 6 6 *6 6 6 6 6 6 6 6 6
3a 3b 8a 8b 4a 4b 8a 8b 3a lb 2b 3b 2a 3a lb 2b 3b 3a 4a 8a 9a la 2a 3a 6a 7a 8a lb 2b 3b 6b 7b 8b
4a 4b 9a 9b 5a 5b 9a 9b 8a 6b 7b 8b 7a 8a 6b 7b 8b 3b 4b 8b 9b
5a 5b 10a 10b
10a 10b
5a
5b
10a
10b
Vii
pj
2450 1450 3150 2150 3200 2000 2000 1000 1600 1600 3200 1600 3000 1500 1750 1250 750 3000 3000 1500 1500 750 1000 500 750 1000 500 750 500 250 750 500 250
2900 1450 2000 1350 1800 1200 2000 1350 1600 1600 1250 1600 2000 1600 1600 1250 1600 1350 3000 1850 1500 0 1000 1100 0 1000 500 850 750 250 750 500 1350
a The asterisks mark the packages allocated at the optimum. The competitive equilibrium price of package j is given in the column labelled pj. pj is the sum of the competitive equilibrium prices of the slots comprising the package. is d e s i g n e d to c a p t u r e s o m e o f t h e b a s i c f e a t u r e s o f the c u r r e n t p r o c e s s u s e d b y J P L in t h e a l l o c a t i o n o f the D S N . It c o m b i n e s a c o m m i t t e e p r o c e s s , a d e c i s i o n s u p p o r t a l g o r i t h m , a n d a b u r e a u c r a t i c a p p e a l s process. W h i l e w e w o u l d n o t e x p e c t this m e c h a n i s m to p e r f o r m v e r y well, w e e v a l u a t e it to p r o v i d e a b e n c h m a r k a g a i n s t w h i c h to j u d g e the p e r f o r m a n c e o f o t h e r m e c h a n i s m s . I n p a r t i c u l a r , s i n c e the r e s e a r c h t a s k w a s to f i n d a b e t t e r w a y to allocate s h a r e d r e s o u r c e s like t h e D S N , w e n e e d to d e m o n s t r a t e that the n e w m e c h a n i s m s p r o p o s e d are i n d e e d p o t e n t i a l l y b e t t e r t h a n the e x i s t i n g one.
J.O. Ledyard et al. / Economic Design 2 (1996) 163-192
174
Table 2 Demanders' valuations: Low contention condition a
i
s ~ Pj
9 "1 1 2 "2 "3 3 *3 "4 4 "4 "5 5 6 "6 6 "6 6 "6 6 "6
9a 9b 9a 9b la 2a 2b 2a 3a lb 4a 9a la 3a 6a 8a lb 3b 6b 8b
10a 10b 10a 10b 6a 7a 7b 7a 8a 6b 5a 10a
4b 9b
5b 10b
Viy
pj
4000 850 1000 4000 3250 1000 2250 3250 1000 2750 3000 1000 800 1200 800 1000 800 1000 800 1000
11300 850 1000 850 1600 1000 0 1000 1000 1600 0 1850 800 1000 800 0 800 0 800 0
The asterisks mark the packages allocated at the optimum. The pj indicate the competitive equilibrium prices of the packages,
Table 3 Competitive equilibrium prices for all slots: High contention Resources
a b
Time 1
2
3
4
5
6
7
8
9
10
0 850
1000 750
1100 250
1800 1200
0 0
0 750
1000 500
500 1350
1500 0
0 0
We test two alternatives to the current process. First, we auction off the various slots using AUSM, which was originally designed for a different allocation problem by Banks et al. (1989). It is an ascending bid auction which allows bids Table 4 Competitive equilibrium prices for all slots: Low contention Resources
a b
Time I
2
3
4
5
6
7
8
9
10
800 800
1000 0
1000 0
0 0
0 0
800 800
0 0
0 0
1000 850
0 0
J.O. Ledyardet aL/ EconomicDesign 2 (1996) 163-192
175
for packages of slots as well as for individual slots. It also has a feature called a standby queue which is designed to help bidders overcome t h e 'threshold' problem common to these types of combinatoric problems. This mechanism is described in more detail below. Although the A U S M with queue generally achieves high efficiencies, it a l s o generally extracts significant surplus from the bidders. So what users have been getting inefficiently, but for free, may now be allocated efficiently but at a real monetary cost to them. The net benefit to the users, which we call users' surplus, can actually decline significantly when moving from a committee process to an auction even though efficiency improves. Proposing such a mechanism for the DSN problem is politically untenable. No mechanism which leaves current users significantly worse off will be adopted in an environment which values the users' opinions. 7 To see whether we can overcome this political constraint we test a third mechanism which we call A U S M with tokens. We use the same mechanism as above but we give all users an allocation of tokens with which to bid. 8 Our conjecture was that while this mechanism might not achieve the same levels of efficiency that an auction with real monetary transfers would, it would still leave users better off because it would allow and provide incentives for users to identify tradeoffs but would not require them to pay additional funds.
5.1. Negotiation (committee process) In this section we represent the process currently used in the allocation 9 of DSN slots. We keep that representation in a form that can be implemented experimentally so that data on performance in a controlled setting can be acquired. The experiment is computerized, with each subject seated at his own terminal. The procedure occurs in three phases:
Phase 1: The Request Phase.
Demanders submit requests for packages of slots of the form (n, T, Q, R), where 9 n ~ { 1, 2 . . . . . 20} is the number of slots requested, 9 T ~ {contiguous, periodic, array, maintenance} is the type of request, 9 Q ~ {1, 2} is the quality of resource where a is an antenna (resource) of quality 1 and b is an antenna of quality 2, and 9 R ~ {0, 1. . . . . 9} equals the range of the slots requested (the range equals the number of the rightmost column (time) in the request minus the number of the leftmost column in the request). There is a cost to each request C(n, T, Q, R) which is decreasing in the range
7 For more on mechanism design in which political constraints are important, see Ledyard (1993). s This approach has sometimes been used in practice with some success (measured by users' satisfaction surveys). Examples include scheduling business school interviews, managing computer allocations, etc. 9 For a detailed description of the process used at JPL see Olson and Porter (1991).
J.O, Ledyard et aL/ Economic Design 2 (1996) 163-192
176
specified (flexibility) and increasing in resource quality and the number of slots requested. The function is
C(n,T,Q,R)
= (3 - Q)(15 - R ) " francs
where francs are the experimental currency. Although there are no direct costs assessed in the current procedure at DSN, there are important opportunity costs since large and inflexible requests lead to likelihood of conflict with additional committee time required and potential for appeals to upper management. The function C is intended to capture these costs. Using the requests, a two-stage algorithm creates a schedule. The algorithm we used is the actual algorithm (RALPH) used by JPL. All requests are included in the schedule. The algorithm minimizes the 'average' level of contention for the resources and maximizes the 'average' level of resource utilization. In the first stage it assigns fractions of each request made to every possible combination of slots which would satisfy the request. In the second stage the requests are consolidated so as to spread out the excess demand for slots as evenly as possible across slots. In other words, in two stages, it finds a solution to the following: min~]/max(~ Xij s~S~
~ Xij, 1}}.
(9)
~'i~lj~C~t
There are typically multiple solutions to Eq. (9). The algorithm selects the schedule based on the order in which the scheduler inputs the requests from a mission event priority guideline provided by management. Note that multiple demanders may be assigned to the same slot. Conflicts from the multiple assignments of a slot are then negotiated in a user committee.
Phase 2: The Negotiation Phase.
Once the algorithm has operated, there follows a negotiation phase. Here demanders may freely communicate and agree to drop or switch slots which they have been allocated. Although there is no direct restriction on the number of switches, all negotiations have to be completed in a predetermined time interval, which is known to all subjects. A demander's action in the negotiation phase may be either of the following: 1. A demander may agree to unilaterally give up her assignment to a slot. This may occur in the context of a binding agreement with other subjects who also agree to give up their assignments. 2. A demander may give his currently assigned slot to another demander. This could also form a part of a larger agreement with any number of other subjects. In our experiment, the experimenter manually alters the schedules for all subjects from his computer terminal to reflect the agreements concluded in the negotiation phase.
Phase 3: The Appeals Phase. When agreement cannot be reached on the allocation of the schedule even after negotiation, the contending users can appeal to higher levels of management. In the experiment, any conflicts which are still
J.O. Ledyard et al. / Economic Design 2 (1996) 163-192
177
unresolved after the negotiation phase are settled through an appeals process which reduces the number of demanders in any slot to one. We sidestep the issue of the preferences of the higher level of management by conducting the appeals process anonymously on the computer and treating all of the subjects equally during the process, To capture the idea that larger requests are more difficult to appeal, we require that a separate appeal be made for each slot, In all of our experiments the appeals process treats the appeals of all contending users equally, although this may not be the case at JPL or other organizations. During the appeals phase, subjects are required to specify for every slot, to which they and at least one other demander are assigned, whether they wish to be involved in the appeal process. There is a per slot cost to demanders who appeal, which was equal to 100 francs in the experiment, again to represent the opportunity costs involved. Each demander appealing for a slot has an equal probability of receiving the slot in the final allocation. No demander may make an appeal for a slot which is not assigned to him after Phase 2. At the end of Phase 3 an allocation is determined and subjects receive profits. Demanders' requests and appeals are unobservable to other subjects. Communication between subjects is permitted only in the negotiation phase. 5.2. Adaptive user selection mechanism (auction)
The adaptive user selection mechanism (AUSM), is a computerized ascending price auction in which demanders enter bids for packages of slots. Alt slots and all packages are auctioned continuously and simultaneously. (Also see Section 3.) A demander can enter an integer bid for any package, to Let bij > 0 denote a bid by demander i for package j. The process can be most easily understood using the concept of a standing bid. Let Si be the standing bid for package j. At any time the collection of packages for which there is a standing bid will constitute a feasible allocation. A new bid, b'ij, can become a standing bid if it is greater than the sum of all standing bids for all packages which contain slots which intersect with package j. In other words b'd is accepted and becomes a new standing bid sj when b:s >
E
Sk.
(10)
k;e~n P~*~
The previous standing bids S k, where k is as defined in Eq. (10), are then displaced and are no longer considered standing bids. Bids can not be withdrawn once they are sent to the market. An important feature of this process is that the
lo It is important that demanders need not enter bids for all of the packages. Thus, in general, bidders in AUSM submit fewer bids than the number of commodities, making AUSM less demanding than markets.
178
J.O, Ledyard et al. / Economic Design 2 (1996) 163-192
sum of all standing bids can only increase when a new bid is accepted. ~t When the auction closes, the demander in possession of the current standing bid for package j receives that package. The auction was closed manually by the experimenter at random within a time interval known to subjects, although the exact time of closing was not known to them in advance. The auction was open for 6 - 8 minutes in the early periods of each experiment and 4 - 6 minutes in the late periods. The random ending was designed to prevent a sudden surge of bidding activity at the end of the market period which would occur if the exact time of closing were known to bidders. ~2 Also, if at any time,no new bid was received for a 20 second time interval, the market was closed by the experimenter. This mechanism as it stands has an undesirable feature that may lead to inefficient outcomes, because larger users can prevent smaller but higher-valued users from winning. Suppose, for example, that demander 1 has a valuation of 3000 francs for a package consisting of items la, 2a, and 3a, demander 2 has a valuation of 2000 francs for item la, and demander 3 has a valuation of 2000 for a package consisting of items 2a and 3a. In the highest-valued allocation, demander 2 receives item la and demander 3 receive 2a and 3a. However, if demander 1 bids 2001 francs for the package of la, 2a, and 3a, then neither demander 2 nor demander 3 can unilaterally displace l ' s standing bid without bidding more than his individual value. Thus, the mechanism produces an inefficient outcome. To overcome this threshold coordination problem, a feature called Standby Queue for Unifying Individual Demanders (SQUID) was added to the Adaptive User Selection Mechanism. 13 This queue allows individual demanders to jointly submit bids in order to displace standing bids for large packages. A public bulletin board is provided for bidders where they can place a bid that they would be willing to have win but which is not sufficiently large to become a standing bid by itself. In the above example, a bid to pay 1300 for slot la by demander 2 would be such a bid. Once placed on the standby queue, that bid can be used by others in concert with their own bid to displace a large bid such as the bid of 2001 for the package of slots la, 2a and 3a by demander 1. In the example, once demander 2 has placed a bid in the queue, demander 3 can then choose to combine a bid of his own with demander 2's offer on the standby queue. He might then bid 702 francs for slots 2a and 3a in combination with 2's offer of 1300 for la. Since they jointly have a sufficiently high bid to displace demander l ' s bid they can do so.
11 It is, of course, possible for the standing bids of any particular package to fluctuate over time. 12 The experimenter drew closing times before the periods started using a random number generator. This allowed the experimenter to be sure that he was unaffected by the market activity during the period when deciding when to close the market. t3 Tile idea is to provide a forum for communication since experimental evidence suggests that the best way to overcome the threshold problem is to allow subjects to communicate. See Ledyard (1995) for a survey of some of these experiments.
J.O. Ledyard et aL / Economic Design 2 (1996) 163-192
179
Demander 3 can unilaterally execute the joint bid and 2's component is binding on 2 once it is executed. Prior to execution, bids can be withdrawn from the standby queue. Any number of bids could be combined to form one joint bid, with the limitation that each bidder could have at most two bids on the standby queue at any time. 5.3. A U S M with tokens
The A U S M mechanism with the standby queue was also implemented as a mechanism where bids were made, not in terms of an experimental currency convertible to U.S. dollars, but rather using tokens which had no value to demanders and which served only as a medium of exchange. Each demander received a budget of tokens at the beginning of each period with which to bid. Any tokens remaining at the end of the period had no value to the demander and were forfeited before the start of the next period. Since the initial distribution of tokens is an important aspect in the design of any bidding mechanism which uses tokens, we included two subconditions in the research design, which differed only in the amount of tokens with which subjects were endowed at the beginning of each period. In the Equal Endowment condition, each subject received an equal endowment of tokens each period. In the Competitive Endowment condition, the endowment of tokens available to each subject was proportional to the minimum number of francs required by each subject to achieve the competitive equilibrium allocation. 14 In each of the four experimental sessions of A U S M / t o k e n s , each endowment was used for at least three market periods. Subjects were always informed if the endowments were going to change in the next period. Subjects knew their own endowment but not the endowment of other demanders. Subjects also knew that there were only two possible initial distributions. The initial allocations of tokens to subjects are given in Table 5. Although some of the demanders in the Competitive Endowment condition (demander 5 in low contention and demander 6 in high contention) received endowments much lower than other demanders, they were nevertheless usually able to purchase units, since there existed packages for which only they had a positive valuation. 5.4. Sequential random efficiency
One metric by which to evaluate the performance of a mechanism in a particular environment is to compare the efficiency achieved to that generated by a
t4 If the minimum was less than 5 francs, the endowmentgiven was raised to 5 francs. We recognize that in practice, the planner is unlikely to know the competitive equilibrium price vector, if indeed such a price vector exists. The Competitive Endowment treatment as used here should be viewed as a benchmark employed merely as an alternative to the Equal Endowment treatment. With two different endowments, we can gage the sensitivity of the efficiency of allocations and individual payoffs to the initial endowment of tokens.
J.O. Ledyard et al. / Economic Design 2 (1996) 163-192
180
Table 5 Initial endowment of tokens Low contention
Demander
1
2
3
4
5
6
Equal endowment Comp. endowment
1000 1000
1000 850
1000 1600
1000 1800
1000 5
1000 1000
Equal endowment Comp. endowment
High contention 1000 1000 1825 1500
1000 625
1000 1800
1000 675
1000 5
naive computer algorithm. This protects against claims of superior performance by a mechanism when it is really only an 'easy' environment which allows high efficiencies. The algorithm we have chosen is a generalization of the sequential dictator algorithm analyzed in Olson and Porter (1994). The algorithm consists of the following steps. 1. Pick a user. Each user is picked with equal probability. 2. Allocate to that user his most valuable package which is feasible. A package is feasible if no subset of it has been allocated to any other demander. 3. Go to I. if there exist slots which have not been allocated. 4. Compute F.iF~jVijXij for that allocation, divide by ~r The algorithm was run 10000 times for each set of parameters. The results of the first 2500 runs are depicted in Figs. 3 and 4. The algorithm generates an average efficiency of 0.8979 and 0.8261 for the low and high contention condi1000
9~
800
7O0
60O
40O 300
200
100
0 -
E:.6-.65
E: 65-.7
E:.7-.75
E:.75-.8
E:.8-.85
E:.85-.9
E:.9-.95
E:.95-.99
Efficiency
Fig. 3. Distribution of efficiency of random algorithm: 2500 trials - low contention.
E:I
181
J.O. Ledyard et al./ Economic Design 2 (1996) 163-192 700
|
600
500
400
o u. 300
200
100
.6-.65
,65-.7
3-.75
.75-.8
.8-.85
.85-.9
.9-.95
.95-.99
Efficiency
Fig. 4. Distribution of efficiencyof random algorithm: 2500 trials - high contention.
tions respectively, with standard deviations of 0.0902 and 0.0876. The algorithm results in the optimal allocation 28.94 and 2.25 percent of the time in the low and high contention conditions, respectively. 15
6. Results All of the 12 experiments were conducted in April 1993 at the Laboratory for Experimental Economics and Political Science at the California Institute of Technology. Each experiment consisted of between 8 and 12 market periods. All subjects were undergraduates or pre-freshmen at the Institute. In Table 6, we display some design information conceming the experiments: In the rows corresponding to A U S M / t o k e n s in the column labelled Num. periods, the two numbers in parentheses represent the number of periods in the session where the Equal and the Competitive endowment conditions respectively were in effect. 16
15The algorithm generates, on average, higher efficiencies under low contention for our parameters, although, in general, higher contention does not always imply lower average efficiency. 16The instructions used in the experiments can be found Ledyard et al. (1994).
182
J.O. Ledyard et a l . / Economic Design 2 (1996) 163-192
6.1. The data Our analysis of the effects on allocative efficiency and the cost to users of varying the level of contention and of replication of the market conditions is based on the estimation of regression equations. The following equations were estimated using the data from the committee and the A U S M / m o n e y processes:
yi=/3o+fllperiod+fl2hicon+~,
i = 1,2,
(11)
where Yl = efficiency (as defined in Eq. (7)) and Y2 = cost to users. Users' surplus can then be computed as YI - Y2. The cost to users is the percentage of paid out by subjects during the market period. In the committee process it is equal to the request costs plus the appeals costs. For the A U S M / m o n e y the cost to users is equal to the amount of cash paid out by subjects to obtain their allocation. There are no costs to subjects in the AUSM/tokens. The variable 'period' is equal to the number of market periods that have elapsed in the experimental session including the current period. It can be interpreted as a variable which isolates the effect of the learning or experience of subjects on the value of the dependent variable. The dummy variable 'hicon' takes on a value of 1 in the high contention treatments and a value of 0 in the low contention treatments and therefore identifies the effect of variations in the contention level. The following equation was estimated for the AUSM/tokens data: e =/30 + fll period +/32hicon +/33compendow,
(12)
where e = efficiency and compendow = 1 if the Competitive Endowment condition is in effect and equals 0 otherwise. For the AUSM/tokens data, since all rents go to the demanders, market efficiency is exactly equal to users' surplus. The
Table 6 Information about experimental sessions Exp. number.
Mechanism
H / L contention
1 2 3 4 5 6 7 8 9 10 tI 12
Committee Committee AUSM AUSM AUSM/tokens AUSM/tokens Committee Committee AUSM AUSM AUSM/tokens AUSM/tokens
H H H H H H L L L L L L
Num. periods 10 9 9 I1 8 (3/5) 11 (8/3) 8 10 10 10 9 (6/3) 12 (7/5)
J.O. Ledyard et al. / Economic Design 2 (1996) 163-192
183
Table 7 AUocative efficiency and cost to users of the three mechanisms(in percent) a Dependentvariable
One
Period
Hicon
Compendow Re
Efficiency - committee
80.434 (3.038)
1.546 - 19.100 (0.515) (2.520)
0.65
37
Efficiency - AUSM/Money
85.916 (3.398)
1.324 (0.486)
0.20
40
Efficiency - AUSM/Tokens
80.317 (5.815)
1.035 (0.636)
6.216 0.400 ( 3 . 3 2 8 ) (2.63)
0.14
40
User cost - committee
6.23 (1.36)
- 0.702 (0.255)
5.94 (1.30)
0.44
37
User Cost - AUSM/Money
16.20 (4.45)
1.54 (0.731)
21.10 (3.65)
0.55
40
- 3.096 (2.634)
n
a Standard errors in parentheses. variable 'compendow' identifies the effect on efficiency of varying the initial endowment of tokens. The results of the estimations of the five equations are given in Table 7. The standard errors of the estimates are given in parentheses. Tables 8 - 1 0 contain the estimated efficiency and the estimated cost to users of each of the three allocation mechanisms in periods 1 and 10, as well as under the two contention levels. The numbers in Tables 8 - 1 0 are taken from the estimated coefficients in Table 7. L and H represent the Low and High contention treatments respectively. L1 and L10 denote the estimated value of the relevant variable in periods 1 and 10 respectively in the low contention condition. The estimates in Tables 8 - 1 0 are the values of the regression in the relevant period and treatment, and not the actual observed values of the variables. Thus, it is possible, as in the low contention period 10 estimate of the cost in the committee process, that the estimated value could be negative although the actual costs must always be greater than or equal to zero. The figures in parentheses give the probability that the efficiency or the users' surplus from the sequential dictator algorithm is less than or equal to the estimated surplus from the mechanism. So low numbers in
Table 8 Efficiency and user surplus: Committeeprocess (in percent) L1
L10
HI
H10
Effic.
81.98 (16.44)
95.89 (71.06)
62.88 ( 1.21)
76.79 (25.77)
Cost
5.53
- 0.79
11.47
5.15
76.45 (11.84)
96.68 (71.06)
51.41 (0)
71.64 (10.1)
Users' surplus
184
J.O. Ledyard et al./ Economic Design 2 (1996) 163-192
Table 9 Efficiency and user surplus: AUSM/Money (in percent) LI LI0
H1
HI0
Effic.
87.24 (26.54)
99.16 (71.06)
84.14 (54.75)
96.06 (95.09)
Cost
17.74
31.60
38.84
52.70
Users' surplus
69.50 (1.81)
67.56 (1.47)
45.30 (0)
43.36 (0)
parentheses indicate poor performance by the mechanism relative to the sequential dictator (random) algorithm. The efficiency generated by the committee process at the beginning of the experimental sessions is less than that generated by the random algorithm in both the high and the low contention environments. In the low contention condition, however, the efficiency of the committee process improves over time so that, on average, it is better than the random algorithm by period 10. However, in the high contention environment, the committee performs very poorly and, even by period 10, does not achieve efficiencies as high as the random algorithm. The costs to users in the committee process decline with time as users apparently learn to avoid these bureaucratic frictions. Higher contention makes such avoidance more difficult. The most remarkable finding is that only in a low contention environment and only after a number of replications does the current committee process, with a decision support algorithm, outperform the simple sequential dictator algorithm. From an efficiency point of view, A U S M / m o n e y performs better than the committee in both the high and the low contention conditions. The efficiency is also increasing over time. By the tenth period, AUSM significantly outperforms both the committee process and the sequential dictator algorithm. However, increases in efficiency are associated with increasing costs to the users so that user surplus remains unchanged. In fact, users' surplus is substantially less under A U S M than under the committee process or under the random algorithm described in Section 5.4. Table 10 Efficiency and user surplus: AUSM/tokens/the Equal Endowment Condition (in percent) L1 LIO H1 HIO Effic. Cost Users' surplus
81.35 (16.44) 0 81.35 (16.44)
90.67 (57.25) 0 90.67 (57.25)
87.56 (72.71) 0 87.56 (72.71)
96.88 (95,09) 0 96,88 (95,09)
J.O. Ledyard et al. / Economic Design 2 (1996) 163-192
185
Under the AUSM/tokens, efficiency and, thus, users' surplus increases over time. The efficiency is higher under high than under low contention. Under high contention, the users' surplus was largest under the AUSM/tokens mechanism than any of the three others. Furthermore, as can be seen in Table 7, changing the token endowment had no effect on the efficiency levels recorded. This is somewhat unexpected so it is reasonable to consider further the distributional effects of the different token endowments. A natural measure of this effect is the sample variance of payoffs among the users which can be defined as
s 2= E i=l
(13)
I-1
where, S 2 is the sample variance, 7r; is the profit of demander i, which equals the sum of his valuations (in terms of francs) for the packages he receives and ~" is the average profit of demanders. The variance is analysed by estimating the equation below. The estimates are reported in Table 11. (14)
S 2 =/3 o +/31period +/32hicon +/33compendow.
One can see in Table 11 that the change in endowment also has no significant effect on the variance of the payoffs. The fact that the variances are not different, however, does not suggest that there were no distributional differences under the two endowments. For example, under low contention, demanders 3 and 4 were substantially worse off (payoffs were 15 and 19 percent lower respectively), while demander 6 was better off (by 19 percent) in the Equal Endowment condition than in the Competitive Endowment condition. Under high contention, demander 4 received considerably higher payoffs (by 30 percent) in the Competitive Endowment condition while demander 6 received considerably lower payoffs (by 37 percent). Tables 12 and 13 show the percentage of market periods in both subconditions in which each demander received each of the packages which had value to him. The columns labelled EE and CE indicate the percentage of the time that package Pj was allocated to demander i under the Equal Endowment and Competitive Endowment treatments respectively.
Table 11 The effect of the two endowmentson the variance of payoffsacross subjects a Variable Coefficient Std. error t-stat one per hicon compendow a R2=0.08, n=40.
3404260 - 167333 712256 275415
788676 112328 600223 648072
4.316 - 1.490 1.187 0.425
186
J.O. Ledyard et al. / Economic Design 2 (1996) 163-192
Table 12 Allocated packages under AUSM/tokens under both endowments: High contention condition i
s ~ Pj
V/j
E.E. a
C.E. b
1 1
3a 3b
4a 4b
5a 5b
2450 1450
0 0
0 0
*1 *1 ~ ~ 2 2 3 3 '3 3 "4 4 '4 4 4 "5 5 5 5 "6 6 6 "6 6 6 6 6 6 6 6 6
8a 8b 4a 4b 8a 8b 3a lb 2b 3b 2a 3a lb 2b 3b 3a 4a 8a 9a la 2a 3a 6a 7a 8a lb 2b 3b 6b 7b 8b
9a 9b 5a 5b 9a 9b 8a 6b 7b 8b 7a 8a 6b 7b 8b 3b 4b 8b 9b
10a 10b
3150 2150 3200 2000 2000 1000 1600 1600 3200 1600 3000 1500 1750 1250 750 3000 3000 1500 1500 750 1000 500 750 1000 500 750 500 250 750 500 250
100 91 91 91 0 9 0 9 64 0 82 0 55 27 0 100 9 0 0 100 18 0 100 18 0 36 9 0 36 9 0
100 100 1130 100 0 0 0 25 50 0 100 0 75 50 0 100 0 0 0 100 0 0 100 0 0 0 0 0 0 0 0
10a 10b
5a
5b
10a
10b
a E.E. = % of periods in which this package was received in the Equal Endowment treatment. b C.E. = % of periods in which this package was received in the Competitive Endowment treatment.
U n d e r b o t h e n d o w m e n t s and b o t h levels o f c o n t e n t i o n , e a c h p a c k a g e e x c e p t for p a c k a g e ( l b , 6b) u n d e r low c o n t e n t i o n in the Equal E n d o w m e n t c o n d i t i o n , w a s a l l o c a t e d e f f i c i e n t l y (that is to the c o r r e c t d e m a n d e r ) at least 50 p e r c e n t o f the time. This s u g g e s t s that e f f i c i e n c i e s u n d e r b o t h e n d o w m e n t s are h i g h and n o t m u c h d i f f e r e n t f r o m each other. U n d e r b o t h sets o f e n d o w m e n t s o f t o k e n s , the d e m a n d e r s w i t h the h i g h e s t v a l u a t i o n s w e r e g e n e r a l l y able to bid h i g h e n o u g h to p r i c e out c o m p e t i n g d e m a n d e r s . E v e n the very small e n d o w m e n t s o f d e m a n d e r 5
187
J.O. Ledyard et al./ Economic Design 2 (1996) 163-192
Table 13 Allocated packages under AUSM/tokens under both endowments:Low contentioncondition i
s ~ Pj
"1 1 2 *2 "3 3 "3 "4 4 "4 *5 5 6 "6 6 "6 6
9a 9b 9a 9b la 2a 2b 2a 3a lb 4a 9a la 3a 6a 8a lb 3b 6b 8b
*6
6 "6
10a 10b 10a 10b 6a 7a 7b 7a 8a 6b 5a 10a
4b 9b
5b 10b
Vij
E.E. a
C.E. b
4000 850 1000 4000 3250 1000 2250 3250 1000 2750 3000 1000 800 1200 800 1000 800 1000 800 1000
85 8 8 85 85 23 100 77 15 38 100 8 15 85 15 85 62 100 62 100
88 25 12 75 100 12 100 88 25 50 100 0 37 75 0 75 50 100 50 100
a E.E. = % of periods in which this package was received in the Equal Endowmenttreatment. b C.E. = % of periods in which this package was received in the CompetitiveEndowmenttreatment.
under low contention and demander 6 under high contention were enough to allow the user to purchase the packages which they would receive in the competitive equilibrium, because there were no competing demanders for these packages. Under high contention, demanders 1, 2 and 5, who were in the same viewperiod, usually received the same allocations across the two endowments. Demanders 3 and 4, who were in the same viewperiod as demander 6, sometimes purchased packages meant for each other. Demander 4 had a much larger endowment of tokens in the Competitive Endowment condition than demander 3 who in turn had a much larger endowment than demander 6. Not surprisingly, demander 4 received packages ( l b , 6b), (2a,7a) and (2b,7b) more often in the Competitive Endowment condition when he had a larger endowment. The maintenance demander 6 received the same packages less often when she had the smaller endowment. Demander 3 was able to purchase (lb, 6b) more often in the Competitive Endowment condition, easily outbidding demander 6, who was never able to purchase ( l b , 6 b ) in the Competitive Endowment condition but was able to purchase it 36 percent of the time in the Equal Endowment condition. The average allocative efficiency under the two endowments was 0.937 and 0.953 for the Equal and Competitive endowments respectively. A similar pattern occurred under low contention. The contiguous demanders 1
188
J.o. Ledyard et al. / Economic Design 2 (1996) 163-192
and 2 usually divided packages (9a, 10a) and (9b, 10b) between them. Demanders 3 and 4 often received packages intended for the other, with 4 receiving more packages under the Competitive Endowment condition, when his token endowment was greater, usually at the expense of demander 6. Demander 5, with his very low endowment in the Competitive treatment, was able to obtain his most preferred package, but his budget was too low to obtain the other package. Demander 6 was substantially worse off in the Competitive Endowment condition since she was less able to compete in the bidding with demanders 3 and 4. Demander 3 was sometimes able to get the package consisting of (la,6a) and demander 4 received (3a, 8a) and (lb, 6b) more often. Efficiency was on average 0.87 and 0.902 in the Equal and Competitive Endowment treatments respectively. 7. Discussion
The effect of the different treatments on efficiency and user surplus is illustrated in Fig. 5. Under low contention, the Committee process provides more surplus to users as a whole than the AUSM/tokens which in turn provides more users' surplus than AUSM/money. This is consistent with the field observation that there is often little effort to replace committees with market-type systems of allocation when conflict between users is not too severe even though efficiency may be low. The committee process gives users more surplus than the two other mechanisms even though it does no better than the sequential dictator algorithm. Under high contention, however, AUSM/tokens yields the highest surplus to the users, followed in order by the sequential dictator algorithm, the committee and 1 e. C&e AK/H
0.9
0.8
t~ 0.7
0.6
0,5
0.4 0.75
0.8
0.85
0.9
0.95
Efficiency C=Committee, A = AUSM, T = T o k e n s , L = L o w C o n t e n t i o n , H = H i g h C o n t e n t i o n , R a n d = R a n d o m
Fig. 5. Efficiencyand user surplus: All treatments - period 10.
J.O. Ledyard et al. / Economic Design 2 (1996) 163-192
189
AUSM//money. The committee clearly fails when the level of contention increases since the cost of negotiation and conflict resolution increases and the ability of the mechanism to allocate the schedule efficiently diminishes. AUSM//tokens behaves in the opposite way. The user surplus is higher when contention is high, since the efficiency is higher and user costs are zero. Under both high and low contention, the A U S M / m o n e y , with its extraction of rents from the users, generates lower users' surplus than the other mechanisms. When highly efficient auctions such as AUSM are proposed by economists to solve allocation problems, we should expect such recommendations to encounter resistance from thoughtful future bidders in the auction. The relatively strong performance of the sequential dictator algorithm is not surprising. The sequential dictator algorithm has aspects which give it a good chance to enhance efficiency. One is the fact that it sidesteps the information revelation problem, by choosing for each subject his most preferred package. 17 Our implementation thus assumed perfect information but the resulting allocations were compared against those generated by the interaction of strategic agents in an incomplete information environment. The efficiency of the sequential dictator as we have measured it should therefore only be treated as a benchmark and this paper should not be considered a test of its performance as a mechanism. From the standpoint of system efficiency, some of the mechanisms are superior to others. Under low contention, A U S M / m o n e y , the committee and the sequential dictator algorithm perform better than AUSM/tokens. Under high contention A U S M / m o n e y and AUSM/tokens generate more efficient allocations than the random algorithm, which in turn had more efficient outcomes than the committee. This reinforces the findings of Banks et al. (1989) that the AUSM is capable of generating very high altocative efficiencies. There is evidence of improvement over time in the level of efficiency in all three of the mechanisms. The estimated efficiency level is higher in period ten than in period one in all six conditions. Cost declined in the committee as users seemed to learn to avoid conflicts over time. In A U S M / m o n e y , the revenue extracted from the users increased with replication of the auction, and rising revenue seemed to be related to increasing efficiency. Although varying the distribution of tokens in AUSM/tokens had no effect on total payoffs or on the variance of payoffs for the particular parameters of our experiment, the distributions of payoffs across subjects was different, as demanders with lower endowments received lower payoffs. The robustness of this market efficiency finding should be interpreted with caution and does not suggest that the
17In the one-to-one assignmentproblem, such honest revelation is a dominant strategy. (See Olson, 1991; Olson and Porter, 1994.)This is no longer true in this fundamentallymore complexmany to one environment.
190
J.O. Ledyard et al. / Economic Design 2 (1996) 163-192
initial distribution of tokens can be ignored by planners in field applications. The result does suggest, however, that there is some room for flexibility in varying the initial distribution of tokens, without causing large fluctuations in a/locative efficiency.
8. W h a t h a v e we learned?
At the beginning of this paper we presented a stylized story to illustrate why user committees might be able to survive as organizational devices to manage shared facilities even though it is widely recognized by both the users and the organization that significant value is being foregone. Our study provides new evidence supporting the foundations of this pessimistic view. However, our study, using the methodology of applied mechanism design, also establishes that there are viable alternatives to user committees that do not involve large losses in value to the users. This provides some evidence that significant increases in value, for both users and the organization, can be found and captured by using designed mechanisms to improve the management of shared facilities. The basis for these somewhat sweeping statements can be found in three key findings of our study. We split the first finding focusing on the performance of user committees into two parts. (la) Experienced user committees using decision support algorithms produce reasonably efficient allocations in lower conflict situations. The key facts supporting this observation are found in Table 8. By period l0 in the low contention environment, the user committees are achieving, on average, 96% of the maximum value with virtually no cost to the users. The probability that the user committee yields a higher value than the random algorithm is, however, only 71%, which is not good but is good enough to support the continued use of the committee. (lb) Experienced user committees using decision support algorithms produce reasonably bad allocations in high conflict situations. The key facts supporting this observation are also found in Table 8. By period 10 in the high contention environment the user committees are achieving on average, 77% of the maximum value with a cost to users of 5% of the maximum value. The basis for describing this performance as bad is that the probability that the user committee yields a higher value than the random algorithm is only 10% in the high contention environment. There is obviously significant value being foregone. The second key finding concerns the viability of an 'economic' solution for the recovery of the value foregone. We also split this into two parts. (2a) There is an economic process, called the Adaptive User Selection Mechanism (AUSM), in which users bid and pay dollars for time, which yields high efficiencies in high-conflict situations. The key facts supporting this observation are found in Table 9. In the very first period and in the high contention environment, A U S M / M o n e y is achieving 86% of the maximum possible value. By period 10 in
J.O. Ledyard et al. / Economic Design 2 (1996) 163-192
191
the high contention environment it is achieving, on average, 96% of the maximum possible value. The basis for calling this high is that the probability that the random algorithm would do better is only 5%. There is obviously significant value being created by this economic solution - about a 25% increase in value over the user committee and, using a better measure of improvement, a 365% increase in the probability of beating the random algorithm. (2b) Because of the prices paid, the economic solution of AUSM / Money leaves users significantly worse off than user committees do. The key facts supporting this observation are found in Tables 8 and 9. Looking at period 10 in the high contention environment, we see that the user committee leaves a users' surplus of 72% whereas, because of the payment of fees, AUSM leaves the users a surplus of only 43%. Neither is particularly desirable, since it is essentially a sure thing (almost a 100% probability) that the random algorithm would yield a higher surplus than AUSM. There should remain little mystery as to why user committees don't like market solutions especially in those high contention situations where they are most often espoused. The third key finding concerns the existence of better mechanisms for both the users and the organization. (3) There is a modification of AUSM in which tokens, or internal money, replace real money and which results in highly efficient allocations without extracting any of the users' surplus. The key facts supporting this observation are found in Table 10. By period 10 in the high contention condition, with an equal allocation of tokens A U S M / T o k e n s is producing on average efficiency and users' surplus equal to 97% of the maximum possible. This is very high in the sense that there is only a 5% chance that the random allocation would produce a higher value. (A surprising and unexplained fact is that this is as high a gross value on average as A U S M / M o n e y achieves.) We conclude with several policy thoughts. From the point of view of a planner interested in achieving a high aUocative efficiency, AUSM is clearly the best of the mechanisms considered here. The efficiencies generated by AUSM are, in our view, very high considering the complex structure of the environment. We are doubtful that other mechanisms could do better although it surely remains an open research challenge to find a better one. From the point of view overall users' surplus, mechanisms can be found which surpass A U S M / m o n e y . When contention is low, it seems to be difficult to improve upon the current committee process. None of our alternative mechanisms were able to. This may be why extensive conflict is necessary before users are willing to discard committee systems. When contention is high we find that A U S M / T o k e n s generates very high surpluses for the users. The tokens seem to provide enough information to coordinate the allocation of slots efficiently, yet the buyers do not have to give up any surplus. This effect was surprisingly robust to changes in the initial endowment of tokens.When conflict is high, it will be revealed in complaints about the current committee/negotiation process. Under these circumstances, using a carefully designed auction with tokens may appeal to the users in a way that an auction using real money would not.
192
J. O. Ledyard et aL / Economic Design 2 (1996) 163-192
Acknowledgements An earlier version of this paper was presented at the Amsterdam Workshop for Experimental Economics in September 1993 (AWEE'93). The authors thank the Implementation Development Office of the Jet Propulsion Laboratory of NASA for their financial support. We also thank an anonymous referee and participants in the theory workshops at Purdue University, and Indiana University Purdue University at Indianapolis (IUPUI) for helpful comments. We are grateful to Bob Sandy for his detailed comments and suggestions.
References Banks, J., J. Ledyard and D. Porter, 1989, Allocating uncertain and unresponsive resources: An experimental approach, RAND Journal of Economics 20, 1-25. Bykowsky, M., R. Cull and J. Ledyard, 1995, Mutually destructive bidding: The FCC auction design problem, Social science working paper no. 916 (California Institute of Technology, Pasadena, CA) Calsamiglia, X., 1977, Decentralized resource allocation and increasing returns, Journal of Economic Theory 14, 263-283. Grether, D., R.M. Isaac and C. Plott, 1981, The allocation of landing rights by unanimity among competitors, American Economic Review, Proceedings, 71, 166-17 I. Hurwicz, L., 1994, Economic design, adjustment processes, mechanisms, and institutions, Economic Design 1, 1-14. Jordan, J., 1987, The informational requirements of local stability in decentralized allocation mechanisms, In: T. Groves, R. Radner and S. Reiter, eds., Information, incentives and economic mechanisms (University of Minnesota Press, Minneapolis, MN) Ch. 5. Koopmans, T. and M. Beckman, 1957, Assignment problems and the location of economic activities, Econometrica 25, 53-76. Ledyard, J., 1993, The design of coordination mechanisms and organizational computing, Journal of Organizational Computing 3, 121-134. Ledyard, J., 1995, Public goods: A survey of experimental research, In: A. Roth and J. Kagel, eds., Handbook of experimental economics (Princeton University Press, Princeton, NJ). Ledyard, J., C. Noussair and D. Porter, 1994, The allocation of a shared resource within an organization, Working paper 1063 (Krannert School of Management, Purdue University, West Lafayette, IN). Olson, M., 1991, Dominant and Nash strategy mechanisms for the assignment problem, Social science working paper no. 770 (California Institute of Technology, Pasadena, CA). Olson, M. and D. Porter, 1991, A deep space resource allocation primer, Mimeo. (California Institute of Technology, Pasadena, CA). Olson, M. and D. Porter, 1994, An experimental examination into the design of decentralized methods to solve the assignment problem with and without money, Economic Theory 4, 11-40. Papai, S., 1994, Assignment by design, Mimeo. (California Institute of Technology, Pasadena, CA). Riker, W. and I. Sened, 1991, A political theory of the origin of property rights: Airport slots, American Journal of Political Science 35, 951-969. Saari, D. and C. Simon, 1978, Effective price mechanisms, Econometrica 46, 1097-1125. Smith, V., 1976, Experimental economics: Induced value theory, American Economic Review 66, 274-279.