Department of Geological Sciences, Ohio University, 316 Clippinger ... ABSTRACTâMapping geographic ranges of species and higher taxa using Geographic Information Systems ..... research was supported by a NSF graduate student.
STIGALL RODE – GIS AND RANGE RECONSTRUCTION
THE APPLICATION OF GEOGRAPHIC INFORMATION SYSTEMS TO PALEOBIOGEOGRAPHY: IMPLICATIONS FOR THE STUDY OF INVASIONS AND MASS EXTINCTIONS ALYCIA L. STIGALL RODE Department of Geological Sciences, Ohio University, 316 Clippinger Laboratories, Athens, Ohio, 45701 USA
ABSTRACT—Mapping geographic ranges of species and higher taxa using Geographic Information Systems (GIS) produces quantitative data on spatial and temporal changes in geographic ranges. The primary advantage of GIS analysis is that it has the capacity to utilize large amounts of occurrence data of species to produce quantitatively constrained geographic range reconstructions that are amenable to statistical analysis. The basic steps in GIS range reconstruction are database assembly (including taxonomic, geographic, and stratigraphic information for each specimen), mapping of localities of species on modern continental configuration, rotation of occurrence data of species onto paleocontinental reconstructions, and reconstructions of geographic ranges. GIS analysis of ranges of species has been used to assess faunal dynamics of the Late Devonian Biodiversity Crisis, and three case studies are presented here. In these case studies, GIS-derived ranges of species are used to assess the relationship of biogeography with sea level, speciation and extinction rates, mass extinction survival, speciation mode, and invasive history of taxa. These case studies represent a subset of the potential for GIS analyses to examine paleontological patterns and contribute to improving understanding of the interaction between paleobiogeography, paleoecology, and evolution in the fossil record.
GEOGRAPHIC RANGE is intimately related to the biology of a species and its interaction with its environment. Quantifying changes in ranges of species during key bioevents in the history of life can provide insight into faunal dynamics of critical periods in Earth history. Geographic Information System (GIS) methods allow geographic change to be correlated with environmental and evolutionary changes and provide a powerful tool for assessing underlying causes of biotic turnover during intervals of mass extinction. Quantifying changes in geographic range and determining the factors driving geographic range expansion and contraction are crucial in examining the ecological and evolutionary history of both individual species and monophyletic clades (Enserink, 1999; Engler et al., 2004; Gurevitch and Padilla, 2004; Wilson et al., 2004). The importance of preserving geographic ranges of modern species is echoed throughout the modern biological conservation literature (e.g., Peterson and Vieglas, 2001; Johnson et al., 2004; Rushton et al., 2004; Thomas et al., 2004; Wilson et al., 2004).
The fossil record contains a rich history of shifting geographic ranges of species in the ancient past (Lieberman, 2003). Quantifying the geographic ranges of species in the fossil record is currently an underdeveloped yet promising area of study. Paleobiogeographic studies have typically examined shifts in geographic range over large time scales (stages or periods), mainly of higher taxa (e.g., Boucot, 1975). Range reconstruction methods using GIS, however, provide promising new opportunities to quantify ranges of individual fossil species in addition to higher taxa across fine temporal intervals (approximating conodont zones) (Rode and Lieberman, 2004, 2005; Stigall Rode and Lieberman, in press). Pioneering work in the use of GIS in paleontology included the development of geospatial databases of occurrences of species (Graham et al., 1996; Juliusson and Graham, 1999; Graham, 2000, this volume; Fergueson et al., 2001). Recent advances in GIS work, including reconstructing the ranges of species of Paleozoic invertebrates through multiple temporal intervals (e.g., Rode and Lieberman,
77
PALEONTOLOGICAL SOCIETY PAPERS, V. 11, 2005 2000, 2004, 2005), have begun to surpass cataloging occurrences of species and produce data to test paleoecological and paleobiogeographic hypotheses.
GIS METHODS IN PALEOBIOGEOGRAPHY Advantages of GIS Methods The reconstruction of geographic ranges of taxa has historically been a key feature of biogeography. Numerous studies have examined the geographic areas occupied by higher taxa, such as families and orders, resulting in significant advances in the delineation of biogeographic realms and provinces (e.g., Boucot et al., 1969; Boucot, 1975; Oliver, 1976; Webby, 1992). Typically, these studies have examined changing geographic ranges at the temporal scale of substages or greater (e.g., Boucot, 1975). These types of analyses continue to produce crucial insight into biogeographic patterns operating at ecosystem and biosphere hierarchical scales. This level of analysis, however, lacks the resolving power to address processes operating at lower hierarchical levels, such as the community and species level. The application of GIS methods in addition to traditional biogeographic methods represents an exciting advance in paleobiogeography in its ability to quantify ranges of species. The use of GIS has many advantages over traditional mapping of ranges of species, because GIS range maps are constructed dynamically and can be designed to illustrate both temporal and spatial variability (Berry, 1995; Chou, 1997; Burrough and McDonnell, 1998). One of the most significant advantages is the ability to accurately map the ranges of species. Since species are the entities through which the macroevolutionary phenomena of speciation and extinction occur, quantification of ranges of species provides key information for assessing evolutionary patterns. Another key benefit of GIS analysis is that range reconstructions can be based on large data sets and
78
produce quantitative results. The types of occurrence data of species required for GIS analysis can be both extracted from and donated to large database projects, such as the Paleobiology Database (http://paleodb.org), which ensures further utility of this data to other researchers. Furthermore, repeatable methodologies can be utilized, and data produced are amenable to statistical analyses. The combination of these features indicates that GIS analysis of ranges of species can result in the creation of hypotheses that are testable using statistical methods based on large data sets, a fundamentally useful advance for paleobiogeography.
Outline of GIS Method Database assembly.-The primary data required to reconstruct a range of a species are the geographic location and the stratigraphic unit from which individuals of that species have been collected. GIS mapping methods, described more fully below, require only taxonomic, geographic, and temporal (stratigraphic) information for each specimen. The occurrence data of species, acquired from museum or field collections, are incorporated into a database. Although the minimal data requirement is three fields, each species’ occurrence should include the maximum amount of information available for a specimen. Since correct taxonomic identification is critical to the accurate reconstruction of ranges of species, investigators should verify museum and literature identifications personally whenever possible. Suggested data fields to include are: locality information (geo-referenced latitude and longitude, city, county, state, country), stratigraphic information (group, formation, member, bed or zone), temporal information (stage, correlative biostratigraphic zone, sequence stratigraphic unit), taxonomic information (phylum, class, order, family, genus, species), and environmental information (matrix, substrate type). Geographic range reconstruction.- Following database construction, geographic data are imported into ArcView 3.2 (ESRI, 1999) and
STIGALL RODE – GIS AND RANGE RECONSTRUCTION
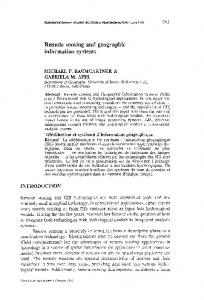
FIGURE 1—Steps in GIS range reconstruction. 1) Distribution of all data points plotted onto a modern continental configuration. 2) Reconstruction of all data points present for a single biozone. 3) Reconstruction of the geographic range of a single species, range is 30.0 x 10³ km2. Figure modified from Rode and Lieberman (2004). distribution ranges estimated for species and clades. There are four basic steps in this process: (1) translate the locality data into latitude and longitude values, (2) rotate the data points onto paleocontinental positions, (3) create range maps from the rotated data points, and (4) calculate paleogeographic ranges. Locality data must be converted into latitude and longitude values by georeferencing. Once the locality data are translated into latitude and longitude values, they are mapped as an event theme onto a modern continental configuration using ArcView GIS 3.2 (ESRI, 1999) (Fig. 1.1). This coverage is then imported into PaleoGIS/ArcView 3.5 (Ross and Scotese, 2000) and rotated onto paleocontinental positions for each specified time slice (Fig. 1.2). The PaleoGIS program filters the data points so that only species extant during the specified time slice are mapped in each reconstruction. Reconstructions derived from Ross and Scotese (2000) are based on the data assembled through the PaleoMap project of Scotese (1998) and are reconstructed using several data sources including paleomagnetism, paleobiogeography, paleoclimatology, and tectonic and geologic history. The variety of underlying data produces maps that are more robust to anomalies that can occur when paleocontinental reconstructions are based on only a single data source, such as paleomagnetism or
paleoclimatology (Scotese and McKerrow, 1990). Once the data are rotated onto the paleocontinental positions, the reconstructions should be exported into ArcView 3.2 or ArcGIS 8.x for manipulation. Range maps can then be constructed for each species during each time slice in which it was extant. This is accomplished by digitizing a polygon to enclose the distribution data for each species as illustrated in Figure 3. Once range maps have been produced, the area of each polygon can be calculated. From these maps, expansions in geographic range can be quantified and correlated with appropriate geologic events, such as two regions coming into contact during a time interval. Analysis of temporal changes in the range of a single species can be conducted, as well as statistical analyses of numerous species or clades (e.g., Rode and Lieberman, 2004, 2005). More advanced GIS-based methods of range reconstruction are also available; for an example of GIS-based genetic algorithm modeling methods, see Stigall Rode and Lieberman (in press).
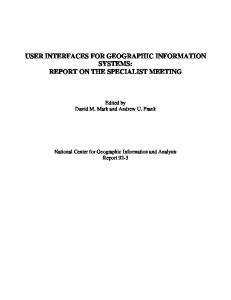
CASE STUDIES USING GIS DURING THE LATE DEVONIAN BIODIVERSITY CRISIS The Late Devonian (Fig. 2) was a time of profound evolutionary and environmental change
79
PALEONTOLOGICAL SOCIETY PAPERS, V. 11, 2005
FIGURE 2—Late Devonian paleogeography of Laurentia after Dineley (1984) and Ross and Scotese (2000) with major tectonic barriers indicated in dark gray. associated with the Frasnian-Famennian Biodiversity Crisis including reduction in speciation rates, increased extinction rates, rampant invasions of species, and ecosystem restructuring (Sepkoski, 1986; McGhee, 1996; Droser et al., 2000). The biodiversity crisis may have lasted as long as three million years with a final pulse of more severe extinction in the last few hundred thousand years of the Frasnian. To unravel the faunal dynamics of this complex crisis, it is critical to understand both the spatial and temporal patterns associated with biodiversity decline. The Late Devonian strata of eastern North America, in particular, comprise an excellent record in which to examine changing geographic ranges. The extensive sedimentary record of the Appalachian basin preserves a detailed history of the Late Devonian (Frasnian/Famennian) mass extinction, widespread range expansion of species, and a dramatic reduction in speciation rates (Dineley, 1984; McGhee, 1996). Prior to the mass extinction interval, a dramatic biogeographic change occurred from a highly endemic Middle Devonian fauna to a cosmopolitan
80
biota by the late Frasnian (Oliver, 1976, 1990; McGhee, 1996). The expansion of geographic ranges and the transition to a Late Devonian cosmopolitan biota have been documented in many taxa including rugose corals (Oliver, 1976, 1990; Oliver and Pedder, 1994), brachiopods (Boucot, 1975; McGhee, 1981, 1996), foraminifera (Kalvoda, 1990), fishes (Young, 1987), conodonts (Klapper and Johnson, 1980; Klapper, 1995), trilobites (Feist, 1991), and land plants (Raymond and Mertz, 1995). This changing pattern of geographic range, particularly range expansion events analogous to invasions of species during the Middle to Late Devonian transition, has been implicated in survival of species during the biodiversity crisis interval (Rode and Lieberman, 2004). The combination of biotic overturn, geographic expansion, and extensive fossil and sedimentary record make the Late Devonian of eastern North America an excellent interval in which to implement GIS methods, assess their accuracy, and employ these methods to decipher the faunal dynamics of a key event in Earth’s history. The three case studies presented below use GIS range reconstuctions to address specific aspects of the Late Devonian Biodiversity Crisis. Documenting relationships between invasions of species and extinction survival.-GIS analysis of brachiopod and bivalve species from the Middle to Late Devonian in Laurentia by Rode and Lieberman (2004) investigated the relationship between biogeography, relative sea level, and environmental changes. For this analysis a database, including over 8,400 occurrence points of species spanning 19 conodont zones from the Givetian to early Fammenian, was assembled based on museum collections. This database was used to reconstruct the ranges of 341 species of the 28 most common brachiopod and bivalve genera of the Middle to Late Devonian in Laurentia (Rode and Lieberman, 2004). The reconstruction of ranges of species both spatially and temporally (at the level of conodont zones) using GIS facilitated quantifying the timing and extent of events such as invasions of species into new tectonic basins and
STIGALL RODE – GIS AND RANGE RECONSTRUCTION the importance of geographic range in determining the survival of species through the crisis interval. This analysis uncovered statistically significant relationships between ranges of species, sea level, and survival of species through the mass extinction interval (Rode and Lieberman, 2004). At least three episodes of elevated rates of invasion of species between tectonic basins were determined from GIS analysis during the Late Devonian (Fig. 3). These correspond to the beginning of the Frasnian, midFrasnian, and the late Frasnian, the final two of which relate to the onset and final stage of the biodiversity crisis. These three pulses of invasion also coincide with the onset of transgressiveregressive (T-R) cycles IIb through IId of Johnson et al. (1985). The invasion into new areas and the concomitant expansion in geographic ranges may also to confer an advantage in the survival of species through the crisis interval. Species that persisted into the Famennian have significantly larger geographic ranges than species that became extinct by the end of the Frasnian (t-test, p-value