of on-line monitoring and dynamic analysis tools that support the design and test of ... A complex system is often encountered in an application that needs to.
The Application of Software Tools to Complex Distributed Systems: An Overview Diane T. Rover and Abdul Waheed Department of Electrical Engineering Michigan State University East Lansing, MI 48824 E-mail: {waheed,rover}@egr.msu.edu
Matt W. Mutka and Aleksandar Bakic′ Department of Computer Science Michigan State University East Lansing, MI 48824 E-mail: {mutka,bakicale}@cps.msu.edu
Abstract This article presents an overview of on-line monitoring and dynamic analysis tools that support the design and testing of distributed computing systems. Software tools are based on the needs of users to observe and control system performance. Of growing importance are the integration of domain-specific and commercial, off-the-shelf (COTS) tools and the rapid-prototyping of application-specific tools. To focus the discussion of tools, we introduce two contemporary examples of complex distributed systems and present a comprehensive definition. Application areas include transaction processing and control. The overview of software tools for these types of complex distributed systems emphasizes various functionalities across the system lifecycle and tool integration technologies. The overview is intended to be broad and selective, but representative, so as to give the reader a “wide-angle view” of the application of software tools in this area. Finally, we summarize the PGRT integrated tool environment, which represents a synthesis of a number of concepts presented in the article.
1
Introduction
Complex systems come in many forms, ranging from a colony of ants to a cluster of stars. These systems are characterized by a large collection of entities or members that are connected in some way. A distributed computer system is a complex system. But it also is increasingly being used to simulate and study the behavior of other complex systems in nature, society, or elsewhere. Moreover, a distributed computer system may be an entity within a larger complex system, supporting certain functions that contribute to its overall behavior. The constituents of a distributed computer system, such as its software, may be viewed as complex systems themselves. In fact, such a hierarchy of complexity at various levels is characteristic of complex systems. We will see shortly that this and other characteristics of complex distributed computer systems justify the need for applying software tools to represent, optimize, and control system 1
performance. In general, performance tools for parallel and distributed systems have been receiving considerable attention by the computing community. The purpose of this article is to present an overview of on-line monitoring and dynamic analysis tools that support the design and test of distributed computing systems, including an environment being developed by the authors to prototype various features for realtime systems. Features of growing importance are the integration of domain-specific and commercial, offthe-shelf (COTS) tools and the rapid-prototyping of application-specific tools. The term complex system in the remainder of this article refers to a distributed computing system, possibly including any system within which it is embedded. In any case, computation and/or communication are critical aspects of system behavior. A complex system is often encountered in an application that needs to accomplish a large number of interdependent tasks to satisfy a given set of requirements that may conflict with one another in multiple ways, for example, mission-critical and enterprise-wide, on-line transaction processing applications. We will highlight two examples of complex systems, a commercial and a military one, to define the types of systems and applications considered in this article. As the diversity of applications of distributed computer systems leads to a broader market, the paradigms and tools for using the systems effectively will continue to mature. Diversity also extends to the user base, which spans different domains and levels within a domain. However, the diversity also means that off-the-shelf functionality as well as flexibility, portability, and extensibility are critical to a tool’s success. Tool developers have addressed some of these issues in the context of traditional systems [21], however, the demands on functional and non-functional features of tools for complex systems are far greater. Moreover, integration of tools for complex systems is markedly different than for the modern desktop environment, due in large part to their scale and domain-specificity. This article is organized as follows. In Section 2, to motivate the remainder of the article, we provide the reader with two contemporary examples of complex systems and a comprehensive definition excerpted from a 1994 IEEE Spectrum article by Stoyenko, Laplante, Harrison, and Marlowe. In Section 3, we present an overview of software tools for these types of complex systems, emphasizing various functionalities across the system lifecycle and tool integration technologies. The overview is intended to be broad and selective, but representative, so as to give the reader a “wide-angle view” of the application of software tools in this area. In particular, Section 4 highlights the use of toolsets with parallel and distributed applications. Finally, in Section 5, to complete the picture for the reader with a specific example, we summarize an integrated tool environment that is being targeted to the types of complex systems addressed in this article.
2
2
Complex Systems
In this section, we present two contemporary examples of complex systems and a comprehensive definition. Software tools are based on the needs of users to observe and control system performance, thus the types of systems, applications, and users provide a context for later discussions of tools. We select two distributed applications in commercial and military sectors, respectively: (1) telecommunication industry transaction processing and (2) shipboard weapons control. We will see that these systems have similar distributed processing architectures, which are summarized in a general definition of complex systems.
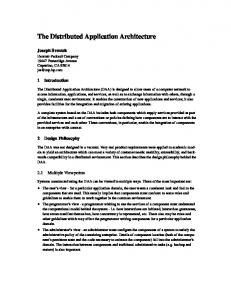
2.1 Commercial Transaction Processing Systems Transaction processing is one of the most important commercial applications of distributed computing. Transaction processing systems consist of a large number of sources of data and services distributed throughout some geographical region with a consistent set of management policies across the system. The large size of the distributed system and the difficulty inherent in managing it with some acceptable quality of service makes it a complex system. In such systems, the data and control flow mechanisms play an important role in integrating and managing the enterprise-wide distributed resources. In the example transaction processing system given in this section, we consider a network management and operation support (NMOS) system used for providing commercial telecommunication services. Telecommunication NMOS systems, such as those used for AT&T’s World Wide Intelligent Network, are integrated systems composed of subsystems, each of which may be an NMOS system itself or a generic component. Development of an NMOS system is a multi-phased effort with parts of the system in production while other parts are being developed or deployed. Figure 1 depicts the architecture of a typical NMOS system [1]. Services in this type of NMOS system include: transaction processing, decision support, data streaming, user interface, communication, alarm, audit, resource management, security, and visualization. A majority of the services employed in NMOS systems, as well as in many other clientserver systems, are developed with commercial software (versus custom software). For instance, a transaction processing service often uses one or more COTS databases. The visualization service is another example; AT&T’s NMOS system takes advantage of general-purpose data visualization used corporatewide [5].
2.2 Military Control Systems Distributed systems are becoming more common in safety-critical on-board control systems in the
3
Front-end processing
Decision support system Data stream
Decision support system tools
Audit repository
Client Agent
Broadcast
Net element Type A
Transaction processing Client
Network model
Error broadcast to all users Client
Other systems
Broadcast
Policy scheduler
Agent
Error message server
Agent
Traffic data
Agent
Net element Type B
Broadcast Net element Type C
Figure 1. AT&T’s Signal Operation Platforms-Provisioning (SOP-P) architecture for network management and operations support [1].
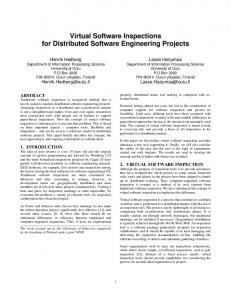
transportation industry, e.g., in aircraft and automobiles. Some systems are faced with real-time constraints. Whereas a missed deadline in a real-time, multimedia system such as on-line video conferencing can result in poor quality voice or video, in a safety-critical system, it could lead to unpredictable, catastrophic behavior. On-board distributed systems used in mission-critical applications in the military often involve highly stringent real-time requirements. Many subsystems may interact to accomplish a series of tasks on time, requiring finely-tuned local and global resource management. In the example military control system given in this section, we consider the shipboard computing system envisioned by the HiPer-D Program (High Performance Distributed computing Program). The program is conducted jointly by the Department of Defense Advanced Research Projects Agency (DARPA) and the Aegis Shipbuilding Program. It consists of simultaneous top-down engineering studies and large-scale experiments involving mission-critical systems using off-the-shelf computing products. The architecture of a HiPer-D distributed, embedded control system for the Aegis weapon system is shown in Figure 2 [25]. It is based on a generic control system architecture. Sensors, e.g., satellites and radar and sonar units, provide sensor data to be processed by the sense elements of the system (shown on the left side of the figure), which include radar systems, identification systems, the electronic sensing system, navigation systems, and sonar
4
systems. The sense elements provide data to the command and decision elements, which evaluate the data and decide what actions should be taken and when. Actions are carried out by various act elements (shown on the right side of the figure), such as gun weapon systems, fire control systems, and launch systems. Act elements schedule actuators and other resources to perform actions and monitor progress of the action. Compute-intensive functions are handled by a mesh-based parallel computing system, which is connected with the rest of the control system through various subnetworks. AN/SPY-1D signal processor
Air control
Tactical data
Aegis large screen displays
Surface RADAR system TOC server
Display workstations CEP
LAMPS systems Bridge
Identification systems
Command & decision LAN AIEWS
Signal processing LAN
LAMPS systems
Bridge to command & decision LAN
SONAR systems
Cueing sensor
Combat DF
Fire control and illumination systems VLS LAN
Navigation systems
GUN weapon system
A mesh-based high performance parallel computer with Aegis weapon system tasks mapped to the processors
Sensor LAN
Electronic sensing system
Vertical launching system
UFCS LAN Underwater fire control system
Bridge
Advanced TOMAHAWK launch control system
Advanced TOMAHAWK track control system Advanced TWCS LAN
Figure 2. Aegis weapon system based on HiPer-D shipboard computing system [9,25].
The HiPer-D system makes extensive use of COTS computing products, including ATM, FDDI, and Ethernet networks; ISIS, TCP/IP, and NTP communication support; OSF1, OSF1-RT, Ultrix, MARTi, and
5
Lynx operating systems; and SPI, JEWEL, ETAP, Goplot, and Ximp monitoring tools [9].
2.3 Characteristics of Complex Systems The preceding examples provide a context for considering a more general definition of complex systems. The reader may already have noticed some similarities in the example systems, such as decision support services, heterogeneous components, functional and non-functional requirements, resource management, and so on. But, what’s distinctive? A definition that includes distinctive characteristics can guide tool developers and users in effectively representing and analyzing system performance. Stoyenko, Laplante, Harrison, and Marlowe have identified a set of attributes that distinguish a complex system from an ordinary, or traditional, system [22]. These attributes are summarized in Table 1. Some of the attributes have been used to characterize ordinary systems (see the Sidebar). But it is the combination of these attributes that leads to a complex system by today’s standards. These attributes impose greater demands on software tools for analyzing and controlling complex system performance than for ordinary parallel/distributed systems. Software tools appropriate for the types of complex systems introduced in Sections 2.1 and 2.2 are the subject of the remainder of this article.
SIDEBAR — Parallel and Distributed Systems as Complex Systems: A Retrospective
Parallel and Distributed Systems as Complex Systems: A Retrospective In the mid-1980’s, several leading researchers described parallel and distributed computer systems as complex systems1,2,4,5. Such descriptions typically referred to pioneering work in information theory (e.g., by Hopfield, Landauer, Shannon, and Wolfram). The defining feature was that a parallel or distributed system involves the collective and simultaneous interaction of many elements engaged in computation and communication activities across a network. Gelernter2 compares honeybees and processes. He writes that like the bees maintaining a hive— individually feeble agents working in concert—a parallel program can bring large amounts of computing power to bear on a problem by establishing multiple processes or loci of activity. The bees coordinate their activities through visual and chemical signals; similarly, processes in a parallel program must communicate to work together. This is an example of a loosely-coupled, self-organizing automaton that demonstrates expedient behavior5.
6
Table 1. Attributes of a complex system that distinguish it from an ordinary system [22]. Attribute
Description
Large system size
Complex systems are large systems consisting of a number of subsystems and external components that interact with the environment.
Dynamic behavior
The structure or behavior of a complex system can change dynamically. Often, the behavior adapts to fluctuating environmental conditions.
Resource conflicts
Several subsystems or software objects within a subsystem (processes, threads, and objects) are expected to share system resources. There may be conflicting demands for the shared resources that must be resolved dynamically (may not be possible to fully analyze the conflicts statically).
Heterogeneous components
Complex systems consist of heterogeneous subsystems, for example: different parallel or distributed computing platforms connected through networks having different bandwidths (and other characteristics); real-time embedded controllers; sensors and actuators; application and system software modules; and interfaces with other systems.
Complex interactions
A large number of subsystems may interact with one another in a large number of complicated ways. Interaction is due to the inter-dependence among subsystems; types of interaction include communication (explicitly passing information from one subsystem to another) and synchronization (coordinating operations at specific points in time).
Integrability with existing systems
A complex system is often integrated with an existing, possibly large system. The cost of developing all new subsystems is typically prohibitive.
Disparate requirements
The overall system needs to satisfy a set of diverse requirements, both functional (such as correctness) as well as non-functional (such as fault-tolerance).
Critical tasks
Tasks may have hard real-time requirements and may be identified as critical. System response to these tasks must be predictable.
Management of redundant systems
Fault-tolerance requires redundant subsystems, which need to be managed dynamically.
Analog environment
A complex system typically interacts with analog (or analog-like) phenomena in the real world. Some hysteresis needs to be provided in the design to prevent the system from oscillating above and below certain threshold values.
Transient overloads
A complex system should have some built-in strategy to endure episodes of overloading by perhaps ignoring less important tasks.
Kleinrock5 also refers to bees, in particular, how killer bees find their way to North America. He wonders how distributed systems in nature have performed so well, and cites the gap between understanding and implementation of man-made systems. He presents a figure of a complex distributed system quite similar to the types shown in this article, and its caption reads “Humans have created some unbelievably complex distributed systems. The fact that they work at all is amazing, given that we have not yet uncovered the basic principles determining their behavior.” To achieve a level of performance anywhere near natural systems we will have to further uncover the underlying principles of distributed systems behavior; he gives several, ranging from more expressive models of computation to development of a macroscopic theory of distributed systems including meaningful measures of system performance. He points to the need for better tools to
7
evaluate the ways in which randomness, noise, and inaccurate measurements affect the performance of distributed systems. Fox1 considers parallel computing as a mapping of one complex system—typically a model of the world—into another complex system—the parallel computer. Both systems have static, dynamic, spatial, and temporal properties that can be used to map one system to the other. Typically, the real-world complex system is a model or simulation of a natural phenomenon that cannot be solved by conventional computers. This system needs to be mapped to the complex concurrent system to take advantage of its size and architecture to solve the problem orders of magnitude faster than the time it would require on conventional systems. If the system is solved using a matrix algorithm, we have a data domain formed by the matrix elements that are called members. The algorithm defines a graph connecting these members. These connected members form a complex system. Topological properties of different classes of complex systems are taken into account to realize their members and interconnection in different ways. Understanding of the complexity of both the real-world system and the complex computing system results in a better understanding of the advantages of specialized architectural features for specific problems. Hillis4 argues that computer scientists may benefit from a different perspective of computer systems, analyzing them as we would physical systems. He rationalizes the possibility that there is physics-like behavior in computational systems and that useful models of specific computational systems will look like physics. While both sciences study large systems of weakly interacting components, computer science has been missing many of the qualities that make the laws of physics so powerful: locality, symmetry, and invariance of scale, for example. He identifies physics-like laws that occur in the Connection Machine. Like Kleinrock, he sees the potential in being able to apply the law of large numbers and view a system at the macroscale. Several of the first commercial parallel systems were based on machines associated with Fox and Hillis: the Cosmic Cube and the Connection Machine, respectively. In less than a decade, we have somewhat re-defined a complex distributed computer system (see Table 2). However, the basic characteristics are essentially unchanged, and Kleinrock’s example system would still be considered complex. Nonetheless, just as our view of a “supercomputer” has evolved with advances in hardware and software, so has our view of a “complex (computer) system.” We have met some of the challenges in dealing with yesterday’s complex computer systems. But, these were the “easy” problems: as
8
Dan Reed (University of Illinois, Pablo Project) has said, referring to tools for parallel and distributed systems, “The easy problems are hard, and the hard problems are really hard.” To tackle the hard problems, we may need to re-visit the complex systems field. Directly or indirectly, many computer scientists and other scientists have suggested that the behavior and properties of other complex systems may enhance our understanding of parallel/distributed computer systems. For example, the following general parameters and properties of complex systems were cited as applying to parallel/distributed systems: size, structure, dimension, granularity, communication patterns, balance, hierarchy of levels, scale invariance, etc. In his book, James Gleick chronicles a set of beliefs about complexity that was once shared by scientists and an alternative set of ideas that was gaining acceptance3. Three early beliefs were: (1) simple systems behave in simple ways; (2) complex behavior implies complex causes; and (3) different systems behave differently. However, over the past twenty years (at the time of his writings), ideas changed: (1) simple systems give rise to complex behavior; (2) complex systems give rise to simple behavior; and (3) the laws of complexity hold universally, regardless of the details of a system’s constituent parts. So, understanding complexity in one system may lend insight into understanding complexity in another system. Also, there is reason to believe that simplicity exists at some level in the system. References
1. Fox, G. C., “Parallel Computers and Complex Systems,” Complexity International, 1994. Available on line from http://www.csu.edu.au/ci/vol1/Geoffrey.Fox/paper.html. See also: Fox et al., “The Theory of Complex Problems and Complex Computers” in Solving Problems on Concurrent Processors, Prentice Hall, 1988, p. 39. An earlier reference is: G. Fox and S. Otto, “Concurrent Computation and the Theory of Complex Systems,” published in Hypercube Multiprocessors, ed. M. Heath, SIAM, 1986. 2. Gelernter, D., “Programming for Advanced Computing,” Scientific American, 257(4), October 1987, pp. 91–98. 3. Gleick, J., Chaos: Making a New Science, Viking, 1987. 4. Hillis, W. D., The Connection Machine, The MIT Press, 1985. 5. Kleinrock, L., “Distributed Systems,” Communications of the ACM, 28(11), November 1985, pp. 1200– 1213. Note: The term complex system in this Sidebar is not restricted to computer systems and refers to the complex systems field as found in multiple disciplines.
SIDEBAR — Parallel and Distributed Systems as Complex Systems: A Retrospective
9
3
Software Tools and Technologies for Complex Systems
In both examples of complex systems, transaction processing and control, tools are applied to qualify functional and non-functional system performance. Tools are used by various users throughout the system life-cycle to support design and testing. One user may access only high-level performance data to monitor loads in different parts of the system. Another user may require program-specific data, e.g., about variables or procedures. Yet another may need data to assess the effectiveness of the scheduling policy. And so on. As we have seen for ordinary systems, tools must be developed with users’ needs as the primary criteria, considering issues such as functionality and usability [20]. However, building functional, usable tools often leads the tool developer into software technology and design issues. So, we include both user and developer perspectives in this section as we present an overview of monitoring and analysis tools. In terms of functionality, we first classify tools according to their analysis objectives and their applicability at various stages from design to test. We then focus on aspects of tool design that are of increasing relevance to functionality and usability, especially for complex systems: the integration of domain-specific and COTS tools and, via the example of Section 5, the rapid-prototyping of application-specific tools. Several important tool design issues are beyond the scope of this article, including special real-time specification and implementation techniques for the tool itself.
3.1 Tool Functionality We begin by categorizing tools somewhat coarsely. Figure 3 presents a taxonomy of tools based on a range of functions that support system design, analysis, test, and operation/control. At a gross level, we distinguish between static and dynamic analysis. Static analysis is typically applied at an early stage of system development, whereas dynamic analysis is possible once a prototype or actual system is operational. A better distinction between static and dynamic approaches is that dynamic analysis procedures depend on runtime information collected during execution of the system. Conversely, static analysis tools can work with a mathematical model of the system, blocks of code, or other non-runtime information. Static analysis has been applied to analyze program correctness, race conditions, resource conflicts, etc. Such static analyses have been effective in designing, for example, pipelined computational structures and message-passing software. However, complex systems like those described in Section 2 are difficult to analyze using only a prior knowledge about their structure or behavior. Therefore, many contemporary tools employ measurement-based techniques to analyze complex systems. These techniques involve identifying a system under test (SUT) and designing measurement experiments to collect runtime
10
Analysis Tools
Dynamic Analysis
Static Analysis
Specification and Modeling
Scheduling
Run-time Data Collection
Formal Analysis
Off-line Analysis Tools
Visualization
Monitoring Performance Tuning
On-line Analysis Tools
Dynamic Assertion Checking
Discrete-event Simulation Adaptive Steering
Resource Management
Synthetic Workload Gen.
Figure 3. A taxonomy of tools used for design, evaluation, testing, and control of existing complex systems.
information about the SUT or its prototype. Measurements are useful for direct evaluation of the SUT, including checking program correctness, diagnosing performance bottlenecks and testing various system configurations and policies, and for parameterization of analytic or simulation models for the SUT. A tool can be used on-line during program execution or off-line. Off-line analysis is typically used for detailed evaluations based on stored runtime data. For instance, system modeling requires detailed information to parameterize a model to investigate “what if” questions. On-line analysis is used when it is necessary to process data on-the-fly. For instance, a tool used for controlling the operating parameters of an application based on user input (i.e., a steering tool) needs to represent the behavior of the system in real time. Both off-line and on-line tools rely on a data collection (instrumentation) system. Monitoring tools are used for collecting runtime information from physically distributed processes within the system. Performance tuning tools process the collected data to help programmers locate performance bottlenecks and optimize their applications. Scheduling tools are used off-line to determine feasible schedules for a set of tasks that need to meet a set of constraints. On-line scheduling tools (or algorithms) are used as a core of dynamic resource management tools to make the system responsive and adaptive to the changing workload behavior. Dynamic assertion checking tools enforce certain properties of behavior and thus help locate faults. Adaptive steering tools allow the user to control some aspects of dynamic
11
system operation based on the feedback provided by monitoring, visualization, and evaluation tools. Discrete-event simulation tools are generic tools used to model and evaluate a complex system at early stages of development. In general, testing of complex systems requires a testbed rather than a tool to allow the designers to study the system behavior thoroughly before deploying it. A testbed is usually a collection of a large number of (possibly hybrid) software and hardware modules to exercise the system in a carefully controlled and monitored environment. Typically, a testbed uses multiple synthetic workload generators to exercise the system under test. Visualization tools provide graphical user interfaces and graphical displays to support any of the previously named analyses. Analysis tools are applied at various stages in the life-cycle of a complex system. Figure 4 represents four stages (or phases) in the evolution of a typical large complex system: system specification and design, testing, deployment, and re-engineering. Table 2 correlates tools identified in Figure 3 with these stages. A complex system is initially designed according to detailed specifications using appropriate tools/languages. Other types of mathematical modeling and formal analysis tools are also useful at this stage to analyze the expected behavior of the system. Initial design and development results in a prototype of the system that must undergo extensive testing. This stage involves runtime measurements to debug, tune, and analyze the system behavior until it satisfies the functional and non-functional requirements. Visualization tools lend insight into the typically large amount of measured data. After testing, the system is deployed. At this stage, the system may need to adapt to real-world conditions which were not possible to replicate in the testing stage. System operators may steer the system based on the overall load and performance. Additionally, resource management tools may be configured to respond automatically upon detecting resource utilization thresholds. Performance bottlenecks and system failures can be identified. Workload and performance information can be fed back to designers for purposes of re-engineering to address problems and enhance capabilities. Table 2 is intended to show how tools are distributed throughout the life-cycle, although it should be interpreted flexibly.
Feedback
System specification and design
Testing
Deployment
Re-engineering
Figure 4. Stages of development and operation of a complex system.
12
Table 2. Application of tools at various stages in the life-cycle of a complex system. Type of Tool
Life-Cycle Stage System specification and design
Testing
Deployment
Re-engineering
System specification [17]
✔
✔
System modeling
✔
✔
Formal analysis [3]
✔
Scheduling
✔
✔
Monitoring Visualization
✔
✔
✔
✔
✔
✔
✔
✔
✔
Debugging
✔
Performance tuning
✔
✔
Bottleneck searching
✔
✔ ✔
Adaptive real-time steering
✔
Resource management ✔
Dynamic assertion checking
✔
Discrete-event simulation
✔
✔
✔
Synthetic workload generation
✔
✔
✔
There are a variety of commercial and research tools targeted to complex systems in each of the analysis categories of Figure 3. We select a few representative tools and highlight their functionality in Table 3. These tools are selected for their potential to deal with complex systems, although there presently exists little to no usability data on how effectively they have been applied by real users. While important, the evaluation of software tools is beyond the scope of this article. Each of the tools in Table 3 is a dynamic analysis tool and, as such, relies on runtime data. Most of the tools focus on correct real-time behavior and/ or acceptable quality of service (instead of, e.g., high speed) due to the computational objectives of the distributed systems being targeted. The first four tools are well-suited for real-time applications similar to the HiPer-D example; and the latter tools, transaction/data processing applications like the NMOS example. However, tools can cross application domains; tool technology is evolving so that users can rapidly prototype a domain-specific tool from a more generic environment (e.g., for scientific applications, the Viz visualization programming system [10]). From Tables 2 and 3, we can see that a user’s needs may be met by a number of different tools. Moreover, from design to test, multiple tools are likely to be invoked, and due to system complexity, probably by different users with different expertise. Thus, we have a scenario similar to other areas of hardware and software development that rely on computer-based tools for designing large-scale, complex systems, i.e.,
13
Table 3. Tools for complex systems. Tool/ Environment SPI
Type of tool
Description of Key Functionality
Monitoring, visualization, tuning, correctness checking
Scalable Parallel Instrumentation (SPI) is Honeywell’s toolset for testing and correctness checking on heterogeneous computing systems. SPI supports a user-defined, application-specific instrumentation development environment, which is based on an event-action model and event specification language.
Simulation, monitoring, tuning, scheduling, and visualization
In PGRT (Performance Gateway to Real Time), a tool integration environment supports the collection, conversion, and transfer of performance data from multiple, heterogeneous sources in the distributed system to offthe-shelf and domain-specific visualization and analysis tools.
DIRECT/JEWEL
Monitoring, scheduling, adaptive realtime steering
Runtime information collected by the instrumentation system (JEWEL) is fed to a dynamic scheduler. The scheduler uses this information to adaptively control the real-time system to be responsive to variations in important system variables.
RMON
Dynamic resource scheduling and management
RMON monitors the resource usage for distributed multimedia systems running RT-Mach. Information collected is used for adaptively managing the system resources through real-time features of the operating system.
Visualization
Visualization tools present data about long-distance calling frauds through unusual calling patterns, communities of interest in local calling, customer retention, source code, and textual databases. [5]
RT
PG
Reference: http://www.sac.honeywell.com/
Reference: http://web.egr.msu.edu/VISTA/Pgrt/pgrt.html
Reference: http://borneo.gmd.de:80/RS/Papers/direct/direct.html
AT&T Visualization System
Reference: http://www.cs.cmu.edu/afs/cs.cmu.edu/user/cwm/www/ publications.html
Reference: http://www.att.com/att-tj/ A+OpenWatch
Network resource management, visualization
NonStop TUXEDO
Enterprise transaction processing monitoring
Using a CMG standard called Universal Measurement Architecture (UMA), application-specific data are collected from Unix-based, enterprise-wide distributed client-server systems. The information can be used with several A+ tools developed by Amdahl. A+OpenWatch is one such tool used for distributed threshold monitoring to allow exception-based network management. Reference: http://www.amdahl.com/doc/products/oes/pm.oes/perfhome.html This Tandem product monitors enterprise-wide transactions on heterogeneous Unix-based transaction processing systems. Reference: http://www.tandem.com/INFOCTR/HTML/PROD_DES/ NSTXDOPD.html
electronic design automation and computer-aided software engineering. In these areas, tool frameworks and integration environments are being offered as solutions. In order to develop integrated software environments for complex systems, tool developers must use appropriate tool integration technology, which is the topic of the next section.
3.2 Integration Technologies To support scientific applications for parallel/distributed systems, the toolmaking community has developed a broad range of debugging and performance tools. However, Cherri Pancake has pointed out
14
that “... only one in fifty research tools are usable or useful ...”, that “... one in twenty parallel tools from the industry succeed ...” [18]. At the same time, some users faced with programming immensely complex parallel and distributed applications have found tools to be absolutely essential, albeit imperfect. Thus, scientific high-performance computing (HPC) is experiencing a problematic situation in which an apparent abundance of tools are being avoided by most users. The situation for embedded HPC or distributed HPC will not be any better and is likely to be worse due to the diverse nature of the systems as well as the users. Integration technology—that is, support for multiple, possibly heterogeneous, tools that cooperate for carrying out one or more analyses of the same application—is considered a solution to this problem if the technology can assist by making tools easy to learn, easy to use, consistent, and with clear added value [20]. Debates about integration have focused on what features of integration may benefit the user [19,20,21]. Both developers and users acknowledge that there are instances in which an integrated tool environment may either add value to or detract value from the user’s program or performance analysis tasks. Table 4 summarizes the value added and value detracted features identified by the tool developers and users [20]. Although put forth in the context of scientific HPC, these features are relevant to tool integration in general. As COTS software tools become more prevalent, the value of integration becomes a central issue: should commercial tools be designed for “plug-and-play” use? And if so, what are the technologies? Integrated tool environments rely on particular mechanisms for data sharing, control, and presentation. Figure 5 depicts three basic integration technologies: 1. Mechanisms to allow the user to interact with the tools as well as allow the tools to present results to the user (represented by the top box in the figure). 2. “Glue” technology to allow various tools to work in a consistent, flexible manner (middle box). 3. Services, called middleware services [2], to support various system functions of a generic nature (independent of the system) (bottom box). In short, these technologies are what joins user, system, and tool interfaces. The choice of mechanisms and services impacts whether value is added via the integration. Details pertaining to the figure can be inferred from the example in Section 5, which describes the PGRT environment, an integrated tool environment that is being targeted to the types of complex systems addressed in this article. Two other projects in integrated tool environments, which target ordinary systems, are reviewed in the Sidebar. In the next section, we cite examples from the literature illustrating the application of software toolsets to program/performance analysis.
15
Table 4. Value added and value detracted features of integrated tool environments. [20] Value added features
Value detracted features
Connecting a source code-level debugger with a visualizer. These tools can complement one another; a visualizer can expose problems, while the debugger provides traceability to the code.
Increased costs. The nature of the costs of integration varies, including start-up costs, or the time and perturbation of invoking the integrated environment compared to an individual tool.
Inserting additional instrumentation at runtime, e.g., via a debugger or other dynamic mechanism. When monitoring a program, a user does not necessarily know prior to execution what program or performance data will be of most interest, especially in the case of unexpected problems.
Constrained usability or applicability of stand-alone tools. Conformance with an integrated environment may constrain an existing tool. For example, data integration may constrain what a user can observe, and control integration may constrain how a tool can be used.
Combining a scientific visualization system with performance tools. For a domain-oriented programmer, program output from a scientific visualization system provides a visual means to assess program correctness and to identify program state.
Inconsistency with a tool user’s present base of knowledge. Issues to be addressed include ease of learning, ease of retention, and other human-computer interaction factors.
Including steering technology, to support program steering, or real-time control of program execution. Based on the visualizer output, a user can alter some aspect of the program while it is executing.
Greater disparity among novice versus expert users. Dealing with different types of users (different computing backgrounds, different tool usage experiences, etc.) is an unresolved problem for even a stand-alone tool.
Synchronizing trace-driven displays from multiple tools. Time-correlated views are essential.
Tool selection problems. What functions are supported by various tools, and how can a user’s problem-solving needs be met? Is the choice of a tool clear?
Incorporating memory usage information and memory system performance with other tools. A programmer recognizes the impact of memory accesses on system performance and wants better facilities to analyze the causes and effects.
Tool navigation problems. What are the appropriate paradigms and technologies for accessing and using multiple tools in a coordinated fashion?
Integrating the compiler with performance tools. The compiler has program information useful to performance tools; and, conversely, a performance tool has performance information of potential use to a compiler.
Response time of environment. Increased data management and transfer overhead can cause unacceptable delays in any individual tool’s typical response time to service user requests. A user needs feedback on whether some request is likely to incur excessive overhead.
Integrating performance prediction models with performance tools. Predicted performance can be compared with actual performance for validation and benchmarking purposes; and actual performance parameters and workload characteristics can be extracted for use with models.
User dissatisfaction. If a user is dissatisfied with one component of an integrated environment, he/she may never use the environment again, despite the merits of individual tools.
Providing a programmatic interface (API) to tools. This facilitates application use of tool functions as well as extension of tool functionality.
Testing. Testing of integrated tools is orders of magnitude more difficult than testing of individual tools.
SIDEBAR — Current Work in Integrated Tool Environments: Two Examples
Current Work in Integrated Tool Environments: Two Examples [20] Two examples are excerpted from a summary by Rover, Malony, and Nutt to illustrate current research 16
Integration technology
SUT—System Under Test API—Application Programming Interface
User interactions and presentation integration
Interaction is indirect through middleware
• GUI • API • Interpreter
Experiment specification
Direct interaction
Tool registration
“Glue” technology SUT SUT SUT Agent Agent Agent
Complex system as a whole
• OS based • Library based • Language based
Data collection and experiment control
SUT SUT Registered tool Agent Agent API
Available set of tools
Data and control integration Middleware services • Data collection • Message-passing • Resource management
Figure 5. Interfaces and technologies for a typical integrated tool environment for a complex system.
directions in integrated tool environments: ParaVision and TAU. These environments are targeted to scientific applications.
ParaVision. ParaVision7 is based upon a general model of an integrated environment shown in Figure S1, which depicts some important relationships among components in a multiple tool environment. In this model, an integrated environment contains facilities to instrument programs to observe their execution, to analyze behavior as recorded by the instrumentation, and to present behavior using a spectrum of views (ranging from tabular to visual, real time to post mortem, static to animated, and qualitative to quantitative); debuggers, program data visualizers, and performance tuning tools share these facilities. A goal of this environment is to enable domain-oriented programmers to configure the instrumentation, analysis, and reporting tools from a perspective that they choose rather than from any a priori view, thus meeting the needs of the programmer in different situations. This so-called observation perspective, which is a set of views of program behavior that provides complementary presentations of specific aspects of behavior, has its origins in the multiple views specified by LeBlanc, Mellor-Crummey, and Fowler4. The 17
multiple views concept has been a guiding principle in visualization tool design. For example, IPS-2 provides an instance of a hierarchically related set of observation perspectives and indicates that an arbitrary hierarchy can be implemented (by the tool builder) as required 6. Pablo employs a mechanism for interconnecting fixed atomic modules to process events from user-defined instrumentation to provide different observation perspectives 8. VISTA specifies an integrated tool environment that supports multiple display and analysis strategies via diverse tools9. Data flow Control flow Source Program
Instrument Tool Control
Event Monitor
Debugger Presentation
Runtime Environment
Analysis Tool User Interface
Execution Architecture
Tools
Figure S1. An integrated tool environment (ParaVision).
More specifically, ParaVision represents a prototypical integrated tool environment derived from the architecture shown in Figure S2. An observation perspective is realized through a set of tools and views. The perspective manager registers and launches tools that are to be added to an observation perspective.
TAU. TAU (Tuning and Analysis Utilities) is a visual programming and performance analysis environment for pC++2,5. Figure S3 shows the pC++ programming environment and the associated TAU tools architecture. Elements of the TAU graphical interface represent objects of the pC++ programming paradigm: collections, classes, methods, and functions. These language-level objects appear in all TAU utilities. TAU uses the Sage++ toolkit as an interface to the pC++ compiler for instrumentation and accessing properties of program objects. TAU is also integrated with the pC++ runtime system for profiling and tracing support. It uses Tcl/Tk for graphics. The TAU tools are implemented as graphical hypertools. While they are distinct tools, they act in concert as
18
Execution Architecture
Data flow
Event Monitor
Control flow
Tool Set
Trace Extrapolation
Events
Perspective Manager
Event Demux
Configuration
Tool
Tool
Tool
View
View
View Observation Perspective
Tool Installation
View ControllerManagement Management View-Contoller
Programmer Figure S2. The prototype environment architecture (ParaVision).
if they were a single application. Each tool implements some well-defined tasks. If one tool needs a feature of another one, it sends a message to the other tool requesting it (e.g., display the source code for a specific function). This design allows easy extensions. The TAU tools also support global features. If a global feature is invoked in any of the tools, it is automatically executed in all currently running TAU tools. Examples of global features include select-function, select-class, and switch-application. The user can choose to compile a program for profiling, tracing, and breakpoint debugging. In these cases, the instrumentor is invoked to do the necessary instrumentation in the abstract syntax tree (AST). The compilation and execution of pC++ programs can be controlled by COSY. This tool provides a high-level graphical interface for setting compilation and execution parameters and selecting the parallel machine where a program will run. The program and performance analysis environment, shown on the right side of the figure, includes the integrated TAU tools, profiling and tracing support, and interfaces to stand-alone performance analysis tools developed partly by other groups. The TAU toolset provides support for
19
pC++ source pC++ compiler
pC++ class library
τ static
analysis tools fancy
cagey
classy
frontend
instrument commands
instrumentor
pC++ RTS
backend
τ dynamic analysis tools
Sage++ breezy
racy
easy
AST program data
τ auxiliary
executable file
run
profile data
tools
event traces
cosy performance tools POPEYE
SIMPLE
UpShot
Pablo
Figure S3. Programming and performance analysis environment and toolset architecture (TAU).
accessing static information about the program and for querying and analyzing dynamic data obtained from program execution. These examples demonstrate that developers are looking toward integration and that various implementation strategies are possible. Tool developers in industry are proposing tool environment infrastructures as vehicles to enable development and transfer of tool technology 1. References
1. Breazeal, D. and B. Ries, “A Building Block Approach to Parallel Tool Construction,” in Debugging and Performance Tuning for Parallel Computing Systems, ed. by M. Simmons, A. Hayes, J. Brown, and D. Reed, IEEE Computer Society Press, 1996. 2. Brown D., S. Hackstadt, A. Malony, B. Mohr, “Program Analysis Environments for Parallel Language Systems: The TAU Environment,” Proc. of the Second Workshop on Environments and Tools For Paral-
20
lel Scientific Computing, May 1994, pp. 162–171. 3. Hollingsworth, J. K. and B. P. Miller, “Dynamic Control of Performance Monitoring on Large Scale Parallel Systems,” Proc. of Int. Conference on Supercomputing, 1993, pp. 185-194. 4. LeBlanc, T., J. Mellor-Crummey, and R. Fowler, “Analyzing Parallel Program Executions Using Multiple Views,” Journal of Parallel and Distributed Computing, 9(2) June 1990, pp. 203-217. 5. Malony, A., B. Mohr, P. Beckman, D. Gannon, S. Yang, F. Bodin, and S. Kesavan, “Implementing a Parallel C++ Runtime System for Scalable Parallel Systems,” Proc. of Supercomputing ‘93, 1993, pp. 588597. 6. Miller, B. P. et al., “IPS-2: The Second Generation of a Parallel Program Measurement System,” IEEE Transactions on Parallel and Distributed Systems, 1(2), April 1990, pp. 206–217. 7. Nutt, Gary J. and Clive F. Baillie, “Integrated Debugging and Tuning Environments,” University of Colorado, October 1994. 8. Reed, Daniel A., Ruth A. Aydt, Tara M. Madhyastha, Roger J. Noe, Keith A. Shields, Bradley W. Schwartz, “The Pablo Performance Analysis Environment,” Dept. of Comp. Sci., Univ. of Ill., 1992. 9. Waheed, A., B. Kronmuller, Roomi Sinha, and D. T. Rover, “A Toolkit for Advanced Performance Analysis,” Proc. of Int. Workshop on Modeling, Analysis and Simulation of Computer and Telecommunication Systems (MASCOTS ‘94), 1994, pp. 376–380.
SIDEBAR — Current Work in Integrated Tool Environments: Two Examples
4
Effective Use of Toolsets with Parallel/Distributed Applications
In this section, we expand upon two previously introduced examples, the HiPer-D and TAU systems, to highlight the effective use of toolsets with parallel and distributed applications. These systems are notably distinct in their application domains and parallelism. In each case, a diverse set of tools enables users to successfully locate bottlenecks by synthesizing relevant information.
HiPer-D System [9,25]. The HiPer-D system was introduced in Section 2.2 as an example of a complex, distributed system. The current testbed applies a suite of tools to evaluate system performance in various tactical scenarios. A primary focus is track processing and management, in which each object sensed in an area around a ship is considered a track, and its processing through the distributed system is called an engagement path. The users of the system are concerned with testing individual subsystems, such as networks, and with evaluating integrated system performance from an end-to-end processing perspective. This involves numerous metrics related to resource utilization, communication, and track processing (e.g., latency). A number of test and measurement tools were applied, including: ETAP, JEWEL, ISIS Ximp, and Goplot. The Event Trace Analysis Package (ETAP) was developed by OSF (Open Software Foundation) to observe 21
fine-grained, operating system-level activity. ETAP also provides user-level probes that can be inserted in the application code to integrate operating system data with application data. JEWEL, described further in Section 5.1, is a distributed, application-level instrumentation system. It supports on-line monitoring of distributed applications, control of measurement-based experiments, data analysis and reduction, and visualization. ISIS provides consistent communication services in the system. Through ISIS instrumentation, Ximp monitors the ISIS client/server message-passing and fault detection/recovery behavior. Goplot is a gnuplot-based data collection and plotting system, designed by HiPer-D developers for use in a networked environment. Trace files from system applications are automatically collected, reduced, formatted, and plotted; it allows for archiving and comparing multiple runs. The Graphical Presentation System (GPS), which is part of JEWEL, is also used for on-line and off-line analysis of the system load and behavior. Tools were added to the HiPer-D system to address specific performance problems as they surfaced during testing. For instance, application-level instrumentation data indicated the presence of unusually long track processing times in some cases. To resolve this, operating system and communication system instrumentation were integrated into the system. Developers report that “innovative use” of JEWEL and ETAP has “provided required insight into the temporal dynamics of the complex distributed computing infrastructure;” and that “the value of the JEWEL graphs and the Goplots to HiPer-D cannot be overstated.” In particular, use of tools enabled the developers to realize an increase in the HiPer-D track capacity by an order of magnitude (from 100 to 1000 tracks). This resulted from several months of effort that located “track pipeline” bottlenecks one by one and resolved them in succession: “the painstaking but necessary work performed in evolving the track capacity of HiPer-D represents a successful example of system-level tuning.”
TAU System [15]. The TAU (Tuning and Analysis Utilities) system is a family of programming and performance analysis tools designed for use with the pC++ parallel object oriented language. pC++ is based upon a concurrent aggregate extension to C++ and has been ported to many parallel/distributed platforms. TAU is introduced in the Sidebar on integrated tool environments; its architecture is shown in Figure S3. Malony, Mohr, Beckman, and Gannon illustrate the use of TAU tools via the design and evaluation of a bitonic sort module in a large N-Body simulation of cosmological evolution. Static analysis tools in TAU enable the user to navigate through a large pC++ program: a global function and method browser fancy; a static callgraph display cagey; and a class hierarchy display classy. These tools are integrated with dynamic analysis utilities: an execution profile data browser racy; an event trace
22
browser easy; and a breakpoint debugger breezy. Global features of TAU allow the user to find execution information about language objects. Thus, TAU tools can be used to explore the static program structure (class hierarchy, source code, and call graphs) and answer questions about dynamic system and algorithm behavior. The N-Body simulation example demonstrates the importance of coupled program and performance analysis wherein serious bottlenecks in a code can be linked back to high-level algorithm design choices; in the case of bitonic sort, a replacement of quicksort with bitonic merge at each merge step improved performance by nearly an order of magnitude. The developers state that raising the level of parallel/distributed program software design to that of desktop and workstation tools has been received very positively and relies on “integration of programming environment technology and parallel algorithm design.” One direction of the developers is towards more expanded support for performance experimentation and diagnosis, particularly for scalability analysis, by integrating into the TAU toolset a simulation-based performance extrapolation tool, a semi-automated performance diagnosis system, and a database of program measurements. Similarly, use of modeling and simulation tools to support scalability analysis has been demonstrated by Yan, Sarukkai, and Mehra with the AIMS (Automated Instrumentation and Monitoring System) toolkit [26], a toolset for tuning and predicting the performance of large-scale, message-passing parallel and distributed scientific applications. Trace files from AIMS’ modeling tool can be read by its visualization and profiling tools to analyze simulated performance. Additionally, program execution traces can be piped to tools such as gnuplot or Mathematica, which extract constant factors and incorporate complexity information and cost models to study the expected behavior of the program. These examples reflect advantages in coordinated use of several tools and opportunities for further integration.
5
PGRT Integrated Tool Environment
Tool integration ideas are gaining acceptance among tool users and developers in the scientific HPC domain (see Table 4 and the Sidebar). The same rationale become even more compelling in the complex systems domain in light of the range of tool functionalities outlined in Section 3.1 and the diversity of applications and users. A particular user needs access to application-specific tools or to rapid prototyping tools that can perform specific data analyses or generate specific data displays. In this section, we complete the overview of software tools by summarizing the architecture and technologies of our integrated tool environment for complex systems and describing its utility in analyzing a distributed application.
23
5.1 Components of the PGRT Environment The PGRT Tool Integration Environment (PGRT–TIE) is part of a larger PGRT environment. The PGRT name stands for Performance Gateway to Real-Time system behavior, reflecting its role as the interface enabling users to observe and control the parallel/distributed system. The name also acknowledges the ParaGraph tool, developed by Heath and Etheridge—its successful qualities and its impact on users/ applications in the scientific HPC domain. The architecture of PGRT is shown in Figure 6 and is centered around PGRT-TIE. PGRT facilitates the analysis and visualization of real-time parallel and distributed systems. The Complex System Simulator (CSS) or an actual complex system is monitored. The DRMS scheduling tool is integrated by means of PGRT-CSS, the CSS front-end. The Vista Instrumentation System Manager (ISM) collects and preprocesses instrumentation data from either CSS or a real system, and forwards event traces to PGRT-TIE. The ISM is integrated via the Vista Instrumentation System extension. The JEWEL Instrumentation System extension integrates the JEWEL distributed measurement system. The XDR extension provides flexible access to the XDR protocol that is extensively used in JEWEL. PGRT-TIE is based on the Guile implementation of the Scheme language [4,14]. To support visualization, low-level visual object class implementations are linked with PGRT-TIE, so that high-level visual objects can be derived and prototyped in Scheme. The Guile interface to Tcl/Tk is used for GUI development. Interfaces to off-the-shelf tools are prototyped in Scheme (using Guile system extensions), APIs, and Expect, and then hard-coded in the native language as PGRT-TIE extensions.
PGRT–TIE. PGRT–TIE is conceptualized as a set of instrumentation, visualization, and tool integration extensions to the Guile implementation of the Scheme language. The current Guile distribution is based on the portable SCM interpreter [11]. It includes several modules: an interface to Tcl/Tk [24] that allows development of Tk-based GUIs in Scheme; user-level threads in Scheme; Unix system extensions including regular expressions and networking; functionality of the Expect library [13] that allows interactions with off-the-shelf tools using Scheme scripts; SLIB high-level utilities [6], such as advanced data structures, macros, debugging support, and high-level I/O; C-like syntax extension; Scheme-to-C compiler; and more. PGRT uses Guile because it allows for rapid prototyping and development of a wide range of tools and environments, yet poses little limitation on the application size. The goal of PGRT–TIE is to provide the following features:
• full access and control over the instrumentation system; • capability to integrate off-the-shelf instrumentation systems; • a library of built-in visual objects to process and visualize instrumentation data;
24
LIS LIS
System Nodes
DRMS
LIS
LIS
event traces and control
LIS
CSS
automatic code generation processor and task allocations
feasible schedules
LIS
JEWEL distributed instrumentation
Vista ISM
system
... event traces and control
DRMS CSS LIS ISM GUI TIE S/DLL API LL XDR
Distributed Rate-Monotonic Scheduler Complex System Simulator Local Instrumentation Server Instrumentation System Manager Graphical User Interface Tool Integration Environment Static/Dynamic Linking and Loading Application Programmer’s Interface Low-level External Data Representation
. . .
RT
PG -CSS
Instrumentation System extensions
RT
GUI
PG -TIE
XDR
Visual Objects extension
S/DLL
Visual Object LL class implementations
Tool interfaces: APIs and Expect data and commands
data and commands
... Off-the-shelf Visualization and Analysis Tools
Real-time Visualization Tools
Figure 6. Architecture of PGRT environment.
• rapid prototyping of user-defined visual objects in Scheme, choosing among several underlying, built-in implementations for various output devices and visualization technologies;
• capability to integrate third-party support for visual objects; • a mechanism for registering visual objects to asynchronously or synchronously visualize on-line system performance;
• the above mechanism, extended via stubs to provide registration of off-the-shelf analysis and visualization tools and environments; and
• rapid development of graphical user interfaces to extend the functionality of a target application and provide access to the above features at the highest level.
Vista ISM. Vista is a C++ framework for development of domain-specific instrumentation systems. An instrumentation system (IS) is defined as a set of modules and services that supports the collection and management of program/performance data [23]. Figure 8 presents a generic instrumentation system model that guides the design of the Vista framework. It represents a majority of components found in extant ISs. The model defines three components of an IS that supports tool integration: (1) local instrumentation server (LIS), (2) instrumentation system manager (ISM), and (3) transfer protocol (TP). The LIS captures instrumentation data of interest from the concurrent application processes. It forwards instrumentation data from the concurrent system nodes to a logically centralized location called the Instrumentation System 25
Manager (ISM), which manages the data in real-time. The functions of the ISM include temporary buffering of data, storing of data on a mass-storage device, and preprocessing of data for on-line analysis and/or visualization tools. Instrumentation data transfer to the tools is typically accompanied by an exchange of control messages between the ISM and a tool. Additionally, control messages may need to be passed between the ISM and concurrent application processes (via the LIS) to control program execution as dictated by debugging and steering tools [8] in the environment. The Vista framework supports multiple, high-level transfer protocols (TP) for consistent IS-related communications. User interactions
Concurrent system nodes
Set of supported tools
Instrumentation System Manager (ISM) Local Instrumentation Server (LIS)
Input buffers
Raw instrumentation data
Instrumentation data processor
Control
Output buffers
Tools with front ends for control and data integration
Processed instrumentation data
Local Interconnection network Transfer Protocol (TP)
Target parallel/distributed system
Storage hierarchy
Integrated parallel tool environment on the host system
Figure 7. Generic instrumentation system model.
The PGRT–TIE IS extension is the interface for data supplied by the ISM. It provides Scheme primitives for accessing IS functions, such as receiving data from the ISM in a specified format. While using IS primitives in this way provides low-level access to the IS library, an extension can be written in C/C++ to provide a high-level registration mechanism for other PGRT–TIE modules or external tools that consume instrumentation data. The amount of “soft” Scheme vs. “hard” C/C++ code may vary, depending on the flexibility/speed tradeoff for a target application. Additionally, the IS extension, since it provides access to the full IS library, can be used to simulate LISs and (artificially) generate events, which may be useful for IS testing.
JEWEL. JEWEL is a distributed instrumentation and measurement system developed at the German National Research Center for Computer Science [12]. Three of its major components, as shown in Figure 8, are: (1) the system under test (SUT), (2) the distributed measurement system, and (3) a central monitor and control system. The SUT is assumed to be distributed over several sites and can be divided into subsystems. To achieve low interference with the SUT, JEWEL has its own physical resources attached to the SUT, its own LAN, and a LAN monitor. Three types of components within the measurement system are: sensors, collectors, and evaluators. A dedicated workstation is used to control all the components from
26
a central site. The monitor and control system is divided into the Graphical Presentation System (GPS) and the Experiment Control System (ECS).
Site 1 Load generator
...
Site n
LAN
Load generator
Local SUT
Local SUT
Sensors
Sensors
Filtering Collecting Evaluating
Filtering Collecting Evaluating
Control Information
Measurement System
System Under Test
Filtering Collecting Evaluating
Measurement LAN
Monitor and Control System
Figure 8. JEWEL distributed measurement system architecture.
JEWEL has been integrated with PGRT-TIE in such a way that PGRT-TIE acts as a JEWEL component, receiving instrumentation data from other components and responding to commands from ECS. One of the protocols used in JEWEL is the XDR protocol for the description and encoding of data. Applicationspecific instrumentation data types are specified in XDR. The XDR extension of PGRT-TIE supports this protocol in Scheme and includes an XDR-to-Scheme translator. The translator allows PG RT-TIE to adapt to changes in SUT-specific XDR specifications without any recompilation. The XDR extension is a complete subsystem itself and may be used to communicate with any application using XDR in a heterogeneous distributed environment.
Visual Objects. The design of the visual objects framework is depicted in Figure 9. It identifies two main software layers present in a majority of performance visualization tools (in object-oriented terms): highlevel visual object class and low-level visual object class. A high-level visual object, which is derived from a low-level class implementation, is responsible for the following visualization functions:
27
alternatives
alternatives
method process
method render
HL visual object info structures method init, control and reconfigure methods functions to support the alternatives LL visual object methods that implement graphical primitives method scroll adaptation to display capabilities dynamic adaptation to quantitative changes in rendered information multiple displays
Figure 9. Design of the visual objects framework.
1. Processing of events supplied by the PGRT environment. The events are processed to update high-level, visualization-specific data structures, referred to as info structures, that contain the high-level information to be presented to the user. 2. Rendering of information stored in the info structures using graphical primitives of the inherited lowlevel visual object class implementation. 3. Initializing and on-line re-initializing of the visual object. 4. Optional on-line reconfiguring and/or control of the visual object, as supported in the processing and/or rendering part. Other functions can be added to the processing part, such as storing/retrieving information to/from a database. High-level visual objects may be parameterized to allow several processing and rendering alternatives. High-level classes may be organized in hierarchies given the same public part of the interface. In the asynchronous mode, the contents of the info structures are rendered upon processing of an event; in the synchronous mode, visual objects render their information when triggered periodically by the environment. The parameterization of high-level visual objects combined with the low-level classes’
28
support for multiple displays allow for development of visual objects that provide optimized domain- or application-specific performance visualization through the sharing of the object’s data and code by different visualizations.
5.2 Use of the PGRT Environment with a Distributed, Real-time Video Application The PGRT environment has been used to instrument, analyze, and visualize the performance of a multichannel, multi-rate video multicasting application. The distributed real-time application consists of a video server and a number of video receivers. The video server sends video by striping the frames over multiple channels, which are either multiple TCP/IP multicast channels when the application uses a CSMA/CD network, or multiple virtual channels when using an ATM network. The video receivers execute on heterogeneous platforms, with each platform having dynamic loads generated by unrelated tasks on the platform. Excessive processing loads by unrelated tasks may result in dropping of video frames. The receivers can receive video at different rates, depending on their reception capabilities and on the computing loads. The frame rate, and therefore the video quality, depends on the number of channels received by the receiver. Our goal is to devise an adaptive policy, as a combination of a server-initiated and a receiver-initiated policy, that optimizes the average quality of received video and minimizes the effect of wasted processing time due to the dropping of video frames. The application is instrumented using JEWEL. Each component of the application sends measurement data records (MDRs) to a JEWEL component developed within PGRT-TIE using the JEWEL and XDR extensions. The JEWEL component forwards received MDRs to other components of PG RT, such as visual objects. The processing part of a visual object may analyze and semantically filter a specific real-time behavior of the application, such as the jitter on a channel or a group of channels belonging to a receiver. Jitter in the frame rate affects video quality. The rendering part of the visual object then maps the data to a particular graphical display, for example, frequency spectrums of the channels; a frequency spectrum visualization represents the video frame inter-arrival times and the presence and degree of jitter. Without recompilation, the handling of instrumented data can be changed so that MDRs, possibly preprocessed within PGRT-TIE, are sent to off-the-shelf tools that have been integrated within PGRT-TIE (e.g., MATLAB); alternatively, new visual objects and/or displays can be rapidly prototyped and used. We have found that visualization of instrumented data has been invaluable for developing effective policies for resource management of our distributed real-time video application. Using Scheme in PG RT-TIE lets us
29
generate new visualizations quickly and access existing visualization tools. Work by Malony, Hersey, Hackstadt, and Hansen on a visualization programming system called Viz also uses Scheme to support rapid prototyping and domain-specific environment extensions [10].
6
Conclusion
The PGRT integrated environment includes tools for monitoring, simulation, scheduling, and visualization. The integration framework supports rapid-prototyping of visualizations, extensibility of the environment, and interfaces to COTS tools. The integration capabilities of PGRT are of growing importance to the application of software tools to complex distributed systems. This article has provided a functional overview of software tools for distributed systems for on-line transaction processing and mission-critical control types of applications. A variety of tools are available for use with these systems, but a number of issues have yet to be explored since there is limited experience with the tools. While there is even less user feedback available on integrated tool environments, toolsets have been successfully applied to analyze complex system behavior. The emerging distributed computing platforms and diverse user needs will continue to place high demands on software tool environments.
Acknowledgments We thank several anonymous referees for their helpful suggestions. This work was supported in part by DARPA contract No. DABT 63-95-C-0072, NSF grant No. CDA-9529488, and NSF grant No. ASC-9624149.
References [1]
Belanger, D, Y. Chen, N. Fildes, B. Krishnamurthy, P. Rank, K. Vo, and T. Walker, “Architecture Styles and Services: An Experiment Involving Signal Operations Platforms-Provisioning Operations Systems,” AT&T Technical Journal, January/February 1996, pp. 54–60.
[2]
Bernstein, P. “Middleware: A Model for Distributed System Services,” Comm. of the ACM, 39(2), Feb. 1996, pp. 86-98.
[3]
Butler, R. and Finelli, G., “The Infeasibility of Quantifying the Reliability of Life-Critical RealTime Software,” IEEE Transactions on Software Engineering, 19(1), Jan. 1993, pp. 3-12.
[4]
Clinger, William and Jonathan Rees, editors, Revised (4) Report on the Algorithmic Language Scheme, ACM LISP Pointers IV, July-September 1991.
[5]
Eick, Stephen G. and Daniel E. Fyock, “Visualizing Corporate Data,” AT&T Technical Journal, January/February 1996, pp. 74-85.
[6]
Eigenschink, Todd R., Dave Love, and Aubery Jaffer, “SLIB—the Portable Scheme Library”. Available on-line from http://www-swiss.ai.mit.edu/~jaffer/slib_toc.html, July 1996.
[7]
Giest, G. et al., “PVM 3.0 User’s Guide and Reference Manual,” ORNL/TM-12187, Feb. 1993.
30
[8]
Gu, Weiming, Greg Eisenhauer, Eileen Kraemer, Karsten Schwan, John Stasko, and Jeffrey Vetter, “Falcon: On-line Monitoring and Steering of Large-Scale Parallel Programs,” Technical Report GIT–CC–94–21, Georgia Institute of Technology, 1994.
[9]
Harrison, R., L. Zitzman, G. Yoritomo, “High Performance Distributed Computing Program (HiPerD)—Engineering Testbed One (T1) Report,” Technical Report, Naval Surface Warfare Center, Dahlgren, Virginia, Nov. 1995.
[10] Hersey, H., S. Hackstadt, L. Hansen, and A. Malony, “Viz: A Visualization Programming System,” Technical Report CIS-TR-96-05, University of Oregon, April 1996. [11] Jaffer, Aubrey, “SCM, a Scheme Interpreter”. Available on-line from http://www-swiss.ai.mit.edu/ ~jaffer/SCM.html, July 1996. [12] Lange, F., R. Kroger, M. Gergeleit, “JEWEL: Design and Implementation of a Distributed Measurement System,” IEEE Trans. on Parallel and Distributed Systems, 3(6), Nov. 1992, pp. 657-671. [13] Libes, Don, Exploring Expect, O’Reilly & Associates, 1994. [14] Lord, Thomas, “An Anatomy of Guile—the Interface to Tcl/Tk,” Usenix Tcl/Tk Workshop ‘95, 1995. More information available on-line from http://www-swiss.ai.mit.edu/~jaffer/guile_toc.html. [15] Malony, A., B. Mohr, P. Beckman, and D. Gannon, “Program Analysis and Tuning Tools for a Parallel Object Oriented Language: An Experiment with the TAU System,” in Debugging and Performance Tuning for Parallel Computing Systems, edited by M. Simmons, A. Hayes, J. Brown, and D. Reed, IEEE Computer Society Press, May 1996. [16] Miller, Bart and Charlie McDowell, editors, Proceedings of 3rd ACM/ONR Workshop on Parallel and Distributed Debugging, ACM SIGPLAN, May 1993. [17] Niehaus, Douglas, John A. Stankovic, and Krithi Ramamritham, “A Real-Time System Description Language,” Proc. of Real-Time Technology and Applications Symposium, IEEE, 1995, pp. 104-115. [18] Pancake, Cherri M. “The Emperor Has No Clothes: What HPC Users Need to Say and HPC Vendors Need to Hear,”, Supercomputing ‘95, invited talk, Dec. 1995. [19] Rover, Diane T., “Performance Evaluation: Integrating Techniques and Tools into Environments and Frameworks,” Proc. of Supercomputing ‘94, IEEE Computer Society Press, 1994, pp. 277-278. [20] Rover, Diane T., Allen D. Malony, and Gary J. Nutt, “Summary of Working Group on Integrated Environments Vs. Toolkits,” in Debugging and Performance Tuning for Parallel Computing Systems, edited by M. Simmons, A. Hayes, J. Brown, and D. Reed, IEEE Computer Society Press, May 1996. [21] Simmons, M., A. Hayes, J. Brown, and D. Reed, editors, Debugging and Performance Tuning for Parallel Computing Systems, IEEE Computer Society Press, May 1996. [22] Stoyenko, Alexander D., Phillip A. Laplante, Robert Harrison, and Thomas J. Marlowe, “Doubling the Engineer’s Utility,” IEEE Spectrum, 31(12), December 1994, pp. 32–39. [23] Waheed, A. and Diane T. Rover, “A Structured Approach to Instrumentation System Development and Evaluation,” Proc. of Supercomputing ‘95, IEEE Computer Society Press, 1995 (CD-ROM). [24] Welch, Brent, Practical Programming in Tcl and Tk, Prentice Hall, 1995. [25] Welch, Lonnie R., Michael W. Masters, and Robert D. Harrison, “Toward a 21st Century Shipboard Computing Infrastructure,” Technical Report, Naval Surface Warfare Center, Dahlgren, Virginia, Jan. 1996. [26] Yan, J., S. Sarukkai, and P. Mehra, “Performance Measurement, Visualization, and Modeling of Parallel and Distributed Programs using the AIMS Toolkit,” Software–Practice and Experience, 25(4), April 1995, pp. 429-461. 31