Faculty of Information Technology, University of Technology, Sydney, ... In stock market and other finance fields, Genetic Algorithm has been applied in.
The Applications of Genetic Algorithms in Stock Market Data Mining Optimisation Li Lin, Longbing Cao, Jiaqi Wang, Chengqi Zhang Faculty of Information Technology, University of Technology, Sydney, NSW 2007, Australia Capital Market CRC, Sydney NSW 2000, Australia
Abstract In stock market, a technical trading rule is a popular tool for analysts and users to do their research and decide to buy or sell their shares. The key issue for the success of a trading rule is the selection of values for all parameters and their combinations. However, the range of parameters can vary in a large domain, so it is difficult for users to find the best parameter combination. In this paper, we present the Genetic Algorithm (GA) to overcome the problem in two steps. First, setting a sub-domain of the parameters with GA. Second, finding a near optimal value in the sub domain with GA in a very reasonable time. Keywords: Technical trading rule; Genetic Algorithm; sub-domain; Parameter combination;
1
Introduction
In stock market and other finance fields, Genetic Algorithm has been applied in many problems [1]. There have been a number of attempts to use GA for acquiring technical trading rules, both for Foreign Exchange Trading [2][3] and for S&P500 market. One application is how to find the best combination values of each parameter. We know that in a trading rule there are many parameters, when we try to find the most profit, we must test the parameter combination one by one, which is called greedy algorithm which costs a lot of running time and memory. Through analysing the stock market, we know there are some combinations of the parameters, which can produce a near-max profit and give some reasonable
buy/sell suggestions. So our objective in this paper is to find one of these nearmax profit combinations efficiently. In this paper, we decide the sub-domain of each parameter with GA firstly, after that, in each sub-domain, we can find a near optimal combination for each stock historical data.
2
Back grounds
To conduct our research, we first need to specify an appropriate universe of trading rules from which the current GA may have been applied to. In stock market, when the brokers or dealers want to buy or sell a share, some of them will depend on a technical trading rule. Robert Edwards and John Magee[5] defined Technical trading rules as “the science of recording the actual history of trading (price changes, volume of transactions, etc.) in a certain stock or in “the Averages” and then deducing from that pictured history the probable future trend.” Since the last century, there have been a lot of rules, such as: Filter Rules, Moving Average, Support & Resistance, Abnormal Return, etc [5]. In this paper, we just used Filter rules with GA as an example. The other rules will be tested in the future. 2.1 Filter Rules Filter rules were used in Alexander (1961) and explained by Fama and Blume (1966). An x percent filter is defined as follows: Definition 1 (Filter rules): If the daily closing price of a particular security moves up at least x percent, buy and hold the security until its price moves down at least x percent from a subsequent high, at which time simultaneously sell and go short. The short position is maintained until the daily closing price raises at least x percent above a subsequent low at which time one covers and buys. Moves less than x percent in either direction are ignored. The domain of x is a real number between 0 and 1. At the same time, we also considered the follow integer parameters, whose domains are between 1 and 30 in our system except the previous day p is between 30 and 100. Hold Day h: After we get a buy/sell signal, in the next h hold days we do not produce any other signals even it meet some conditions. Delay Day d: It means when the price meets an occurring signal condition, we also test after d days whether it still meets, if yes, we produce a signal, else ignore this one. This idea can erase the noisy disturbance. Previous Day p: When computing the subsequent highs/lows, we just consider the previous p-day price. I.e. we discard the price over p days before the time point we may produce a signal. There are four parameters in this trading rule, many users concern how to find the best combination of these parameters in order to make the profit mostly for this rule.
2.2 Genetic Algorithm Genetic Algorithm is a heuristic function for optimization, where the extreme of the function (i.e., minimal or maximal) cannot be established analytically. A population of potential solutions is refined iteratively by employing a strategy inspired by Darwinist evolution or natural selection. Genetic Algorithms promote “ survival of the fittest” . This type of heuristic has been applied in many different fields, including construction of neural networks and finance. We represented the parameters of a trading rule with a one-dimension vector that is called “ chromosome” , each element is called a “ gene” , and all of the “ chromosomes” are called “ population” . Here, each gene stands for a parameter value; each chromosome is the set of parameters of one trading rule. Generally, genetic operations include: “ crossover” , “ mutation” and “ selection” . “Crossover” operator. Suppose S1={s11, s12, … , s1n}, S2={s21, s22, … , s2n}, are two chromosomes, select a random integer number 0 r n, S3, S4 are offspring of crossover(S1, S2), S3={si | if i r, si S1, else si S2}, S4={si | if i r, si S2, else si S1}. “Mutation” operator. Suppose a chromosome S1={s11, s12, … , s1n}, select a random integer number 0 r n, S3 is a mutation of S1, S3={si | if i r, then si=s1i, else si =random(s1i)}. “Selection” operator. Suppose there are m individuals, we select [m/2] individuals but erase the others, the ones we selected are “ more fitness” that means their profits are greater. Genetic Algorithm. 1. InitializePopulation: Producing a number of individuals randomly, each individual is a chromosome which is an n-length array, n is the number of parameters. 2. Test if one of the stopping criteria (running time, fitness, generations, etc) holds. If yes, stop the genetic procedure. 3. Selection: Select the better chromosomes. It means the profit under these parameters is greater. 4. Applying the genetic operators: such as “ crossover” and “ mutation” to the selected parents to generate an offspring. 5. Recombine the offspring and current population to form a new population with “ selection” operator. 6. Repeat steps 2-5.
P InitializePopulation(); While (not stop (P)) do SelectParents(P); Parents[1..2] Offspring[1] Crossover(Parents[1]); Offspring[2] Mutation(Parents[2]); Selection(P, Parents[1..2], Offspring [1..2]); P Endwhile.
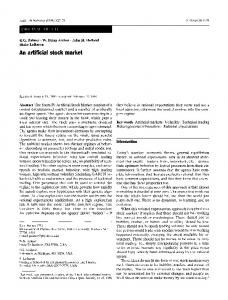
������
Figure 1.
3
The Genetic Algorithm.
Generation of signals
3.1 Find a sub-domain If we compute the combination of every parameter in its domain, it costs almost 10 hours for only one share, but most of the value combinations are useless. So, we can use GA to decide a sub-domain that is a sub set of the domain firstly. After we get the sub domain, we just compute in the sub domain in the next step. It can improve the efficiency both in running time and memory although it may lose a little precision. And, for an expert, he/she can select the value in the sub domain to improve the efficiency. Algorithm 1. Finding a sub domain. Step 1. Generate a population of parameters value; Step 2. Find the better ones and keep them; Step 3. Use GA operators to generate a new generation; and Step 4. Repeat the step 2 and 3 until it meets some stop criterions, such as running time, the number of generation or precision meet our definition, etc. Step 5. The minimum domain is regarded as the sub-domain. Algorithm stop. 3.2 Find a near optimal combination After we found the sub domain, sometimes we need to get only one value for our decision. Even from a sub domain, we may spend 30 minutes to compute the most profit value with greedy algorithm, and so we need to reduce the running time. One practical method is with GA. Algorithm 2. Finding a near-optimal value. Step 1. Generate a population; Step 2. Find the better half values and keep them; Step 3. Use GA operators to generate a new generation; and Step 4. Repeat the step 2 and 3 until it meets some stop criterion, such as running time, the number of generations or precision meets our definition, etc. Step 5. The last combination is the result. Algorithm stop.
4
Performance evaluations
We have tested some stocks of Australia Stock Exchange (ASX). The results are shown in the figure 2 to 5. The Greedy algorithm will cost 10 hours to get the most profit combination, but, GA only costs less 10 seconds to get the nearly value. So it makes the real time analysis possible.
Figure 2.
The parameters of the Filter rule we got with GA. (The stock is selected from ASX, the trading date is from 2 January 1998 to 20 February 2001.)
Figure 3.
We use GA to get the trading signal of Filter rule. ({-stands for buy signal, -stands for sell signal.)
The stock is selected from ASX, the red line is the actual trading price. The trading date is from 2 January 1998 to 20 February 1999. The parameters are shown in Figure 2. This graph is shown in Fish-eye technology, the rectangle window is a fish eye, which can be moved by the slice bar under the window. We also divided the data into two parts: training data and test data. Here, the training data is one year, and the test data is one month after the training data. The result is shown in figure 4.
15 13 11 9 7 5 3 1 -1 -3 -5
1
2
3
4
5
6
7
8
9
10 11 12
Month GA profit Figure 4.
Manually profit
The comparison of profit, the share is selected from ASX, training data is from 19980101 to 19991231, test data is one month length from January to December of 1999.
1800 1600 1400 running time(s)
Dollar
Comparsion of Profit
1200 1000 800 600 400 200 0 stock Greedy
Figure 5.
GA
GA and Greedy algorithms running time comparison.
5 4 3
profit($)
2 1 0 -1 -2 -3 -4 -5
Manually
Figure 6.
5
GA
Greedy
GA, Greedy algorithms and manually selected profit comparison.
Results and Conclusions
The comparison is shown in Figure 4 and 5. (The stock is selected from ASX 1992-2002, Capital Market CRC, Laptop DELL D600 computer, 128M main memory, Windows 2000 system, Borland C++ Builder 6.0) From the figures, we can see that GA loses very little precision but save a lot of running time. So, it can be used in a real analysis system, and the result is similar to the best one. It can also be used as a basic tool for other application, such as: ranking trading rules. Our future work is to design the crossover and mutation probabilities, so that we can make the algorithm more efficiently and effectively. Genetic Algorithm is also used in the other finance fields [4], for example, to find a new technical trading rule. In this paper, we used GA to find the better parameter value combination in an existed trading rule.
Acknowledgments The authors would like to thank Capital Market Cooperated Research Centre [11], AC3 [12], and SIRCA [13] for funding this project and providing large realistic data of ASX for this research. All supports and feedbacks from financial
Prof. Mike Aitken in UNSW, Prof. Alex Frino in Sydney Uni. Australia and others are much appreciated.
References [1] Chen, S. H. Genetic Algorithms and Genetic Programming in Computational Finance. Boston, MA: Kluwer. 2002 [2] Neely, C., Weller, P. & Dittmar, R. Is Technical Analysis in the Foreign Exchange Market Profitable? A Genetic Programming Approach. Journal of Financial and Quantitative Analysis. 32:405-26. 1997 [3] Thomas, J. & Sycara, K. The Importance of Simplicity and Validation in Genetic Programming for Data Mining in Financial Data. Proceedings of the Joint AAAI-1999 and GECCO-1999 Workshop on Data Mining with Evolutionary Algorithms. 1999. [4] Allen, F. & Karjalainen, R. Using Genetic Algorithms to Find Technical Trading Rules. Journal of Financial Economics. 51:245-271. Studies 27:221-334. 1999 [5] Robert Edwards, John Magee. Technical analysis of stock trends. seventh edition, page 4. 1997. [6] Ryan Sullivan, Allan Timmermann, Halbert White. Data-snooping, Technical Trading Rule Performance, and the Bootstrap. The Journal of Financial, 54, (5):1647-1692. 1999 [7] M. Mitchell. An Introduction to Genetic Algorithms. MIT press, Cambridge, USA. 1996 [8] D. Whitley. An Overview of Evolutionary Algorithm: Practical Issues and Common Pitfalls. Information and Software Technology. 43: 817~831. 2001 [9] M.K.P. So, K. Lam and W.K. Li. Forecasting exchange rate volatility using autoregressive random variance model. Applied Financial Economics, 9, pp. 583-591. 1999 [10] K. Lam and K.C. Lam. Forecasting for the generation of trading signals in financial markets. Journal of Forecasting, 19, pp. 39-52. 2000 [11] http: // www.cmcrc.com [12] http: // www.ac3.com.au [13] http: // www.sirca.org.au [14] http://www-staff.it.uts.edu.au/~linli/download/ [15] http://datamining.it.uts.edu.au:8080/tsap