THE ASSIMILATION OF SOFTWARE PROCESS INNOVATIONS: AN ORGANIZATIONAL LEARNING PERSPECTIVE
Robert G. Fichman MIT Sloan School of Management 50 Memorial Drive, E53-314 Cambridge, MA 02139 Ph: 617-253-6629 Fax: 617-258-5759 Email:
[email protected]
Chris F. Kemerer Katz Graduate School of Business University of Pittsburgh 278a Mervis Hall Pittsburgh, PA 15260 Ph: 412-648-1572 Fax: 412-624-2983 Email:
[email protected]
Forthcoming in Management Science.
THE ASSIMILATION OF SOFTWARE PROCESS INNOVATIONS:
AN
ORGANIZATIONAL LEARNING PERSPECTIVE
Abstract: The burden of organizational learning surrounding software process innovations (SPIs)—and complex organizational technologies in general—creates a "knowledge barrier" that inhibits diffusion. Paul Attewell has suggested that many organizations will defer adoption until knowledge barriers have been sufficiently lowered; however, this leaves open the question of which organizations should be more likely to innovate, even in face of high knowledge barriers. It is proposed here that organizations will innovate in the presence of knowledge barriers when the burden of organizational learning is effectively lower, either because much of the required know-how already exists within the organization, or because such knowledge can be acquired more easily or more economically. Specifically, it is hypothesized that organizations will have a greater propensity to initiate and sustain the assimilation SPIs when they have a greater scale of activities over which learning costs can be spread (learning-related scale), more extensive existing knowledge related to the focal innovation (related knowledge), and a greater diversity of technical knowledge and activities (diversity). An empirical study using data on the assimilation of object oriented programming languages (OOPLs) by 608 US business sites strongly confirmed the importance of the three hypothesized factors in explaining the assimilation of OOPLs. (Keywords: Software Process Innovation; Adoption; Assimilation; Organizational Learning; Object Oriented Programming, Disk-Based Survey)
ACKNOWLEDGMENTS BOX TO GO HERE
1.
INTRODUCTION
This research seeks to explain differences in the propensity of firms to initiate and sustain the assimilation of complex process technologies. This work starts from the assumption that the assimilation of complex technologies is best characterized as a process of organizational learning, wherein individuals and the organization as a whole acquire the knowledge and skills necessary to effectively apply the technology (Attewell 1992). According to Attewell's framework, the burden of organizational learning surrounding complex technologies creates a "knowledge barrier" that inhibits diffusion. As a result, supply-side and mediating institutions must work to actively encourage diffusion by developing mechanisms that lower knowledge barriers over time. However, while Attewell's model suggests that many organizations will defer adoption until knowledge barriers have been sufficiently lowered, it says little about which organizations should be among the early adopters, even in face of high knowledge barriers. This research proposes that organizations will have a greater propensity to successfully innovate with complex technologies when the burden of organizational learning is effectively lower, either because the organizations already possess much of the know-how and technical knowledge necessary to innovate, or because they can acquire such knowledge more easily or more economically. Specifically, it is hypothesized that Information Technology (IT) organizations will be more likely to initiate and sustain the assimilation of SPIs when they have a greater scale of activities over which learning costs can be spread (learning-related scale), more extensive existing knowledge in areas related to the focal innovation (related knowledge), and a greater diversity of technical knowledge and activities in general (diversity). An empirical study is presented using data on the assimilation of object oriented programming languages (OOPLs) by the IT departments of 608 medium to large US firms. Following Meyer and Goes, assimilation is defined as the process spanning from an organization's first awareness of an innovation to, potentially, acquisition and widespread deployment (1988). OOPLs are a recent, and prominent, instance of a broader class of innovations termed here software process innovations (SPIs). From the perspective of IT departments, these technologies are process innovations because their deployment results in a change to the organizational process used to develop software applications. As will argued shortly, SPIs in general, and OOPLs in particular, appear to be exemplars of technologies subject to knowledge barriers, and therefore constitute an ideal setting for testing the proposed organizational learning-based model of complex technology assimilation. The ultimate goal of this research is to help both potential adopters and suppliers become more effective innovators. Potential adopters need guidance in the complex process of evaluating SPIs and in formulating an appropriate assimilation strategy.
Suppliers need tools to assist them in identifying likely early adopters,
understanding the special challenges these adopters face, and constructing deployment strategies that sustain diffusion of technologies over the mass market of later adopters. This research identifies the profile of an early and sustained SPI assimilator. For vendors, this profile provides a basis for more targeted marketing and promotion. For potential adopters, it supports a critical self evaluation: organizations that fit the profile should, in general, be more aggressive adopters of new technology, and should exploit adoption strategies enabled by their distinctive
characteristics.
Those that do not fit the profile should consider delaying adoption, or choosing a simpler
technology variant. For researchers, these results support and extend Attewell's reconceptualization of diffusion theory for the case of complex organizational technologies. The remainder of this article is organized as follows. Section 2 develops the theoretical basis for this work using research in organizational learning. Section 3 provides a brief overview of SPIs, and in particular, OOPLs. Section 4 describes the theoretical model and related measures. Sections 5 and 6 present the study design and empirical results, respectively. Section 7 provides a general discussion of study results, and finally, Section 8 summarizes major results and conclusions. 2.
ORGANIZATIONAL LEARNING AND INNOVATION DIFFUSION THEORY
The theoretical starting point for this research is Attewell's recent work linking organizational learning and innovation diffusion (1992). In this work, Attewell provides a reconceptualization of innovation diffusion theory for what he calls "complex organizational technologies," i.e., technologies that, when first introduced, impose a substantial burden on would-be adopters in terms of the knowledge needed to use them effectively.
Such
technologies typically have an abstract and demanding scientific base; tend to be "fragile" in the sense that they don't always operate as expected; are difficult to trial in a meaningful way; and are "unpackaged" in the sense that adopters cannot treat the technology as a "black box" (Eveland and Tornatzky 1990). SPIs have been argued to be exemplars of such technologies (Fichman and Kemerer 1993). Attewell argues that in the case of complex organizational technologies, innovation diffusion is most appropriately characterized as a process driven by institutional mechanisms for lowering knowledge barriers over time. Any theory of innovation incorporates, in some fashion, communication of new information about innovations, and hence, learning by potential adopters. What distinguishes Attewell's approach is his explication of the kinds of learning involved, and the mechanisms by which information is acquired and propagated. Attewell draws a central distinction between the communication of "signalling" information about the existence and potential gains from using the innovation, versus know-how and technical knowledge. Classical diffusion theories implicitly focus on signalling information, and assume that a prominent factor explaining differences in innovativeness is differences in the time it takes this information to reach potential adopters. Attewell argues, however, that acquiring technical knowledge and know-how places far greater demands on potential adopters, and as a result ". . . it plays a more important role in patterning the diffusion process of complex technologies than does signalling . . . [and] should move to center stage in any theory of complex technology diffusion" (1992, p. 5).
-2-
Attewell places organizational learning at the center of his theory by focusing on mechanisms that lower the burden of organizational learning surrounding adoption.1 These mechanisms include: mediating institutions that specialize in acquiring and propagating knowledge (such as consulting and service firms); special buyer-supplier relationships structured around learning (such as user groups); adoption by end-users as a service; and technology simplification. Attewell's model suggests that many organizations will defer adoption until knowledge barriers are sufficiently lowered. However, this leaves open the important question of which end-user organizations can be expected to be among the early adopters, even in face of high knowledge barriers. It is proposed here that organizations with a higher propensity to innovate with complex technologies will be those for which organizational learning is relatively less burdensome, because: 1) they can better amortize the costs of learning, 2) they can acquire any given amount of new knowledge with less effort, or 3) they have less to learn overall. Organizations may be viewed, at any given moment, as possessing some bundle of knowledge and skills related to their current operational and managerial processes (Nelson and Winter 1982). In order to successfully assimilate a new process technology, an organization must somehow reach a state where its bundle of knowledge and skills encompasses those needed to use to the new technology effectively. Thus, an organizational may be seen as having to travel some metaphorical distance to get from the current bundle to the needed bundle (Pennings and Harianto 1992 When complex organizational technologies are first introduced, this distance is likely to be considerable for most organizations. In the case of software process innovations, for example, successful assimilation requires learning on a number of fronts, including grasping the abstract principles on which the technology is based; understanding the nature of the benefits attributable to the technology; grasping specific technical features of different commercially available instances of the technology; discerning the kinds of problems to which the technology is best applied; acquiring individual skills and knowledge needed produce a sound technical product on particular development projects; and designing appropriate organizational changes in terms of the team structure, hiring, training, and incentives. It is hard to overstate how difficult and expensive this learning process can be. Huff estimated that the 5-year cost of computer aided software engineering (CASE) tool adoption to be $35,000 per user, with the majority of this cost attributable to such learning-related activities as technology evaluation, consultants, installing a methods support group, and training (1992). And, these estimates do not include the potentially
1Although
Attewell most directly articulates the specific link between learning and innovation diffusion, concepts
from organizational learning are increasingly being used as a lens for examining questions related to the management of technology and innovation in general (Leonard-Barton 1989; Argote et al. 1990; Cohen and Levinthal 1990). For a general review of the organizational learning literature, see Huber 1991).
-3-
substantial costs of experiential learning required to reach the point on the learning curve where performance is comparable to pre-existing technologies (Kemerer 1992). What kinds of organizations should be better able to afford the likely considerable costs of organizational learning surrounding new technologies? Attewell's description of consulting and service firms provides a clue. He notes that these organizations, by applying what they learn about new technologies in multiple client settings, are able to capture "economies of scale in learning." This suggests a closely related idea, that of learning-related scale, defined here as the scale of activities over which learning costs can be spread.
Organizations with greater
learning-related scale have a greater opportunity to capture economies of scale in learning, although this opportunity may or may not be exercised in any given instance. Learning-related scale should have a more pronounced effect on the assimilation of technologies that have high knowledge barriers because learning costs— including evaluations, trials, pilot projects, training, learning-by-doing, developing infrastructure—are likely to swamp the out-of-pocket costs of purchased products in most cases. Organizations should be more likely to innovate when they can better afford any given level of costs associated with the journey from their current bundle to the needed bundle of skills. They should also be more prone to innovate when they can cover the distance between their current bundle to the needed bundle with less effort, and hence, less cost. Cohen and Levinthal develop the idea that a firm's ability to appreciate an innovation, to assimilate it, and apply it to new ends—what they term its "absorptive capacity"—is largely a result of the firm's pre-existing knowledge in areas related to the focal innovation, and its diversity of knowledge in general (1990). Prior related knowledge makes it easier for individuals to acquire and retain new knowledge because it gives individuals rich, well-organized mental schemas into which new knowledge can be placed, and allows the associative connections needed for insights related to the new knowledge. Ease of organizational learning follows from ease of individual learning, because while it has been argued that individual learning is not always sufficient for organizational learning,2 it is certainly necessary. Cohen and Levinthal argue that diversity of knowledge also facilitates learning, and thus contributes to absorptive capacity, because when there is uncertainty about the domains from which potentially useful information may emerge, a diverse knowledge base increases the likelihood that new information will be related to what is already known. They also argue that diversity of knowledge enables individuals to make novel associations and linkages involving the focal innovation; this is especially important because process technologies typically require "reinvention" (Rice and Rogers 1980) as part of the assimilation process. In addition to promoting absorptive capacity, which makes it easier and less costly to cover any given distance, related knowledge also effectively diminishes the distance a firm must travel to get from its current bundle of skills
2Attewell
argues, for example, that individual learning becomes organizational learning only insofar as it becomes
embodied in organizational routines and practices (1992).
-4-
to the needed bundle because some of the burden of knowledge acquisition is eliminated. CASE tools provide a good example: organizations that already have a methodology in place prior to implementing a CASE tool that supports it generally do much better than organizations that have to learn the tool and underlying methodology at the same time (Kemerer 1992). To summarize: 1) Learning-related scale allows better amortization of learning related costs; 2) Related knowledge and diversity work together to make it easier for organizations to learn, i.e., they lower learning costs for any given amount of knowledge to be acquired; 3) Related knowledge has an additional benefit of lowering the total quantity of required learning. It is therefore proposed that organizations with greater learning-related scale, related knowledge, and diversity are more likely to initiate and sustain the assimilation of complex technologies. 3.
OBJECT ORIENTED PROGRAMMING: A SOFTWARE PROCESS INNOVATION
Over the past two decades, an impressive array of software process technologies have been invented. Relational databases, fourth-generation languages, CASE tools, and object technologies are just a few of the major innovations in software process technology to be commercialized since 1980. These technologies are termed software process innovations (SPIs) because, when acquired and deployed, they change an IT group's process for developing software applications. While many SPIs have become available, current evidence suggests that IT departments face substantial challenges in adopting and deploying them. The risk of adoption failure is high, and the possibility of ending up committed to a "stranded" technology creates an additional peril. Relatedly, SPIs typically diffuse across the IT industry more slowly than proponents originally expected—or might have been desirable given the potential these technologies hold to improve software development (Howard and Rai 1993). This pattern appears to be continuing in the case of object-oriented programming languages (Slitz and Mintz 1993). OOPLs, the focal technology for this study, are a family of programming languages designed to facilitate the development of software systems that conform to object-oriented principles. While these languages have been developing in the academic community and R&D laboratories for over 25 years, commercially viable products have been available to internal applications development groups only since the mid to late 1980's. Most prominent among these is the C++ language, first developed in the early 1980's by Bjarne Stroustrup of AT&T Bell Laboratories, and Smalltalk, first developed in the 1970's at Xerox Parc. Object oriented principles—most notably encapsulation and inheritance—are thought to promote such long standing software engineering goals as abstraction, modularity, reuse, maintainability, extensibility, and interoperability (Booch 1994). In a more extreme view, it has been suggested that object technology has the
-5-
potential to bring about an "industrial revolution" in the way software is constructed, by transforming the current custom development process into one characterized by assembly of previously developed components (Cox 1990). Nevertheless, OOPLs are widely viewed as being particularly difficult to adopt and assimilate, chiefly because of the radical changes they impose on would-be adopters (Fichman and Kemerer 1992; Booch 1994). As one recent commentator recently put it: "object oriented technology is so radically different that we must break and reset programmers' coding hands before they can write object oriented rather than procedural programs" (Lewis 1994). A set of four mini case studies of OOPL adoption conducted by the authors confirmed the radical nature of the changes imposed by adoption, and identified several other challenges as well, including: difficulties in locating experienced staff and/or retraining existing staff; the cost of developing necessary infrastructure; machine performance problems; and an absence of complementary tools (Fichman 1995 Appendix A). 4.
MODEL AND MEASURES
One of the more persistent criticisms of prior research examining the determinants of organizational innovation has been the absence of strong and consistent findings Downs and Mohr 1976; Rogers 1983; Meyer and Goes 1988; Prescott and Conger 1995). Although a recent meta-analysis suggests that some these criticisms may have been overstated (Damanpour 1991), it is nevertheless true that studies with strong results have been comparatively rare, especially when the focal innovation has been information technology (Fichman 1992). One of the more plausible explanations for a lack of strong and consistent results is that researchers, in pursuing the worthy goal of establishing a more general theory of innovation diffusion, may have been working at a theoretical level too far abstracted from particular innovations and contexts (Downs and Mohr 1976) An alternative approach—the one advocated here—is to develop theories focusing on the distinctive qualities of particular kinds of technologies. In particular, it is argued that in the case of complex organizational technologies such as SPIs, a greater propensity to initiate and sustain assimilation will be associated with greater scale of activities over which learning costs can be spread (learning-related scale), more extensive existing knowledge in areas related to the focal innovation (related knowledge), and a greater diversity of technical knowledge and activities in general (diversity). (See Figure 1.) The dependent variable for this research is assimilation stage achieved by a certain date (Meyer and Goes 1988) Assimilation stage is viewed as a more robust measure of organizational innovativeness than traditional measures such as earliness of adoption or dichotomous adoption (Meyer and Goes 1988; Fichman 1995
-6-
Control variables Learningrelated scale
Related
Assimilation
knowledge
stage
Diversity
Figure 1. Conceptual Model
4.1
Learning-Related Scale
Learning-related scale is the scale of activities over which learning costs can be spread. Just as consulting firms typically have a greater opportunity to recoup learning costs because of their base of potential clients, traditional IT departments possess similar opportunities to the extent that they engage in a steady stream of development of new applications on behalf of internal clients. Organizations that possess greater learning-related scale should be more likely, others things being equal, to initiate and sustain innovative activities because decision makers are more likely to recognize, either explicitly or implicitly, the opportunity for quicker and more assured pay-back of the substantial required investments in learning. Such organizations should also be more likely to engage in learning tactics that improve chances of success—but may entail high fixed costs (e.g., development of infrastructure)—because of the opportunity to recover those costs over a broader scale of subsequent activities. To operationalize the learning-related scale concept, two indicators were used. The first measured the effective size of the staff devoted to developing completely new applications, while the second measured the effective size of the staff devoted to new applications together with significant enhancements to existing systems (see Appendix A). While, in principle, many organizations could eventually amortize SPI-related learning costs, those with a greater volume of new applications development can amortize costs more quickly. This is particularly important because: 1) faster amortization improves return on investment; 2) managers often have little patience with investments that do not show a rapid payback; 3) intensity of effort is crucial to effective learning, yet little cumulative learning will occur if application of the new technology is infrequent (Argote et al. 1990); and 4) if a firm does not move along the internal learning curve quickly enough, then its process will be surpassed by the external learning curve (i.e.,
-7-
the firm could have established an efficient process faster by waiting for more mature technology vintages to become available).
4.2
Related Knowledge
Related knowledge is the extent of abstract knowledge, know-how and skills possessed by the organization in areas related to the focal innovation. Related knowledge facilitates assimilation by making it easier for organizations to acquire new knowledge (Cohen and Levinthal 1990), and by decreasing the total quantity of knowledge that must be acquired (Pennings and Harianto 1992). It seems appropriate to consider what is encompassed by related knowledge in the case of SPIs. As previously mentioned, successful assimilation of an SPI requires that an organization reach the point where it possesses an associated bundle of knowledge and skills. This bundle includes at least three components. The first is knowledge of the abstract principles on which the innovation is based and the skills necessary to successfully apply those principles. For OOPLs, these principles include encapsulation, inheritance and message passing. The second component is expertise in specific technology products embodying the focal innovation, i.e., a particular OOP language, CASE tool, etc. The third component is expertise in technologies that typically form a "cluster" around the focal innovation. With the notable exception of early artificial intelligence languages—which were often implemented on standalone, propriety systems—SPIs tend to integrated with, and implemented on top of, existing technologies. Pre-existing knowledge and skills in these technologies can be seen as being part of the knowledge base for the focal innovation. Related knowledge, then, includes knowledge of associated abstract principles, expertise in the technologies directly embodying the innovation, and expertise in the technologies that cluster around the focal innovation. The approach to measurement employed here focuses primarily on the last category of related knowledge, although in doing so, some elements of the first category are also captured. Specifically, this study operationalized related knowledge as the extent of development staff experience in four areas: 1) C language programming, 2) client-server application development, 3) PC/workstation-based applications development, and 4) development of graphical user interfaces (GUIs) (see Appendix A). These four areas were identified based on discussions with OOP experts and observations made during the previously mentioned minicase studies of OOPL adopters. Unlike the other predictor variables in this study, measures for related knowledge will always be SPI-specific. The C language is a central part of the cluster of technologies surrounding commercially available OOPLs. C++, a C language hybrid, had been acquired by 94% of respondents in this study that had acquired any OOPL. An organization with more extensive prior experience with C who adopts C++ (or another hybrid such as Objective C) is already proficient in the sizable subset of the language that is common to C, and already possesses expertise in common supporting technologies, such as operating systems and utilities. A study conducted by IBM provides
-8-
strong empirical confirmation of the link between C programming experience and proficiency in learning objectoriented programming (Liu et al. 1992). The link between OOPLs and client-server arises from the fact that the most common architecture for an OOPLbased multi-user application is client-server, with the OOPL resident on the PC or workstation-based client. At present, few mature OOPL implementations exist on larger computers (mini or mainframes), and no other commonly used architecture supports both the use of an OOPL and multi-user access to data. Individuals and organization with prior experience in client-server are spared the burden of acquiring this expertise during the course of adopting an OOPL. Another advantage of client-server expertise is that the message passing paradigm for inter-module communication in client-server applications is also used in object-oriented applications, thus providing potential adopters with experience related to this important object-oriented principle. The relationship from OOPLs to expertise with PCs and workstations reflects the fact that to date, commercially available OOPLs, including C++ and Smalltalk, have been implemented almost exclusively on PC and workstation platforms. Would-be adopters who have expertise in PC or workstation-based development already possess skills in the use of the operating systems, windowing shells, utilities and so forth comprising these environments, and so are spared the burden of acquiring this knowledge in order to adopt an OOPL. The linkage between OOP and development of graphical user interfaces (GUI) stretches back to the 1970's, where Xerox PARC pioneered the GUI concept in applications built using Smalltalk.
In the present day, OOPL
applications typically include a GUI. This was true for all four case studies of OOPL adopters conducted by the authors. There is also at least some overlap in terms of abstract principles and associated skills, because like OOPL applications, GUIs are event-driven and involve manipulation of objects (e.g., screen icons). To summarize, the C language, client-server, PC/Workstation-based development, and GUIs are all part of the OOPL technology "cluster," and additionally, overlap in terms of some specific OOP concepts and skills.
4.3
Diversity of Knowledge and Activities
Diversity is defined as the degree of heterogeneity of organizational knowledge and activities in areas related to applications development. It is worth noting that in actual practice, diversity of knowledge and diversity of activities are likely to be inextricably linked, because the knowledge contained within an organization is largely a result of its past history of activities (Nelson and Winter 1982). Diversity of knowledge is a primary contributor to "absorptive capacity," which, in turn, facilitates innovation. Rationales linking diversity of activities to innovation have also been proposed. Swanson argues that diversity of activities increases the likelihood that an organization will have at least one domain that is sufficiently "innovation ready"—due to resources of the receiving area, or compatibility of the innovation with the receiving area—for the innovation to be introduced to the organization (1994). In addition, in the presence of learning-by-using or other
-9-
forms of intra-company increasing returns to adoption (Gurbaxani 1990), diversity of activities contributes to an environment where innovation can more easily be sustained, essentially because the organization can bootstrap from areas with a high fit to those with lower ones (Markus 1987; Christensen 1994). In summary, diversity in areas related to applications development contributes to organizational learning surrounding SPIs by making it easier for individuals to appreciate and absorb new information that is encountered; by increasing the likelihood that at least one domain will exist that represents a good fit with the SPI; and by providing an opportunity to bootstrap, as the organization become more proficient with the SPI, from higher fit areas to areas with a lower fit. To capture diversity of technical knowledge and activities related to applications development, this research employed three indicators: 1) diversity of programming languages 2) diversity of runtime platforms, 3) diversity of application architectures (see Appendix A). Collectively, these three indicators capture much of the potential technical diversity in a typical applications development organization. Five programming language categories (assembly language, Cobol, etc.), were selected to provide a parsimonious set of the most prominent languages typically in use in IT departments.
Likewise, seven runtime platforms (centralized mainframe, centralized
midrange, etc.) were used to provide a parsimonious set of the most common platforms currently in use. Six application architectures (batch MIS/transaction processing, online MIS/transaction processing, etc.) were defined based on a framework previously developed by Rumbaugh et al. (1991) to describe different computing styles. Diversity of programming languages was calculated by counting the number of different languages used on a significant proportion (at least 5%) of new applications development. Analogous methods were used to compute the measures for runtime platforms and application architectures.
4.4
Assimilation Stage
The primary dependent variable for this research is assimilation stage achieved (Meyer and Goes 1988). Assimilation stage may be viewed as a combined measure of earliness of initiation of assimilation activities, speed of assimilation activities, and an absence of rejection, stalling or discontinuance. Assimilation stage provides a unique combination of both generality and richness, and avoids many of the particular limitations of other innovativeness measures (Fichman 1995) Furthermore, assimilation stage is especially appropriate when studying emerging technologies such as OOPLs, because it alone among commonly used innovativeness measures captures gradations of innovativeness among those that have yet to adopt. A six stage model of SPI assimilation was employed: 1) awareness, 2) interest, 3) evaluation/ trial, 4) commitment, 5) limited deployment, 6) general deployment (see Table 1). The model is similar to the one employed by Ettlie (1980) in his analysis of the adequacy of stage models, but with two important differences. First, "trial" and "evaluation" are combined into a single stage (evaluation/trial) because of the finding by Ettlie that frequently only
- 10 -
one of these stages occur, or they occur simultaneously. Second, Ettlie's "implementation" stage is divided into two stages (limited deployment and general deployment) to distinguish the fact that in many cases an SPI may be deployed on a few projects but never make the transition to a regularly used technology. Table 1 below provides a description of the Guttman scale used to operationalize assimilation stage for the case of OOPLs. Organizations were classified according to the highest stage achieved as of the time the survey was administered. A total of twelve questionnaire items were devoted to performing the classification. Rather than asking informants about OOPLs as a generic innovation—and leaving the definition of what qualifies as an OOPL up to the informant—the languages qualifying as OOPLs were identified at the beginning of the questionnaire, and all subsequent questions were asked in relation to specific languages. The review provided by Booch was used to identify the most prominent, commercially available, fully object-oriented languages (1994, Appendix). In total, six languages were selected: 1) C++, 2) Smalltalk, 3) Object Pascal, 4) Objective C, 5) Eiffel, and 6) CLOS. As of December 1994, commercial implementations of C++ and Smalltalk, between them, held 96% of the market for OOPLs.3
Table 1: Guttman Scale for Assimilation Stage Stage
Criteria to Enter Stage
Survey Items Used to Classify
1. Awareness
Key decision makers are aware of the Is informant familiar with OOPL concepts or SPI products, or aware prior OOPL-related activities at site?
2. Interest
The organization is committed to actively learning more about the SPI
Is informant aware of plans to investigate any OOPL for possible production use within next 12 months?
3. Evaluation /trial
The organization has acquired specific innovation-related products and has initiated evaluation or trial
Has site acquired any particular OOPL? Is the site evaluating or trialing any OOPL?
4. Commitment
The organization has committed to use a specific SPI product in a significant way for one or more production projects
Are any specific production projects planned, in progress, implemented or canceled that use an OOPL as the primary language?
5. Limited deployment
The organization has established a program of regular but still limited use of the SPI product
Have at least three production projects been initiated? Has at least one production project been completed?
3Personal
communication, Stephen McClure, International Data Corporation, December 1994.
- 11 -
6. General deployment
The organization has reached a state where the SPI is used on a substantial fraction of new development, including at least one large and one mission critical system
Have at least three production projects been completed? Has site has implemented at least one large OOPL project requiring at least 12 person months of effort? Has one or more core or mission critical applications been completed? Has there ever been a year where at least 25% of new application development projects used an OOPL?
This model, like most, assumes a linear progression through assimilation stages (Ettlie 1980). Organizations may diverge from this progression in two primary ways, either by evaluating and rejecting OOPLs, or by adopting but later discontinuing the use of OOPLs. Additional items were included in the survey to identify rejectors and discontinuers (see Table 2). Since such organizations might well possess distinctive properties, a separate analyses is needed that focuses just on them. In point of fact, no organizations in this study had discontinued use of OOPLs; however, several had rejected, and an analysis of the properties of these organizations is provided later.
Table 2: Rejection and Discontinuance Criteria
Category
Survey Items Used to Classify
Rejection
The organization has evaluated and rejected the SPI for current use.
Has the site previously evaluated and rejected OOPLs?
Discontinuance
The organization committed to using the SPI at some point in the past, but is not now using it, and does not foresee using it in the future.
Has the site ever approved an OOPL for production use? Are no projects currently pending? Has the site discontinued use?
4.5
Control Variables
Several variables commonly employed in prior studies of innovation diffusion were also captured to provide for greater quasi-experimental control. These include: host organization size (Rogers 1983) size of the IT function (Swanson 1994), specialization (Damanpour 1991), IT staff educational level (Zmud 1982; Brancheau and Wetherbe 1990) environmental complexity (Zmud 1984), and sector (Bretschneider and Wittmer 1993). All of these variables are expected to have positive relationships to assimilation, with one exception: government organizations are expected to be less innovative with regard to SPIs, because of the finding by Bretschneider and Wittmer that government organizations were less innovative with respect to another information technology (i.e., microcomputers). (See Appendix A for a description of measures.) The primary potential confound to be controlled is related to size: since both learning-related scale and diversity can be expected to covary with organizational size—which itself been empirically linked to innovation—
- 12 -
organizational size is of special concern. Tornatzky et al. (1983) have argued that size per se has no compelling rationale linking it to innovation, and more likely serves as a proxy for other variables, such as slack resources, education and professionalism, specialization, and, especially, scale.4 Included variables provide both direct (IT size, host size) and indirect (education, specialization) control for this potential confound. 5.
METHODS
5.1
Data collection
A mailed cross sectional survey of IT departments in medium to large US-based enterprises was used to collect the bulk of study data. The survey was disk-based, i.e., respondents were sent a computer disk containing the questionnaire items (Horton 1990; Saltzman 1993). The ideal informants were set out in advance to be middlelevel IT managers with a good knowledge of applications development activities and technologies at their respective sites. Actual respondents overwhelmingly met these criteria. Nine of ten reported holding IT "manager" or "director" level titles.
Three-fourths reported responsibility for at least half of applications development
activities at the site. Eighty-four percent reported being "very" or "extremely" knowledgeable about applications development at the site. The disk-based survey (DBS) approach is especially well suited to the target informants—IT managers—the vast majority of which have IBM compatible PCs on their desks at work. DBSs are outwardly similar to their paperbased counterparts, except that informants receive a computer disk instead of a hard copy questionnaire. They insert the disk into their PC’s disk drive and initiate the survey session. A program then automatically leads them through the questionnaire items.5 Although little rigorous research has been done to compare disk-based and
4Scale
differs from size in that scale is defined in relation to some particular activity. While large size is usually
necessary for large scale, it is not sufficient. A large machine tool manufacturer, for example, may have a large scale manufacturing operation, but a small scale marketing operation. Conversely, a large movie distribution company might have a large scale marketing operation, but a small scale manufacturing operation. 5The
Ci3 authoring system, marketed by Sawtooth Software, was used to develop the DBS (Sawtooth 1992)
Capabilities provided by this system include: programmable item validation; context sensitive help; sophisticated list processing capabilities; the ability to store prior responses as variables that can be displayed as part of the text of subsequent questions; the ability to perform transparent branching based on the responses to one or more of the previous questions; and randomization, if desired, of the order of items within questions, questions within blocks, and blocks within questionnaires. All of these features (except for the last two forms of randomization) were employed in constructing the DBS used for this research.
- 13 -
paper-based modes, current evidence suggests that the disk-based mode does not introduce a significant bias regarding who responds,6 or how (Mitchell 1993).7 To qualify for the sampling frame, the site had to meet four criteria: 1) it had to be part of a larger enterprise with at least 500 employment; 2) it had to have previously reported at least some tools for software development installed at the site; 3) it had to have an informant with an IT management related title; and 4) it had to have at least some Microsoft DOS or Windows-based computers on site. The first two criteria increase the likelihood that custom applications development is performed at the site (the few responding cases not meeting this criterion were dropped from the analysis). The third criterion helps to ensure a well-informed respondent. The last criterion— which only excluded an incremental 5% of the sample—was used to increase the likelihood that respondents would have readily available the means to take the survey (a DOS-based computer). The survey instrument was developed and refined over a four month period, following the procedures recommended by Dillman (1983). The refinement process culminated with in-person pretests at five firms: a bank, a financial services firm, a utility company, an insurance company, and a manufacturer. The goals of the pretests were to gauge survey length, to obtain feedback on the user interface, to obtain feedback on question wording and technical accuracy, and to identify instances where respondents had difficulty responding due to cognitive limitations or a lack of knowledge. These pretests proved to be an essential part of the refinement process. The resulting instrument was quite lengthy and complex, with a total of 104 questions, 106 computer screens, and 35 branch points.
The shortest path through the questionnaire was 64 questions; the longest path was 88
questions. It is felt that a questionnaire of this length and complexity simply could not have been administered using a paper-based approach. Additional advantages of the DBS approach include elimination of most kinds of informant coding errors, and complete elimination of transcription errors and delay. In addition, current evidence suggests that DBSs have higher response rates than comparable paper-based surveys (Horton 1990; Saltzman 1993). Finally, informant attitudes towards the DBS itself were quite positive: at the end of the survey, 61.3% of respondents reported being more willing to take future disk-based surveys, while only 4.5% were less willing.
6Elizabeth 7This
Smith, personal communication, Intelliquest, 1993.
may raise for some readers the question of why a mode bias might exist for E-mail surveys but not for DBSs.
Keisler and Sproull found, for example, that people taking surveys administered via E-mail had more extreme responses and less socially desirable responses than those taking equivalent paper-based surveys (1986). Keisler and Sproull argue that the mode bias found in their study was due a lack of social cues, including official envelopes and cover letters on official letterhead (1986). With the DBS mode, however, such cues are present. Informants still receive a mailed package containing a cover letter and survey; they still respond using a provided mailer; and they still receive hard copy reminder and letters. The DBS mode only changes how informants physically take the survey, not how they interact with the sponsoring organization.
- 14 -
Numerous strategies, including most of those recommended by Dillman (1983), were employed in an effort to boost response rates and reduce bias. These included: 1) Use of an individually addressed, hand-signed cover letter that emphasized the survey’s university affiliation, assured confidentiality, and explained the importance of a high response rate; 2) Provision of incentives, including a chance to receive one of five $100 lottery prizes (for those responding within two weeks) plus a copy of the research results and some additional technical reports (for all respondents); 3) Use of multiple follow up contacts, i.e., a reminder card and follow up letter; 4) Use of other techniques designed to communicate the sponsoring organization’s commitment and investment in the survey, including provision of an 800 number for questions, and provision of a postage paid, pre-addressed mailer for returning the disks. A probability sample of 1500 sites was extracted from a list, maintained by International Data Corporation, of 40,000 US sites with computers installed.8 In January of 1994, a survey packet was sent to each of the 1500 sample informants (one per site). A total of 679 sites returned disks, for a raw response rate of 45%. A total of 71 disks were excluded from analysis: 20 arrived after the cut-off date, 39 were from unqualified sites (no applications development) or unqualified informants (not a manager or poor knowledge of applications development), and 12 were incomplete or otherwise unusable. This left a sample size of 608 responses. Although, as Dillman points out, survey recipients react to the “total package” rather than individual elements when deciding whether to participate in a survey, it seems likely that three elements in particular contributed to the high response rate: the mix of incentives, the university affiliation, and the DBS mode of administration.
5.2
Analysis of Potential Response Bias
With a 45% raw response rate, the potential exposure of this research to a response bias is less than with many large scale surveys, although it is still worthy of attention. Fortunately, this research had a valuable resource available to help determine the substantive importance of response bias, namely, the variables in the original IDC database from which the sample was drawn. The IDC database included four variables of use in assessing response
8The
goal of this list is to provide advertisers in Computerworld magazine—the flagship trade publication for the
IT industry—with good prospects for their sales efforts. The target informants are IT professionals with buying authority for hardware, software or telecommunications products. The selection was random, except that sites that had previously reported "Object DBMS/tools" in place (in the survey used to construct the IDC Database) were two times over-sampled. This was done to ensure a large enough N for planned analyses involving OOPL deployers only.
To correct for this over sampling, case weighting was used in all statistical analyses.
Specifically, cases were weighted so that the incidence of cases reporting "Object DBMS/tools" in place in the set of usable responses was the same as the incidence in the original sampling frame.
- 15 -
bias: OO adoption (a binary measure of whether any object-oriented tools were reported to be in use), IT size (the number of IS employees in the organization as a whole), host size (the number of employees in the host organization), and government (a dummy variable indicating that the sector is governmental). Of the available variables, these map most directly to variables included in the theoretical model. A logistic regression analysis was performed using OO adoption as the dependent variable and host size, IT size and government as the independent variables. The equation was estimated first for the sample as a whole, and then just for respondents. Individual parameter estimates were quite similar. As a result, a significant bias affecting inferences about associations seems unlikely. To further explore the potential for response bias, a 14 item telephone questionnaire was developed and administered to a set of 42 randomly selected non-responding sites. An analysis of the primary reason for nonresponse showed that neither questionnaire design itself or the disk-based method of administration was likely to have introduced much bias into who chose to respond. "Lack of time" was by far the most commonly stated reason for non-response, with two-thirds of the respondents giving this as their primary reason. Three-fourths of the respondents had IBM-compatible PCs on their desks at work and the other fourth had them readily available, suggesting that a lack of access to necessary equipment—a major potential concern with the DBS mode—was not a main cause of non-response. Only 10% of non-respondents volunteered anything specific to the questionnaire as the primary reason for non-response (e.g., "not interested in the questions").
5.3
Analysis of Potential Method Bias
A method bias is said to have occurred when statistical relationships between variables are due to the method used to measure the variables rather than relationships between the constructs they represent (Venkatraman and Ramanujarn 1987). A method bias is most likely to be a problem in studies that, like this study, use a single instrument administered to a single informant to contemporaneously measure both independent and dependent variables. (Having different informants provide data associated with the independent and dependent variables was not a feasible option for this research.)
The specific concern is that respondents will infer the "expected"
relationships between variables and then shade their answers to be more consistent with the expected relationships. One test of whether a method bias might exist is to gather data on just the dependent variable, at a later time, from the same informant. The idea is that at this later time the expected relationships would not be as salient to the informant, and hence, less, if any, shading would occur. The model is then estimated using the dependent variable at Time 2, and an analysis is performed to determine whether the expected theoretical relationships still hold. A paper-based follow up survey was performed to support an analysis of method bias. A one-page, 12 item survey was constructed to measure assimilation stage. Eight weeks after the original disk-based survey had been mailed, the follow up surveys were mailed to the 608 informants who had provided usable responses to the original survey. A total of 411 surveys were returned within 6 weeks, for a raw response rate of 68%. Of the 411, nineteen
- 16 -
responses were not usable because of incomplete or inconsistent responses, and nine were classified as rejectors. This left a net of 383 cases for which assimilation stage at Time 2 could be determined. A comparison of assimilation stage at Time 1 (Stage T1) and Time 2 (Stage T2) revealed a high degree of consistency between the two. The two measures were correlated at r=.72, and in 89% of the cases, the Stage T2 was either the same as Stage T1, or differed by only one position. In addition, as will be shown in the following section, substituting Stage T2 into the analyses used to test the hypothesized model had no effect on inferences about explanatory factors, and therefore, there is no support for a potential methods bias. 6.
MAIN RESULTS
6.1
Characteristics of Responding Sites
The vast majority of sites appear to be typical MIS organizations. Of the retained sites, 97% reported that custom applications had been developed at their site for at least 3 years; 69% reported custom software development for at least 10 years. Eighty-one percent reported mainframes or midrange computers as their primary host environment for applications development.
Ninety-two percent of sites reported that online MIS/transaction processing
comprised at least 5% of their development activity. The median host organization employment (at all sites) is 1,200, with maximum of 200,000. A wide range of industrial sectors are represented, including not-for-profit sectors such as government (14%), education (9%), and medical (6%). The largest sectoral representation is in manufacturing with 39%. The reported size of the total onsite IT staff (including development, technical support and operations) ranged from 1 to 3,000, with a median of 16. Smaller departments are included (16% reported fewer than 5 total staff members) and well as very large (13% reported over 100 staff members).
6.2
Status of OOPL Assimilation
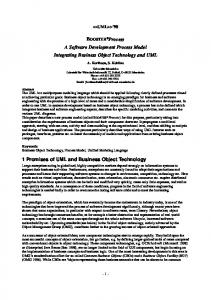
The dominant language acquired is C++. Of locations that have acquired any OOPL (N=265), 94% have acquired C++, 88% consider it their primary OOPL, and 67% have acquired nothing but C++. For Smalltalk these percentages are 15%, 5% and 1%, respectively. OOPLs are one of the more recent SPIs to become commercially available, and this fact is reflected in the breakdown of responding organizations provided in Figure 1. While nearly half of responding organizations (44%) have acquired at least one OOPL, only about 11% have yet committed to using it for production applications, and only 1% have reached the general deployment stage. Many organizations that have acquired an OOPL, and would be classified as adopters in some studies, have actually yet to begin an evaluation (N=47), or have rejected OOPLs (N=25).
- 17 -
608 (100%) Total Respondents | |---> 343 (56%) No OOPLs acquired | | | |---> 46 (8%) No familiarity with OOP | |---> 55 (9%) No current interest in OOPLs | |---> 203 (33%) Paying attention to OOPLs but waiting | |---> 37 (6%) Definite plans to evaluate within 12 months | |---> 2 (.5%) Currently evaluating one or more OOPLs | |---> 176 (29%) One or more OOPLs acquired | | | |---> 47 (8%) Planning to evaluate OOPLs | |---> 71 (12%) Currently evaluating/no development work | |---> 58 (10%) Using on trial/pilot projects (not production) | |---> 64 (11 %) OOPL commitment | | | |---> 29 (5%) At least one significant production | | project planned/in progress/implemented | |---> 28 (5%) At least one significant production | | project implemented, at least 3 attempted | |---> 6 (1%) At least 3 significant projects implemented, | including one large and one mission critical; | using on at least 25% of new development | |---> 25 (4%) OOPL(s) acquired, evaluated then rejected
(Stage 0) (Stage 1) (Stage 1) (Stage 2) (Stage 2)
(Stage 2) (Stage 3) (Stage 3)
(Stage 4) (Stage 5) (Stage 6)
Figure 1: Detailed Breakdown of OOPL Assimilation Table 3 confirms the particular value of assimilation stage as an innovativeness measure for SPIs that have emerged more recently. The inclusion of the first three categories (not aware, aware, interest) captures significant variance in innovativeness that would be excluded from consideration in any of the other measures commonly used to measure innovativeness (i.e., time of adoption, dichotomous adoption, aggregated adoption, internal diffusion, infusion) (Fichman 1995).
- 18 -
Table 3: OOPL Assimilation Stage Category
0. Not aware 1. Aware 2. Interest 3. Evaluation/Trial 4. Commitment 5. Limited Deployment 6. General Deployment Rejectors TOTAL
6.3
Count
Percent
46 258 86 129 29 28 6 25 608
7.6 42.5 14.1 21.2 4.8 4.6 1.0 4.1 100
Theory Testing
The primary method for data analysis was partial least squares (PLS), a second generation multivariate technique for the estimation and assessment of structural models (Fornell and Bookstein 1982; Wold 1982; Löhmoller 1984) The PLS algorithm works iteratively to establish indicator weights and loadings while trying to fit an overall model including both measurement and structural relations (Gopal et al. 1993). After establishing indicators weights, composite scores are created as combinations of indicators times their weights. Structural paths are then fit using OLS regression based on the composite scores. The PLS analysis was conducted in two phases. In the first phase, the measurement model was evaluated. The inward-directed indicator mode was employed in specifying the model because the constructs are viewed as formative rather than reflective. The indicators of the diversity construct, for example, are not seen as alternative reflections of diversity, but rather, as causing or comprising it. (For good discussions of formative versus reflective indicators, see (Fornell and Bookstein 1982; Johansson and Yip 1994)) An inspection of the estimated indicator weights suggested that two indicators should be eliminated, one because of an unexpected negative weight (the third indicator of related knowledge), and one because of a weight of essentially zero (the third indicator of diversity) (Table 4). The reduced model was re-estimated, and no further problems were found. For the five multi-indicator constructs—learning-related scale, related knowledge, diversity, IT size and education level—the average indicator variances explained were .96, .59, .70, .80 and .66 respectively. The overall average variance explained for the multi-indicator constructs was .74, well exceeding the established criteria of .50 for acceptable convergent validity (Johansson and Yip 1994). In addition, there were no instances where a construct correlated more highly with another construct than it did with its own indicators (on average), thus assuring adequate discriminant validity (Igbaria and Greenhaus 1992)
- 19 -
Table 4: Indicator Weights and Loadings Construct Learning-Related Scale Related Knowledge
Diversity
IT Size Host Size Specialization Education Env Complexity Government Assimilation Stage
Indicator
All Indicators Weight Loading
L1 L2 K1 K2 K3 K4 D1 D2 D3 I1 I2 H1 S1 E1 E2 C1 G1 A1
.63 .39 .69 .31 -.45 .50 .67 .53 -.01 .37 .73 1.00 1.00 .64 .59 1.00 1.00 1.00
Two Indicators Eliminated Weight Loading
.99 .97 .81 .60 .21 .71 .87 .79 .38 .83 .96 1.00 1.00 .83 .80 1.00 1.00 1.00
.63 .39 .62 .27 -.38 .66 .53 -.37 .73 1.00 1.00 .64 .59 1.00 1.00 1.00
.99 .97 .87 .65 -.76 .87 .79 -.83 .96 1.00 1.00 .83 .80 1.00 1.00 1.00
As shown in Table 5, the correlations for all of the constructs expected to be associated with assimilation stage are significant (at p².05) and have the expected signs.
Table 5: Construct Correlations Assim Stage 1. Learning-Related Scale 2. Related Knowledge 3. Diversity
.38**
4. 5. 6. 7. 8. 9.
IT Size Host Size Specialization Education Env Complexity Government
1.
2.
3.
4.
5.
6.
7.
.34**
-.04
.35**
.39**
.11**
.39**
.63**
.01
.38*
.15**
.39**
-.02
.20**
.41**
.28**
.38**
.11**
.34**
.36**
.24**
.19**
.20**
.25**
.17**
.19**
.11**
.11**
.08
.02
.14**
.02
.02
-.01
.10*
.02
-.13**
-.03
-.14**
-.03
-.08
.02
-.06
-.10*
8.
-.03
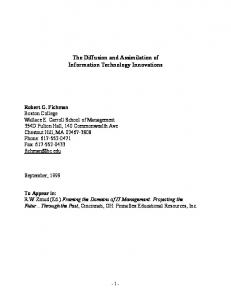
**p²01 *p².05 In the second phase, the structural model was evaluated. Table 6 provides the results for three estimated models. Model 1 is the full model, while Model 2 is a controls-only model that provides a benchmark for assessing the
- 20 -
additional impact of the three theoretical variables. Model 3 includes only the three theoretical variables as predictors. The cells contain the path coefficients produced by PLS; these are identical to the standardized beta coefficients produced by OLS regression. OLS regression was used to compute the t-statistics for the parameters, shown in parentheses.9
An examination of the results for the full model (Model 1) reveals that the path
coefficients from learning-related scale, related knowledge, and diversity to assimilation stage are all highly significant, with t-statistics of 4.5, 8.6 and 3.9, respectively. IT Size is the only other significant predictor (t=4.1) in this model.10 The overall model, which explains 32% of the adjusted variance, is highly significant, with an Fstatistic of F=31.2 (p².0001). Standard regression diagnostics revealed no violations.11 The decision to include a control variable, IT size, that covaries with a theoretical variable, learning-related scale, represents a conservative approach to testing the theoretical model, because including this control could serve to hide a genuine effect of the theoretical variable. As it happened, both variables were strongly significant when jointly included. Another potential effect of including IT size is to increase instability of the parameter estimates across the different models. However, this potential disadvantage is believed to be outweighed by the advantages of the approach taken, which is to strongly rule out the rival hypothesis that the learning-related scale effect is solely a spurious result of its covariation with IT Size. A comparison of Models 1 and 2 shows that the full model explains an incremental variance of 13% (32%-19%), a significant increase in variance explained (F ratio=39.9, P².0001). Including the control variables on top of the independent variables, by contrast, only explains an additional 2% (32%-30%) of the variance, as shown by a comparison of Models 1 and 3.
9PLS
makes no distributional assumptions about the data, and hence, t-statistics are not available. Ordinarily, the
preferred approach to assessing the significance of path coefficients when using PLS is to rely on jackknife statistics (Fornell and Bookstein 1982; Wildt et al. 1982), which can be produced by the blindfolding algorithm provided by LVPLS 1.8 (Löhmoller 1984).
However, LVPLS 1.8 does not support case weighting in the
blindfolding algorithm. As a result, conventional t-statistics produced by case weighted OLS were viewed as more appropriate for this study. It is worth noting that the critical ratios produced by blindfolding (without case weighting) were greater than those produced by OLS (with or without case weighting). Therefore, in this instance, the OLS t-statistics represent a more conservative approach to theory testing. 10A
multi-level logistic regression was also run for this model. The same predictor variable were significant, with
nearly identical levels of significance. 11The
histogram and normal probability plot for standardized residuals both showed that residuals were close to
normally distributed. A scatter plot of standardized residuals versus standardized predicted values shows no significant patterns, thus confirming the absence of heteroscedasticity. The largest condition index was CI=2.7, well below the rule-of-thumb of CI=10 used to identify even mild potential collinearity problems (Belsley et al. 1980
- 21 -
Table 6: Evaluation of Structural Model Model 1 Full Model (N=583)
Model 2 Control Variables Only (N=583)
Model 3 Theoretical Variables Only (N=583)
Adjusted R2
.21**** (4.5) .31**** (8.6) .15*** (3.9) .19**** (4.1) -.05 (-1.2) .05 (1.3) .00 (0.1) .02 (0.6) -.05 (-1.5) .32
.32**** (7.3) -.03 (-0.7) .15*** (3.6) .11** (2.8) .06 (1.6) .08* (-2.1) .19
.30
F
31.2****
23.2****
83.3****
1. Learning-Related Scale 2. Related Knowledge 3. Diversity 4. IT Size 5. Host Size 6. Specialization 7. Education 8. Environmental Complexity 9. Government
****p ².0001
***p ².001
**p ².01
.32**** (8.4) .33**** (9.5) .19**** (5.0)
*p ².05
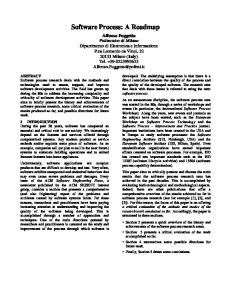
To further explore the relationship between predictor variables and assimilation stage, the mean values for the four variables with the strongest direct correlation with stage—learning-related scale, related knowledge, diversity, and IT size—were computed for each level of assimilation stage. Table 7 shows these mean values, together the ranking of the value from 0 (the category with the lowest mean value) to 6 (the category with the highest).12 The mean values and ranking of rejectors were also included, to support comparisons involving this group. While there are nearly uniformly increasing mean values for the three strongest predictors (learning-related scale, related knowledge, and IT size), the mean values are non-monotonic for diversity in the last four stages. The results for stage 6 must be interpreted cautiously, however, as the number of cases in this category, six, is far to few to smooth out random variation.
12Since
these constructs are linear combinations of standardized variables, the overall mean is zero.
- 22 -
Table 7: Mean Values and (Rank Order) of Predictors by Stage LearningRelated Scale 0. Not aware 1. Aware 2. Interest 3. Evaluation/Trial 4. Commitment 5. Limited Deployment 6. General Deployment
-.64 -.33 .11 .29 .53 .79 .75
(0) (1) (2) (3) (4) (6) (5)
Rejectors
-.37 (0.5)
Related Knowledge -.41 -.27 -.01 .12 .33 .69 2.52(6)
(0) (1) (2) (3) (4) (5)
.20 (3.5)
Diversity -.59 -.35 .01 .44 .13 .72 -.06
(0) (1) (3) (5) (4) (6) (2)
-.05 (1.5)
IT Size -.57 -.34 .05 .35 .25 .76 1.13
(0) (1) (2) (4) (3) (5) (6)
-.47 (0.5)
The results in Table 7 related to rejectors suggest an interesting result. The reasonable assumption that rejectors, having already evaluated an OOPL, should have predictor values at least as high other organizations still engaged in evaluation (assimilation stage 3), is not supported. In fact, the average of the predictor values is much lower for rejectors than for evaluators for all variables except related knowledge. This result is fully consistent with the instrumental nature of the proposed model of innovativeness. Specifically, organizations with comparatively low values of predictor variables, are viewed to be, in effect, poor candidates for assimilation of OOPLs. Should such organizations "erroneously" include themselves among the early initiators of OOPL assimilation, the proposed model would predict they should be less likely to sustain innovation, thus leading to higher rates of rejection and discontinuance. This confirms the importance of identifying rejectors and segregating them when analyzing the predictors of adopter innovativeness.
6.4
Differently Directioned Effects
It has been argued that for some structural features of organizations—such as centralization and formalization— effects may be differently directioned for different stages (Zaltman et al. 1973; Downs and Mohr 1976; Tornatzky and Klein 1982). The idea is that more "organic" organizations with lower centralization and formalization should be more prone to embracing new ideas, and hence should be more likely to initiate innovative activities, while "mechanistic" organizations, with higher centralization and formalization, should be better able to obtain consensus and push through to the later stages of the innovation process, and hence should be more likely to adopt and implement those (presumably fewer) innovations that they do initiate. Although this intriguing notion has often been asserted, actual empirical studies have not generally shown this to be true (Nilakanta and Scamell 1990; Damanpour 1991; Grover and Goslar 1993). The current data provide an opportunity to examine this question in the context of SPI assimilation. A model was estimated that only included organizations where assimilation stage ranged from 3 (evaluation/trial) to 6 (general deployment), thus limiting attention to the part of the innovation process where variables have been
- 23 -
previously hypothesized to have different signs. A variable capturing the number of years since acquisition of an OOPL (time) was also included to control for the effects of more rapid assimilation up to the time the organization reached the evaluation/trial stage. The hypothesis of differently directioned effects was not supported.
The
coefficients for learning-related scale, related knowledge and IT size were still positive and significant. Although the coefficient for diversity turned slightly negative in this model (beta=-.09), it was not significantly different from zero. The signs for all other coefficients were the same for this model as for Model 1. Therefore, there is no support for the notion of differently directioned effects for the variables in this study.
6.5
Potential Threats to Validity
The plausibility of three major threats to the validity of the base model are examined. The first threat is related to common method bias (previously discussed in Section 5.3). A separate analysis showed that the independent variables remain highly significant when assimilation stage as measured at Time 2 (using the paper-based questionnaire) is substituted into the base model, thus providing no support for the hypothesis that the results of the base model are due to the fact that the data on both predictor and outcome variables were collected at the same time with the same instrument. The second potential threat to the validity of the base model is possible reverse causation between related knowledge and assimilation stage. This could occur if it turned out that organizations in the study predominantly accumulated experience in the indicators of the related knowledge construct (the C language, client-server, etc.), after they began using an OOPL, rather than the reverse. To assess this threat, a model was estimated that only included organizations earlier in the OOPL assimilation process, where assimilation stage ranged from 0 (not aware) to 3 (evaluation/trial). Since only organizations that have no experience developing with OOPLs are included in this model, it is not possible that the level of related knowledge in these organizations is due to such experience, yet the coefficient for related knowledge was still highly significant (t=4.9; p².0001). Therefore, the hypothesis that reverse causation accounts for the significant relationship in the full model is not plausible. A third potential threat to the validity of these results also concerns related knowledge. It might be argued that some of the indicators of this construct, particularly client-server and GUI experience, could themselves be viewed as indirect indicators of software process innovativeness. If true, this opens up the possibility that the relationship between related knowledge and assimilation stage results from unmeasured common causes of software process innovativeness. An examination of the correlations in Table 5 renders this implausible, however, because related knowledge is only weakly correlated with other variables that were included in the model, and is especially weakly correlated with the strongest predictors of assimilation stage (learning-related scale, diversity, and IT size). If related knowledge were, in fact, a reasonable indicator of innovativeness, then it should be predicted by the same variables as assimilation stage.
- 24 -
7.
7.1
DISCUSSION
Summary of Results
This research has strongly confirmed the expected role of organizational learning-related factors in the innovation process. Specifically, it was shown that learning-related scale, related knowledge, and diversity are all positively related to OOPL assimilation stage. The full model explained significantly more variance than the controls-only mode. In fact, a model with just the three learning-related factors explained 30% of the variance, nearly as much as the full model, which explained 32% of the variance. It was also found that while four of six control variables— IT size, specialization, education and government—were significant predictors in the controls-only model, only one of these, IT size, significantly predicts assimilation stage in the full model. This supports the validity of the control variables, while demonstrating the potential for inappropriate inferences in the absence of the hypothesized organizational learning-related factors. Other notable results include the finding that the profile of rejectors more nearly resembles the profiles of those organizations in early stages (awareness and interest) than those in later stages (evaluation/trial, commitment and deployment). This is consistent with the notion that those organizations that initiate assimilation "too soon"—as implied by their comparatively low levels of predictor variables—are less likely to sustain innovation. Finally, the use of a disk-based mode of survey administration appears to have been a significant factor in the success of the research, as evidenced by the high response rate, the small proportion of unusable responses, and the absence of complaints about the medium by 90% of non-respondents contacted by telephone. Numerous procedures were performed to ensure the trustworthiness of the above results. The research model was developed based on a review of the innovation literature and more recent work in organizational learning. The survey instrument was developed over a four month period, using the procedure recommended by Dillman, culminating with five in-person pretests. The sampling frame was extracted from a high-quality list shown to be consistent with the desired theoretical universe. A probability sample was extracted from this frame, thus ruling out the possibility of a selection threat. A large sample size (N=608) and a high response rate (45%) was achieved through careful attention to survey administration and judicious use of incentives, thus ensuring adequate statistical power. Responding informants were shown to fit the target criteria of being middle-level IT managers well informed about the applications development activities and technologies at the site. Statistical analyses of the potential for response bias and for inadequate construct validity were performed and rendered these threats implausible. An analysis of standard regression diagnostics revealed no violations. And finally, analyses were performed that rendered implausible three prominent rival hypotheses: that the observed results are due to common method bias; that related knowledge is a cause of, not a result of, OOPL assimilation; that
the observed
relationship between related knowledge and stage results from unmeasured common causes of software process innovativeness.
- 25 -
7.2
Potential Limitations
The main potential limitations of this research arise from the use of a cross-sectional survey design with a single key informant. This approach raises three potential issues. First, in a perfect world, the values for the predictor variables would be captured immediately prior to the innovation process they are hypothesized to influence, whereas in the current study the variables were captured for the one to three year period immediately preceding the administration of the survey instrument. However, since the values of the predictor variables in this study tend to change only slowly over time, it is likely that the values at the time of survey administration are highly correlated with values over the preceding few years—the time in which the vast majority of OOPL-related innovation activities occurred.
Nearly 90% of those acquiring an OOPL did so in the 3 years immediately preceding
administration of the survey. Therefore, this may not be a significant limitation for this study. The second concern arises from the use of a single informant. Some measures may have been inaccurate because the key informant may have been either unmotivated or not very knowledgeable about the domains covered in the survey. While it appears the vast majority of respondents were in fact well motivated and well informed, the single informant design precludes the opportunity to strongly confirm the reliability of measures by making comparisons across informants. The use of a single informant also increases the potential for a method bias. However, a secondary analysis of outcome data gathered through a follow-up paper-based survey showed no support for a method bias hypothesis. Third, there is a concern about time-ordering of effects, i.e., that levels of the independent variables could have been significantly affected by OOPL assimilation, rather than the reverse. However, only 10% of the informants have begun using OOPLs in earnest, so this seems implausible.
7.3
Implications
This study has implications for theory, methods, and practice. With regard to theory, this research supports the reconceptualization of diffusion for complex organizational technologies initiated by Attewell.
It maps the
implications of Attewell's macro-level model to the organizational level, identifies three organizational learningrelated factors that should be of particular importance for organizational assimilation of complex organizational technologies, develops measures for these factors tailored to the SPI context, and provides statistical confirmation of their expected influence on innovation. The strong influence of related knowledge—combined with the fact that this construct does not strongly covary with "generic" innovation predictors—demonstrates the value of examining particular technologies with models that incorporate innovation-specific predictors. The strong influence of learning-related scale and diversity—combined with the fact that these constructs do covary with other common innovativeness predictors—suggests that future research on SPI assimilation should seriously consider incorporating these factors to control for possible confounds.
Host organization size, for
example, has a significant, positive zero-order correlation with assimilation stage, but is insignificant in regressions that include these other variables. This result is consistent with Tornatzky et al.'s contention that the
- 26 -
well-established empirical link between innovation and organizational size is more likely a result of other variables that covary with size—such as scale, professionalism, education, and specialization. More generally, this research has demonstrated that it is possible to construct strongly predictive variance models, even when the focal innovation is a complex organizational technology. One of the long standing criticisms of diffusion research has been the general weakness and instability of findings in studies predicting innovation. This research has shown that strong results can be achieved, at least when researchers confine their focus to more specific innovations and contexts, and employ theory more closely tailored to those innovations and contexts. With regard to methods, this research confirms the value of assimilation stage as an innovativeness measure, especially when the focal technology has not yet been widely adopted. If the traditional approach of using time of adoption or dichotomous adoption for the outcome measure had been used instead, no gradations in innovativeness would have been captured for as much as 90% of the responding population, depending on the definition used for "adoption." Furthermore, it would not have been possible to evaluate the hypothesis of differently-directioned effects. One of the traditional limitations of innovation research has been its typical backward-looking focus on technologies for which diffusion has already run its course. While that approach certainly has advantages, it does limit the opportunity to draw immediate, practical implications for potential users and vendors of the emerging technologies under study. In contrast, the research done here has identified factors affecting the assimilation of OOPLs early enough in the diffusion process for this information to be of direct benefit to these groups. Another contribution to research methods is confirmation of the value of the disk-based survey (DBS) mode. A survey as lengthy and complex as the one used in this research simply could not have been successfully administered using telephone or paper-based survey modes.
Add to this the other advantages of DBS
(minimization of item non-response and inadvertent coding errors; elimination of transcription costs, delay and errors) and the apparent positive effect on response rate, and one is left with a compelling case for the use of the DBS mode where it is feasible. This research also has practical implications—for technology vendors and mediating institutions, as well as endusers. For technology vendors and mediating institutions, this research has identified the profile of organizations more likely to initiate and sustain SPI assimilation (and in particular, OOPLs), i.e., organizations with high learning-related scale, more extensive knowledge related to the focal innovation, and greater diversity of knowledge and activities regarding applications development. This provides the basis for more targeted marketing and promotion, e.g., by directing more promotion effort to appropriate specialty journals, trade shows, and technical seminars, and/or by screening prospects based on how well they fit the profile of an early assimilator. Targeted marketing is likely to be of particular value for complex organizational technologies such as SPIs, because, as Attewell has argued, broad brush "signalling" of the existence and potential benefits of such
- 27 -
technologies is likely to be of lesser importance in promoting adoption.13
In addition, when broadly-based
marketing does succeed in encouraging adoption by organizations that do not fit the assimilator profile, this could well be a pyrrhic victory, as such organizations should be less likely to sustain innovation, and may well become influential "negative" opinion leaders (Leonard-Barton 1985). Vendors and mediating institutions should rather be more focused on identifying appropriate adoption candidates, learning about the particular challenges these organizations face, and taking a more proactive role to promote successful assimilation among these sorts of organizations. Examples of such activities in the case of OOPLs abound. Many OOP language vendors have created technology consultation divisions that supply long term, on-site assistance with OOPL-based systems development.
A new breed of technology consultants—referred to as "mentors"—are now available to
organizations, that, rather than just doing development themselves, work side-by-side with end-users with an explicit charter to teach organizations how to be successful with object technology. Vendor-sponsored user groups are another common tactic employed to facilitate successful assimilation. The main implication of this research for end-user organizations is that they would be well advised to view SPI assimilation as a multi-year process of organizational learning, and to carefully assess the extent to which they fit the profile of an early and sustained assimilator.
Successful assimilation requires sizable investments in
organizational learning and process change. Considering the expense and risk involved, those that do not fit the profile should seriously consider delaying adoption, or adopting a less complex variant of the technology. If such organizations do go forward with early adoption, it should be with the understanding that risks are even higher, and therefore expectation management will be especially crucial. Those organizations that do fit the assimilator profile—other things equal—should be more vigorous in assessing emerging technologies in general, and when a decision to adopt is made, should undertake assimilation strategies that exploit their inherent opportunity for more cost effective and successful assimilation. Learning-related scale opens the option of more expensive assimilation strategies that may well be essential to success, such as hiring of experts, development of a redesigned process (and the infrastructure to support it), and allowing extended periods of "practice" on non-production systems. However, managers must have the wisdom and will to employ these options if they are to be of benefit in increasing the chances of successful assimilation. Related knowledge can also be extremely advantageous, but only if it is taken into account in such as activities as technology selection, project selection, and the assignment of personnel to projects. Diversity increases the likelihood of an organization possessing a "safe haven"—an area where an SPI is a particularly good fit, and the conditions for learning are more ideal—and also affords the opportunity to "bootstrap" learning from areas where the technology is a higher fit, and fewer demands are made on organizational competence, to lower-fit areas where successful application
13Bolstering
this argument is the finding in this study that only 8% of respondents were not yet aware of OOPLs.
- 28 -
requires greater organizational competence. Once again, however, diversity is only an advantage for organizations that do exploit it wisely.
7.4
Future Work
The results of this research suggest two avenues for future work. One such avenue would be to attempt to replicate the results achieved here in other settings. In addition to studying assimilation of other SPIs by end-user IT departments, it would be interesting to study other kinds of adopters, such as independent software vendors or consulting firms, to determine whether results hold for them as well. It would also be useful to apply this model to other complex organizational technologies beyond SPIs, to examine whether the results can be generalized to the broader set of technologies that also impose a substantial knowledge burden. A second avenue for future work would be case-based research focusing specifically on the assimilation strategies and tactics suggested by organizational learning-related factors. Interesting research questions include: are these tactics in fact being widely employed? if so, how effectively? if not, why not? And are these tactics more likely to be employed by organizations that fit the profile of an early/sustained assimilator? This kind of process research would provide a natural and valuable complement to the variance model tested here. 8.
CONCLUSIONS
Technological innovation is considered the primary driver of improvements in industrial productivity. Yet, if promising inventions cannot be widely deployed, then clearly the benefits resulting from their invention will be curtailed. Many have commented on the disappointingly slow rate of progress of software practice in the United States. While much of the so-called software crisis is likely attributable to undisciplined application of existing technologies and inattention to measurement and continuous improvement, incremental improvement can go only so far; at some point, more radical changes are needed to provide the base upon which further incremental improvements can be built. Software process innovations—and complex organizational technologies more generally—impose a substantial burden on would-be adopters in terms of the know-how and technical knowledge needed to use them effectively. When knowledge barriers are high, the ability to innovate becomes at least as important as the desire or opportunity. This research has addressed the question of what kinds of organizations should be expected to innovate, even in face of high knowledge barriers. It was hypothesized that organizations with higher learningrelated scale, greater related knowledge, and greater diversity of knowledge and activities would be more prone to innovate, because such organizations can better amortize learning costs, can more easily acquire the knowledge needed to innovate, and have less they have to learn to begin with. All hypotheses were strongly supported, thus confirming the importance of organizational learning-related factors in explaining the assimilation of complex technologies such as software process innovations.
- 29 -
APPENDIX A: MEASURES Construct
Ind
Indicator descriptions
Mean
sd
L1
Log (number of application developers at site * percentage of applications-related effort attributable to new systems)
2.39
.77
L2
Log (number of application developers at site * percentage of applications-related effort attributable to new systems and enhancements)
2.71
.70
K1
Percentage of development staff with experience programming in C
20.6
26.2
K2
Percentage of development staff with experience developing clientserver applications
16.9
25.9
K3
Percentage of development staff with experience developing PC or workstation applications
38.7
33.2
K4
Percentage of development staff with experience developing graphical user interfaces
16.5
24.6
D1
The number of different programming languages used by ³ 5% of the development staff in 1993 (assembly language, Cobol, C, other non-OO third-generation language, non-OO fourth generation language)
2.27
1.20
D2
The number of different runtime platforms accounting for ³ 5% of new development over last 3 years (centralized mainframe, centralized midrange, client-server (CS) with mainframe host, CS with midrange host, CS with desktop host, networked workstations/PCs, standalone workstations/PCs)
2.77
1.26
D3
The number of different application architectures accounting for ³ 5% of new development over last 3 years (batch MIS/ transaction processing, online MIS/transaction processing, information retrieval/reporting/query, scientific/engineering /modeling/simulation, real-time/process control, office automation/personal productivity/groupware)
3.63
1.09
I1
A categorical variable capturing level of external IT spending within respondent's span of influence (nine categories)
$500 -999k
1.35
I2
A categorical variable capturing number of IT employees within respondent's span of influence (nine categories)
10 to 24
1.61
Host Size
H1
Log (total number of employees in the host organization)
3.15
.61
Specialization
S1
Sum of the number of six specialties for which the site has at least one full time staff member (technology evaluation, quality assurance, data administration, methods & tools, metrics and measurement, system testing)
1.88
1.78
Education
E1
The percentage of IT staff at the site holding bachelor's degree
65.6
31.8
E2
The percentage of IT staff at the site holding master's degree
10.0
16.1
C1
Mean importance of seven typical objectives for development (rapidity, cost effectiveness, schedule and budget compliance, high performance systems, high reliability systems, ease of use, ease of change) (7 pt. scales)
5.49
1.05
LearningRelated Scale
Related Knowledge
Diversity
IT Size
Environmental Complexity
- 30 -
Government
G1
Binary variable coded to one for government
Assimilation Stage
A1
Stage achieved as of the time the survey was administered (ranges from 0-not aware to 6-general deployment)
- 31 -
.14
.35
2.00
1.38
REFERENCES Argote, S.; Beckman, S. L. and Epple, D., “The Persistence and Transfer of Learning in Industrial Settings," Management Science, 36, 2 (1990), 140-154. Attewell, P., “Technology Diffusion and Organizational Learning: The Case of Business Computing," Organization Science, 3, 1 (1992), 1-19. Belsley, D. A.; Kuh, E. and Welsch, R. E., Regression Diagnostics: Identifying Influential Data and Sources of Collinearity, Wiley, New York, 1980. Booch, G., Object Oriented Analysis and Design with Applications, 2nd edition, Benjamin/Cummings, Redwood City, CA, 1994. Brancheau, J. C. and Wetherbe, J. C., “The Adoption of Spreadsheet Software: Testing Innovation Diffusion Theory in the Context of End-User Computing," Information Systems Research, 1, 2 (1990), 115-143. Bretschneider, S. and Wittmer, D., “Organizational Adoption of Microcomputer Technology: The Role of Sector," Information Systems Research, 4, 1 (1993), 88-109. Christensen, C. M., “Exploring the Limits of the Technology S-Curve," Production and Operations Management, 1, 4 (1994), 334-366. Cohen, W. M. and Levinthal, D. A., “Absorptive Capacity: A New Perspective on Learning and Innovation," Administrative Science Quarterly, 35, March (1990), 128-152. Cox, B. J., “Planning the Software Industrial Revolution," IEEE Software, November (1990), 25-33. Damanpour, F., “Organizational Innovation: A Meta-Analysis of Effects of Determinants and Moderators," Academy of Management Journal, 34, 3 (1991), 555-590. Dillman, D., Mail and Telephone Surveys, John Wiley & Sons, New York, 1983. Downs, G. W. and Mohr, L. B., “Conceptual Issues in the Study of Innovation," Administrative Science Quarterly, 21, December (1976), 700-714. Ettlie, J. E., “Adequacy of Stage Models for Decisions on Adoption of Innovation," Psychological Reports, 46 (1980), 991-995.
- 32 -
Eveland, J. D. and Tornatzky, L. G. "The Deployment of Technology," in The Processes of Technological Innovation, Tornatzky, L. G. and M. Fleischer (ed.), Lexington Books, Lexington, Massachusetts, 1990, 117-148. Fichman, R. G., "Information Technology Diffusion: A Review of Empirical Research," Proceedings of the Thirteenth International Conference on Information Systems, Dallas, (1992), 195-206. Fichman, R. G., The Assimilation and Diffusion of Software Process Innovations, unpublished Ph.D. dissertation, MIT Sloan School of Management, 1995. Fichman, R. G. and Kemerer, C. F., “Object-Oriented and Conventional Analysis and Design Methodologies: Comparison and Critique," IEEE Computer, October (1992), 22-39. Fichman, R. G. and Kemerer, C. F. "Toward a Theory of the Adoption and Diffusion of Software Process Innovations," in Diffusion, Transfer and Implementation of Information Technology, IFIP TC8 Working Group Conference Proceedings, Champion, PA, Levine, L. (ed.), Elsevier Science Publications, New York, 1993, 23-31. Fornell, C. and Bookstein, F. L., “Two Structural Equation Models: LISREL and PLS Applied to Consumer ExitVoice Theory," Journal of Marketing Research, XIX, November (1982), 440-452. Gopal, A.; Bostrom, R. P. and Chin, W. W., “Applying Adaptive Structuration Theory to Investigate the Process of Group Support Systems Use," Journal of Management Information Systems, 9, 3 (1993), 45-69. Grover, V. and Goslar, M. D., “The Initiation, Adoption and Implementation of Telecommunications Technologies in U.S. Organizations," Journal of Management Information Systems, 10, 1 (1993), 141-163. Gurbaxani, V., “Diffusion in Computing Networks: The Case of BITNET," Communications of the ACM, 33, 12 (1990), 65-75. Horton, L., "Disk-Based Surveys: A New Way to Pick Your Brain," Software Magazine, (February 1990), 76-77. Howard, G. S. and Rai, A., “Promise and Problems: CASE Usage in the US," Journal of Information Technology, 8 (1993), 65-73. Huber, G. P., “Organizational Learning: The Contributing Processes and the Literatures," Organizational Science, 2, 1 (1991), 88-115. Huff, C. C., “Elements of a Realistic CASE Tool Adoption Budget," Communications of the ACM, 35, 4 (1992), 45-54.
- 33 -
Igbaria, M. and Greenhaus, J. H., “Determinants of MIS Employees' Turnover Intentions: A Structural Model," Communications of the ACM, 35, 2 (1992), 35-49. Johansson, J. K. and Yip, G. S., “Exploiting Globalization Potential: U.S. and Japanese Strategies," Strategic Management Journal, 15, 8 (1994), 579-601. Keisler, S. and Sproull, L. S., “Response Effects in the Electronic Survey," Public Opinion Quarterly, 50 (1986), 402-413. Kemerer, C. F., “How the Learning Curve Affects CASE Tool Adoption," IEEE Software, 9, 3 (1992), 23-28. Leonard-Barton, D., “Experts as Negative Opinion Leaders in the Diffusion of a Technological Innovation," Journal of Consumer Research, 11, March (1985), 914-926. Leonard-Barton, D. "Implementing New Production Technologies: Exercises in Corporate Learning," in Managing Complexity in High Technology Industries: Systems and People, Von Glinow, M. A. and S. Mohrman (ed.), Oxford Press, 1989. Lewis, T., “The Dark Side of Objects," IEEE Computer, 27, 12 (1994), 6-7. Liu, C.; Goetze, S. and Glynn, B., "What Contributes to Successful Object-Oriented Learning?," OOPSLA '92 Proceedings, (1992). Löhmoller, J., "LVPLS Program Manual: Latent Variables Path Analysis with Partial Least-Squares," University of Kohn, 1984. Markus, M. L., “Toward a 'Critical Mass' Theory of Interactive Media: Universal Access, Interdependence and Diffusion," Communications Research, 14, 5 (1987), 491-511. Meyer, A. D. and Goes, J. B., “Organizational Assimilation of Innovations: A Multilevel Contextual Analysis," Academy of Management Journal, 31, 4 (1988), 897-923. Mitchell, D. L., A Multivariate Analysis of the Effects of Gender and Computer vs Paper/Pencil Mode of Administration on Survey Results, Ph.D. dissertation, UMI DAI Vol. 54, Issue 09A, p. 3247, pub #9403829, Louisiana Tech University, 1993. Nelson, R. and Winter, S., An Evolutionary Theory of Economic Change, Harvard University Press, Cambridge, MA, 1982. Nilakanta, S. and Scamell, R. W., “The Effect of Information Sources and Communication Channels on the Diffusion of an Innovation in a Data Base Environment," Management Science, 36, 1 (1990), 24-40.
- 34 -
Pennings, J. M. and Harianto, F., “Technological Networking and Innovation Implementation," Organization Science, 3, 3 (1992), 356-382. Prescott, M. B. and Conger, S., “Information Technology Innovations: A Classification by IT Locus of Impact and Research Approach," forthcoming in Data Base (1995). Rice, R. and Rogers, E., “Reinvention in the Innovation Process," Knowledge: Creation, Diffusion, Utilization, 1, 4 (1980), 499-514. Rogers, E. M., Diffusion of Innovations, 3rd edition, The Free Press, New York, 1983. Rumbaugh, J.; Blaha, M.; Premerlani, W.; Eddy, F. and Lorensen, W., Object-Oriented Modeling and Design, Prentice-Hall, Englewood Cliffs, NJ, 1991. Saltzman, A., “Improving Response Rates in Disk-by-Mail Surveys," Marketing Research, 5, 3 (1993), 32-39. Sawtooth (1992) "Ci3 Update", Sawtooth News, 8, 2, Sawtooth Software, Evanston, Illinois. Slitz, J. and Mintz, J., "Object Technology 1993-2000: Trends and Expectations," Object Management Group Report, 1993. Swanson, E. B., “Information Systems Innovations Among Organizations," Management Science, 40, 9 (1994), 1069-92. Tornatzky, L. G.; Eveland, J. D.; Boylan, M. G.; Hetzner, W. A.; Johnson, E. C. et al. (ed.)••
The Process of
Technological Innovation: Reviewing the Literature, National Science Foundation, Washington D. C., 1983. Tornatzky, L. G. and Klein, K., J., “Innovation Characteristics and Innovation Adoption-Implementation: A MetaAnalysis of Findings," IEEE Transactions on Engineering Management, EM-29, 1 (1982), 28-45. Venkatraman, N. and Ramanujarn, V., “Measurement of Business Economic Performance: An Examination of Method Convergence," Journal of Management, 13, 1 (1987), 109-122. Wildt, A. R.; Lambert, Z. V. and Durand, R. M., “Applying the Jackknife Statistic in Testing and Interpreting Canonical Weights, Loadings and Cross-Loadings," Journal of Marketing Research, XIX, February (1982), 99-107. Wold, H. "Systems Under Indirect Observation Using PLS," in A Second Generation of Multivariate Analysis, Volume 1: Methods, Fornell, C. (ed.), Preager, New York, 1982, 325-347.
- 35 -
Zaltman, G.; Duncan, R. and Nolbeck, J., Innovations and Organizations, John Wiley & Sons, New York, 1973. Zmud, R. W., “Diffusion of Modern Software Practices: Influence of Centralization and Formalization," Management Science, 28, 12 (1982), 1421-1431. Zmud, R. W., “An Examination of 'Push-Pull' Theory Applied to Process Innovation in Knowledge Work," Management Science, 30, 6 (1984), 727-738.
- 36 -