Feb 1, 2000 - We describe a web content distribution application called Aphid, which .... Cyber-entities use their energy units to buy resources from the Bio-net platform. .... Aphid cyber-entities are hosted by Bio-net platforms, which may.
The Bio-Networking Architecture: A Biologically Inspired Approach to the Design of Scalable, Adaptive, and Survivable / Available Network Applications Technical Report 00-03 Department of Information and Computer Science, University of California, Irvine Michael Wang and Tatsuya Suda {mwang, suda}@ics.uci.edu February 1, 2000
Abstract We believe that the challenges faced by future network applications, such as scalability, adaptability, and survivability/availability have already been overcome by large scale biological systems and that future network applications will benefit by adopting key biological principles and mechanisms. The Bio-Networking Architecture is a paradigm as well as middleware that enables the construction and deployment of scalable, adaptive, and survivable/available applications. In the Bio-Networking Architecture, applications are constructed using a collection of autonomous mobile agents, called cyber-entities. A cyber-entity is analogous to an individual bee in the biological world. Like their biological counterparts, cyber-entities follow biological principles and contain biological mechanisms. The desirable characteristics of an application emerge from the collective actions and interactions of its constituent cyber-entities. We describe a web content distribution application called Aphid, which was constructed using the Bio-Networking Architecture. Through simulations, we show that Aphid adapts to changing user demand and location. Aphid’s scalability and survivability/availability are also demonstrated through simulations.
1
1. Introduction It is not difficult to imagine a future where billions of people regularly access applications running inside the global network as part of their daily lives. To make this future a reality, network applications must overcome three critical challenges. First, they must scale to handle the enormous demand placed upon them. Second, they must adapt to dynamic user demand and network conditions. Finally, network applications must survive partial failures and remain available to their users. Over millions of years of evolution, large scale biological systems, such as the bee or ant colony, have developed mechanisms that allow them to scale, adapt, and survive. For example, the bee colony [16] is able to scale to a large number of bees because all activities of the hive are carried out without centralized control. Bees act autonomously, influenced by local conditions and local interactions with other bees. In hive construction, there is no master bee that controls the construction of the hive. Bees work autonomously, guided only by the structure of the partially completed hexagonal cells around them. The bee colony also adapts to dynamic conditions, often to optimize its food gain relative to energy expenditure. When the amount of honey in the hive is low, a large number of food gathering bees leave the hive to gather nectar from the flowers in the area. When the hive is nearly full of honey, most bees remain in the hive and rest. The bee colony is survivable because it is not dependent on any single bee, not even the queen bee. Therefore, the colony can still survive after a predator kills a number of bees. In fact, the desirable characteristics of the bee colony, scalability, adaptability, and survivability, are not present in any single bee. Rather, they emerge from the collective actions and interactions of all the bees in the colony. We believe that the challenges faced by future network applications have already been overcome in large scale biological systems and that future network applications will benefit by adopting key biological principles and mechanisms. This paper describes our initial efforts at extracting key principles and mechanisms from large scale biological systems and applying them to the design of network applications. The remainder of this paper is organized as follows. The first part of Section 2 describes the biological principles and mechanisms that we have extracted thus far along with an overview of how they are reflected in the Bio-Networking Architecture. The latter part of Section 2 provides a functional description of the Bio-Networking Architecture. Section 3 describes Aphid, a network application constructed using the Bio-Networking Architecture, and Section 4 contains simulation results. Section 5 briefly describes related work. Finally, Section 6 concludes with a discussion of future work.
2
2. Bio-Networking Architecture The Bio-Networking Architecture is a paradigm as well as middleware that enables the construction and deployment of scalable, adaptive, and survivable/available applications. The paradigm is inspired by the principles and mechanisms that allow biological systems to scale, adapt, and survive. We believe that network applications that adopt this paradigm will also exhibit the beneficial characteristics of biological systems. The middleware follows biological principles and contains biological mechanisms. It consists of two major components, cyberentities and Bio-net platforms. Cyber-entities are autonomous mobile agents, which are used to construct network applications. Bio-net platforms provide an execution environment for the cyber-entities. In Section 2.1, we describe key biological principles and mechanisms along with how they are reflected in both the paradigm and middleware of the Bio-Networking Architecture. The purpose of this subsection is to provide a broad overview of the BioNetworking Architecture. Section 2.2 provides a functional description of the middleware components of the BioNetworking Architecture.
2.1
Biological principles and mechanisms After surveying different types of large scale biological systems [4] [5] [7] [8] [15] [16], we have extracted
a number of principles and mechanisms that enable them to scale, adapt, and survive. We are continuing our study of large scale biological systems in order to find other principles and mechanisms. However, we believe the biological principles and mechanisms that we have extracted thus far provide an adequate basis for our initial work. In the paragraphs below, we briefly describe these biological principles and mechanisms along with how they are reflected in the paradigm and middleware of the Bio-Networking Architecture. Emergence. Many desirable characteristics of large scale biological systems, including scalability, adaptability, and survivability, are not present in any single biological entity. Instead, desirable characteristics emerge from a group of interacting biological entities. Therefore, in the Bio-Networking Architecture, applications are constructed using multiple autonomous mobile agents, called cyber-entities (described in Section 2.2.2). The desirable characteristics of applications, such as scalability, adaptability, and survivability/availability, emerge from multiple interacting cyber-entities. Autonomous actions based on local information and local interactions. Individual biological entities in large scale biological systems act autonomously. They may be influenced by conditions in the local environment or by interactions with a limited number of other biological entities; however, there is no “master” entity that collects information and controls the actions of others. In the Bio-Networking Architecture, cyber-entities also act 3
autonomously based on local information and local interactions with other cyber-entities. “Local” may be interpreted as both spatially adjacent and numerically limited. For example, a cyber-entity may obtain information regarding the Bio-net platforms that are adjacent to the Bio-net platform it is currently on (spatially adjacent) and information regarding a few other Bio-net platforms that are in distant parts of the network (numerically limited). Similarly, a cyber-entity can interact with other cyber-entities on the same Bio-net platform as itself (spatially adjacent) and with a limited number of other cyber-entities on possibly distant Bio-net platforms (numerically limited). We believe that autonomous cyber-entities using local information and local interactions greatly enhance the scalability of an application because they can be replicated throughout the network. Birth and death as expected events. Biological entities regularly die from various causes, e.g. starvation, old age, or predation. However, the biological system survives because the death of biological entities is compensated by the birth of new biological entities. In the Bio-Networking Architecture, applications are also survivable because they are constructed using multiple cyber-entities that can replace each other. When a cyberentity crashes or dies, other cyber-entities reproduce to maintain the cyber-entity population, keeping the application available to users. (Birth and death also has a role in natural selection and evolution, which are described below.) Energy and adaptation. In the biological world, biological entities adapt their actions to maximize their energy gain while minimizing their energy expenditure. Biological entities that cannot collect enough energy to support their normal life functions will die of starvation. In the Bio-Networking Architecture, cyber-entities collect energy1 from human users or other cyber-entities, but they must also give energy to Bio-net platforms (described in Section 2.2.1) in order to run. Like biological entities, cyber-entities also try to maximize their energy gain from users while minimizing energy expenditure to the Bio-net platforms. If a cyber-entity exhausts its energy units, it will not be allowed to run by the Bio-net platform, i.e. it dies of starvation. Because energy plays an important role in the lives of cyber-entities, cyber-entities (and hence, the applications that they form) are forced by energy considerations to adapt to user demand and the network environment. Natural selection and evolution. In the biological world, evolution occurs as a result of genetic diversity (created by crossover and mutation) and natural selection. Crossover, mutation, natural selection, and evolution are also present in the Bio-Networking Architecture. When a cyber-entity reproduces with another cyber-entity, their
1 In the Bio-Networking Architecture, energy is equivalent to money. However, the Bio-Networking Architecture does not depend on a heavy weight electronic cash system to handle the energy/money or to prevent cheating. There are light weight techniques that reduce the incentive to cheat or reduce the risk of fraud. For example, energy units can be made almost worthless (e.g. 1 energy unit = 1/10000 of a cent). Strong security measures are used on large transactions only. Energy units can also represent something valuable (e.g. frequent flyer miles, access to services or resources) and yet be not redeemable for money. A complete discussion of light weight techniques to handle energy/money in the Bio-Networking Architecture is beyond the scope of this paper.
4
behaviors (described in Section 2.2.2.2) randomly recombine (crossover) to form the child’s behaviors. The child’s behaviors may also contain mutations. Natural selection occurs because cyber-entities with no energy units are not allowed to run (they die), and cyber-entities with large amounts of energy units have more opportunities to reproduce. Therefore, if a cyber-entity’s behaviors enable it to collect and store more energy than other cyberentities (meaning that it is more useful and/or efficient), it will live longer and give birth to more cyber-entities similar to itself. Over time, the cyber-entities that comprise an application will evolve to behaviors that are more useful and/or efficient. Evolution is another way that applications based on the Bio-Networking Architecture adapt to the network environment.
2.2
Biological middleware The previous subsection provided a broad overview of how biological principles and mechanisms are
reflected in the Bio-Networking Architecture. This subsection provides details about how those biological principles and mechanisms are implemented in the biological middleware through a functional description of the two major components, the Bio-net platform and the cyber-entity.
2.2.1. Bio-net platform Bio-net platforms provide an environment for cyber-entities to exist in. A Bio-net platform is any networked hardware device that runs a Java Virtual Machine (JVM) and the Bio-Networking platform software. The Bio-Networking platform software contains functionality and services not present in the JVM. These functionality and services follow the biological principles described in Section 2.1 and are described below. Resource Control: All resources on a Bio-net platform, e.g. CPU time, memory, disk space, network bandwidth, must be purchased with energy units. When a cyber-entity is created/born, it is given energy units by the system administrator who created it or by its parent cyber-entities. During its lifetime, a cyber-entity may receive energy units from human users or other cyber-entities. Cyber-entities use their energy units to buy resources from the Bio-net platform. If a cyber-entity exhausts its energy units, it will not be allowed to execute on the platform and the disk and memory resources that contain its code and data will be freed, i.e. the cyber-entity dies of starvation. Cyber-entity Scheduling: Assuming that a cyber-entity has purchased sufficient resources, the platform software schedules the cyber-entity for execution under two conditions: (1) when a network message arrives for the cyber-entity and (2) on the expiration of the cyber-entity’s periodic timer. The second condition is necessary because cyber-entities need to execute even if they don’t receive any network messages. To reduce the risk of
5
synchronization among cyber-entities, the periodic timers of different cyber-entities are separated by random time intervals. System Services: The platform software provides system level services that cyber-entities cannot perform directly, for example, migration and reproduction. Since these services consume CPU and network resources, cyber-entities must pay the platform software to receive these services. Information Services: The platform software also provides information about the local environment to all cyber-entities on the platform. Some examples the information provided by the platform software are the location of the platform, a list of cyber-entities on the platform, and a list of neighboring Bio-net platforms that the cyber-entity can migrate to. Note that the platform software does not provide global information, such as a list of all other cyberentities in the network or the locations of all other Bio-net platforms.
2.2.2. Cyber-entity The cyber-entity is an autonomous mobile agent, analogous to an individual bee in the biological world. Like their biological counter parts, cyber-entities follow biological principles and contain biological mechanisms. In the Bio-Networking Architecture, an application is constructed using multiple interacting cyber-entities. The cyberentity can be logically organized into attributes, behaviors, and body. These three parts are described below.
2.2.2.1.
Attributes The attributes portion consists of variables that describe the cyber-entity. Some examples are ownerName,
uniqueID, timeBorn, and energyLevel. These variables have remotely accessible interfaces that allow human users or other cyber-entities to read their values. We have listed a very small sample of the attributes that a cyber-entity may have. We believe that a rich set of attributes is critical to enabling and promoting interesting interactions among cyber-entities.
2.2.2.2.
Behaviors Cyber-entity behaviors are blocks of executable code (called methods in object oriented terminology, or
functions in the C Programming Language). Behaviors implement the functionality of a cyber-entity and control its autonomous actions. Cyber-entities can have an arbitrary number of behaviors. Some possible behaviors are briefly described below.
6
Decide: This is behavior is invoked by the Bio-Networking platform software when the cyber-entity’s periodic timer expires. This behavior simply invokes all the other behaviors of the cyber-entity except for receive message. Expend Energy: This behavior enables the cyber-entity to use its energy units to buy resources from the Bio-net platform. Migration: This behavior enables the cyber-entity to determine whether it should migrate and which Bionet platform to migrate to. When a cyber-entity decides to migrate to another Bio-net platform, it calls the migration service of the Bio-net platform to perform the actual migration. Reproduction: Cyber-entities can reproduce sexually or asexually. This behavior enables a cyber-entity to determine whether it should reproduce, and in the case of sexual reproduction, which cyber-entity to reproduce with. In sexual reproduction, the child’s behaviors are formed by randomly recombining (crossover) the parents’ behaviors. The child’s behaviors may also contain mutations. In asexual reproduction, only mutation of the child’s behaviors is possible. In both sexual and asexual reproduction, the parent or parents give some of their energy units to the child. They also pay energy units to the Bio-net platform for performing the reproduction service. Note that energy is conserved during reproduction, i.e. no energy is created as a result of reproduction. Receive Message: This behavior is invoked by the Bio-net platform software when a network message arrives for the cyber-entity. The receive message behavior does minimal processing of the incoming message. It simply looks at the message header and passes it to the appropriate behavior (e.g. relationship or service, described below). Relationships: This behavior enables the cyber-entity to establish and maintain a limited number of relationships with other cyber-entities. Cyber-entities establish relationships under a variety of conditions. When a cyber-entity detects another cyber-entity on its Bio-net platform, it can send a relationship establishment request to that cyber-entity. Two cyber-entities can be introduced to each other by a third cyber-entity, and parent cyberentities establish relationships with their child cyber-entity when it is born. Once a relationship is established between two cyber-entities, periodic relationship maintenance messages are exchanged. These messages contain some information about the sender, such as its current location, energy level, age, and number of relationships it has. Cyber-entities use their relationships for a variety of purposes. A cyber-entity can detect the death of another cyberentity when it fails to respond to a certain number of relationship maintenance messages. A cyber-entity can also gain information about the cyber-entities that it has relationships with because the relationship maintenance messages contain some information about the sender. Consistent with the local interactions principle described in 7
Section 2.1, cyber-entities have a limited number of relationships and therefore can only interact with a limited number of other cyber-entities. Service: This behavior enables the cyber-entity to perform a service for human users or other cyberentities. One possible service behavior is accepting requests for web pages and then delivering the web pages using the HTTP protocol. The recipient of the service must pay the cyber-entity with energy units. Death: In Section 2.2.1, we described how the resource control function of the Bio-net platform kills cyber-entities when their energy units are exhausted. However, the death behavior enables a cyber-entity to determine whether it should die before it exhausts its energy units. For example, a cyber-entity may choose to die because of old age or lack of use by human users. When a cyber-entity behavior is invoked, it does not necessarily mean that the associated action will be performed. For example, when the reproduction behavior is invoked, the reproduction behavior may decide not to reproduce. Behaviors make their decisions after evaluating their factors, weights, and thresholds. Factors are blocks of executable code that return a numerical value based on local information or local interactions. Weights and thresholds are simply numerical values. A behavior may have an arbitrary number of factors and weights, but it can have only one threshold. A behavior will decide to perform its associated action if the sum of the products of its factors and weights is above the threshold. Factor Name/ Threshold reproductionRequestRate reproductionStoredEnergy reproductionThreshold
Weight/ Threshold Value 1.0 0.8 9.9
Table 1: Factors, weights, and thresholds of example reproduction behavior As an example, consider the reproduction behavior of a cyber-entity. The reproduction behavior may consist of a reproductionRequestRate factor with a weight of 1, a reproductionStoredEnergy factor with a weight of 0.8, and a reproduction threshold of 9.9. These factors, weights, and threshold are summarized in Table 1. When the reproduction behavior is invoked, it first calls the reproductionRequestRate factor, which returns a value from 0 to 20 based on the cyber-entity’s request rate. The return value of this factor is multiplied by its weight (1). The reproduction behavior then calls the reproductionStoredEnergy factor, which returns a value between –100 and 0 based on the cyber-entity’s energy level. The return value of this factor is multiplied by its weight (0.8). The products are summed, and if the sum is greater than the reproduction threshold (9.9), the reproduction behavior will call the platform software to perform the reproduction service. Because the reproductionRequestRate factor returns positive values, this factor encourages the reproduction behavior. Conversely, because the 8
reproductionStoredEnergy factor returns negative values, it inhibits the reproduction behavior. A factor may also return both positive and negative values. Implementing a cyber-entity behavior using factors, weights, and thresholds has two important advantages over an implementation that uses a single block of executable code. First, by adding different factors or changing the weights and thresholds, a behavior can be easily enhanced to adapt to different conditions. For example, by adding the reproductionLowPopulation3 factor, which encourages the reproduction behavior when the number of relationships a cyber-entities has is below 2, the reproduction behavior is enhanced to adapt to the cyber-entity population. Second, crossover and mutation of behaviors can be easily implemented when behaviors are composed with factors, weights, and thresholds. Crossover randomly combines the factors, weights, and thresholds from the parents’ behaviors to form the child’s behaviors. Mutation simply changes the weights or thresholds. Our current design allows only the reproduction, migration, and death behaviors to be implemented using factors, weights, and thresholds. The other behaviors, i.e. decide, expend energy, receive message, relationships, and service, are implemented as a single block of executable code. We plan to modify our design so that other behaviors can also be implemented using factors, weights, and thresholds.
2.2.2.3.
Body The body portion of the cyber-entity consists of data. The data stored in the body of a cyber-entity depend
on the service behavior of that cyber-entity. For example, if the service behavior of a cyber-entity is to serve web pages, then its body will contain web pages. When a cyber-entity reproduces asexually, the child’s body is an exact copy of the parent’s body. When two cyber-entities reproduce sexually, the child’s body may contain an exact copy of either parent’s bodies or both parents’ bodies.
3. Aphid To demonstrate how the Bio-Networking Architecture can be used to construct a network application, we have designed Aphid. Aphid is a scalable, adaptive, and survivable/available web content distribution application. The Aphid application consists of multiple Aphid cyber-entities. Aphid cyber-entities have all of the behaviors described in Section 2.2.2.2. In particular, Aphid cyber-entities have a service behavior that accepts requests for web pages and delivers them using the HTTP protocol. The body of an Aphid cyber-entity may contain all the web pages or just the most popular pages of a web site. Aphid cyber-entities are hosted by Bio-net platforms, which may be deployed throughout the Internet. We believe that Aphid’s scalability, adaptability, and survivability/availability
9
features will ensure that web pages are always available and delivered to users with minimal delay regardless of the amount of user demand. Section 4 provides simulation results for Aphid.
4. Simulation Results In order to gain a better understanding of Aphid and of the Bio-Networking Architecture, we have developed a discrete event simulator using the Java programming language. Although the scenarios used in these simulations are specific to Aphid, we believe that these results also provide a general understanding of the BioNetworking Architecture.
4.1
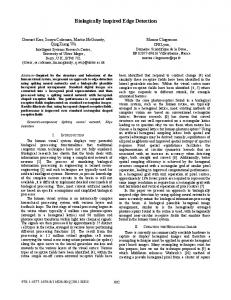
Simulation Parameters The simulation results are based on the 50 node network topology shown in Figure 1. The topology
represents a very simplified version of the global Internet. Each node in the network is a Bio-net platform capable of hosting cyber-entities. Nodes are connected by links. Links have weights that represent the length of the link. Before the simulation begins, the simulator builds a routing table for each node using a distance vector algorithm. During the simulation, the routing tables do not change. Link congestion and propagation delays are not modeled.
1
3
150
10
41
4 Number of Users
9
Selected nodes are labeled with their ID’s
100
50
0 3am
Figure 1: Network Topology used
6am
9am
noon
3pm
6pm
9pm
Figure 2: User demand during simulation
Each simulation run simulates 24 hours of real time. The number of users during the simulation runs changes and is shown in Figure 2. Users are placed at randomly selected nodes in the network. Users request one web page per second. Each user requests goes to the Aphid cyber-entity closest to the user. In these simulations, “closeness” is determined by of the number of network hops2. Ties are broken randomly. When the request is made, users pay a fixed amount of energy units (40) to the cyber-entity. When the request is completed, the user may pay an additional amount of energy units, up to a maximum of 360. The exact amount depends on the promptness of the 2
This feature can be implemented by sending user requests to a centralized server which redirects the requests to the closest cyber-entity. However, this centralized server could become a bottleneck to scalability and a single point of failure, two
10
service and the number of network hops between the user and the cyber-entity. (The algorithms for determining these additional payments will be described in Sections 4.2 and 4.4) In the simulations, the bodies of all Aphid cyber-entities contain a copy of the same web page. Each Aphid cyber-entity pays 700 energy units per second to the Bio-net platform they are on. The 700 energy units buys enough resources (CPU, memory, and network bandwidth) for the cyber-entity to service 20 requests per second. Each cyber-entity has a work queue, which holds the user requests received by the cyber-entity. If a cyber-entity receives fewer than 20 requests per second and the work queue is empty, then the request is serviced with a delay of 50 milliseconds. Otherwise, all incoming requests are placed in the work queue, and the request is serviced with a delay of 50 milliseconds multiplied by its position in the queue. For simplicity, cyber-entities are not allowed to buy more or less resources. If a cyber-entity reproduces asexually, it must pay an additional 525 energy units. If it migrates to an adjacent Bio-net platform, it must pay an additional 11,200 energy units3. In order to simplify the simulations presented in this paper, cyber-entities reproduce asexually without mutation of the behaviors. Sexual reproduction, crossover, and mutation are not simulated. As a result of these simplifications, evolution does not occur. In these simulations, a parent cyber-entity gives a minimum of 2.5 million energy units to its child. If the parent has more than 2.5 million energy units, it gives an additional 10% of its energy units to the child. Each cyber-entity has a maximum of 6 relationships.
4.2
Adaptation to changing user demand As the number of users in the network changes throughout the day, it is desirable for the Aphid cyber-
entities to adapt their population to the number of users. To demonstrate the Aphid cyber-entity’s ability to adapt their population to changing user demand, three separate simulations were conducted using three different types of cyber-entities: r1, r2d3, and best. These cyber-entities are described below.
problems which the Bio-Networking Architecture attempts to overcome. Therefore, we are developing additional cyber-entity behaviors that would help users find the closest Aphid cyber-entity. 3 These figures are based on the following assumptions: Each energy unit is worth 1 millionth of one dollar. We assume that the cost and support for one Bio-net platform is $50,000, which is amortized over 2 years. A maximum of 77 cyber-entities can be hosted on one Bio-net platform. Two Bio-net platforms (and hence 154 cyber-entities) share a 155Mbps OC-3 link, which costs $200,000 per month. The total cost for 1/77th of a Bio-net platform and 1 megabit of bandwidth (1/155th of an OC-3 link) is about 548 millionth of a dollar per second, which is sold to the cyber-entities at 700 energy units per second. The difference of 152 millionth of a dollar is profit for the owner of the Bio-net platform. We assume each web page is 50 kbits, and since each cyber-entity purchased 1Mbps of bandwidth, it can service 20 requests per second. We assume that CPU and memory are not limiting factors in servicing a request. Asexual reproduction costs less than migration because asexual reproduction requires only CPU time to create a child cyber-entity while migration requires CPU time and network bandwidth to transmit the cyber-entity to the destination of the migration.
11
The r1 cyber-entity4 has all the behaviors described in Section 2.2.2.2 except for migration and death. The factor, weight, and threshold for its reproduction behavior are listed in Table 2. The reproductionRequestRate factor encourages the reproduction behavior if the cyber-entity’s request rate is high. (See Section 2.2.2.2 for an explanation of how factors, weights, and thresholds are used in a behavior.). Factor Name/ Threshold reproductionRequestRate reproductionThreshold
Weight/ Threshold Value 1.0 9.9
Table 2: r1 cyber-entity We developed the r2d3 cyber-entity by studying the deficiencies of the r1 cyber-entity and experimenting with different factors, weights, and thresholds. Due to lack of space, those steps are omitted from this paper. The r2d3 cyber-entity has all the behaviors described in Section 2.2.2.2 except for migration. The factors, weights, and thresholds for its reproduction and death behaviors are listed in Table 3. In the r2d3 cyber-entity’s reproduction behavior, the reproductionRequestRatePredictive factor encourages the reproduction behavior if the cyber-entity’s request rate is high and/or if the rate of change in the request rate is increasing. The reproductionStoredEnergy factor strongly inhibits the reproduction behavior when the cyber-entity’s energy level is below the minimum amount that it must give to its child. Without this factor, cyber-entities sometimes reproduce and then immediately die of energy starvation themselves. In the r2d3 cyber-entity’s death behavior, the deathRequestRate factor encourages the death behavior if the cyber-entity’s request rate is low. The deathAge factor inhibits the death behavior if the cyber-entity was recently born. This gives a newly born cyber-entity time to estimate its request rate. Without this factor, the deathRequestRate factor would often cause newly born cyber-entities to die since a newly born cyber-entity has a request rate of 0. The deathPopulation1 factor inhibits the death behavior if the cyber-entity has no relationships with any other cyber-entities. (When a cyber-entity has no relationships with any other cyberentities, it indicates that this cyber-entity is the only cyber-entity in the network). This factor allows5 the r2d3 cyberentities to maintain a minimum population of 1. Without this factor, the deathRequestRate factor would cause all cyber-entities to die when there are very few or no users in the network.
4
This cyber-entity got its name because it has a reproduction behavior (“r”) with 1 factor (“1”) in it. This naming scheme is not a part of the Bio-Networking Architecture, nor does it fully specify all the behaviors that a cyber-entity has. For example, the r1 cyber-entity also has the decide, expend energy, receive message, relationships, and service behaviors. This naming scheme is simply a compact way of referring to the different cyber-entities used in the simulations. 5 The deathPopulation1 factor cannot prevent the death of the last cyber-entity if it exhausts its energy units. If the last cyberentity exhausts its energy units, a system administrator may have to create a new cyber-entity.
12
Factor Name/ Threshold reproductionRequestRatePredictive reproductionStoredEnergy reproductionThreshold deathRequestRate deathAge deathPopulation1 deathThreshold
Weight/ Threshold Value 1.0 0.8 9.9 1.0 1.0 10.0 9.0
Table 3: r2d3 cyber-entity Both the r1 and r2d3 cyber-entities follow the biological principles of the Bio-Networking Architecture. In particular, all of the factors used by these two cyber-entities are based on local information, e.g. the cyber-entity’s request rate, the cyber-entity’s energy level, the number of relationships that the cyber-entity has. The r1 and r2d3 cyber-entities do not have global information, e.g. the overall user request rate, the energy level of all other cyberentities, the number of relationships that all other cyber-entities have. Best cyber-entities provide an upper bound on the performance of any adaptation algorithm. Best cyberentities do not follow the biological principles of the Bio-Networking Architecture. The simulator uses its global information on the number and location of users to centrally control the number and location of best cyber-entities. When the number of users increases, the simulator inserts additional best cyber-entities in the network. When the number of users decreases, the simulator removes best cyber-entities. When the location of the users in the network change, the simulator changes the location of the best cyber-entities to minimize the number of hops between the users and best cyber-entities. The simulator does not pay any energy units when it inserts, removes, or moves best cyber-entities. Best cyber-entities pay 700 energy units per second for the resources on a Bio-net platform. Because the simulator can react instantly to global information and because it does not pay energy units for controlling the best cyber-entities, the adaptation performance of the best cyber-entities represent the upper bound on any adaptation algorithm. At the beginning of each simulation run, a single cyber-entity (r1, r2d3, or best) with 300 million energy units is placed on node 9 in the network. (Since the focus of this subsection is on adaptation to changing user demand, the location of the cyber-entity does not affect the results). Figure 3 shows the cyber-entity population during the simulation runs. The cyber-entity population graph provides a basic picture of the cyber-entity’s ability to adapt to changing user demand. Because each cyber-entity can service a maximum of 20 requests per second, the shape of the population curve (Figure 3) should match the shape of the user demand curve (Figure 2). In Figure 3, all three types of cyber-entities reproduce in order to adapt to the increasing user demand at 7am. However, when the user demand decreases at 10am, the r1 cyber-entities do 13
not adapt their population to the decreasing user demand. This is because they lack death behaviors and have collected enough energy from users to avoid death from starvation. In contrast to the r1 cyber-entity, the r2d3 cyber-entities are able to adapt their population to the decreasing user demand because they have death behaviors. Specifically, the deathRequestRate factor in the death behavior causes most r2d3 cyber-entities to die when the user demand decreases, while the deathPopulation1 factor inhibits the death behavior of the last r2d3 cyber-entity. The population curve for the best cyber-entities represents the optimal population curve because the simulator can determine exactly how many best cyber-entities are needed throughout the simulation period. The shape of the population curves in Figure 3 show that the r2d3 cyber-entities are able to adapt to increasing and decreasing user demand, while the r1 cyber-entities are not able to adapt to decreasing user demand. 10
10
8
r1 r2d3 best
delay in seconds
Number of Cyber-entities
8
6
4
2
r1 r2d3 best
6
4
2
0
0 3am
6am
9am
noon
3pm
6pm
9pm
6am
Figure 3: Cyber-entity population
7am
8am
9am
10am
11am
noon
Figure 4: Average delay experienced by users
Figure 4 shows the average delay experienced by users between 6am and noon. The average user delay during the other times of the simulation period is very low (less than 0.1 seconds). Average user delay characterizes the timeliness of the cyber-entities’ adaptation. When user demand is increasing, cyber-entities must reproduce in a timely manor. Otherwise, the number of user requests will temporarily exceed the service capacity of the cyberentities, causing higher delays. Figure 4 shows that when the r2d3 cyber-entities are used, users experience lower delay than when the r1 cyber-entities are used. The lower delay is due to the reproductionRequestRatePredictive factor in the r2d3 cyber-entities’ reproduction behaviors. This factor causes the r2d3 cyber-entities to reproduce more quickly when the request rate is high and increasing. The r1 cyber-entities have the reproductionRequestRate factor in their reproduction behaviors, which does not consider the rate of change in the cyber-entity’s request rate. When best cyber-entities are used, the user delay is always less than 0.1 seconds because the simulator instantly inserts additional best cyber-entities when they are needed. The lower delay values for the r2d3 cyber-entities indicates that the r2d3 cyber-entities adapt to increasing user demand in a more timely manor than the r1 cyberentities.
14
Table 4 compares the r1, r2d3, and best cyber-entities by calculating the utility they generate. Utility is defined as the total energy collected by all the cyber-entities minus the total energy expended by them (for resources, reproduction, and migration) over the simulation period. Cyber-entities collect energy from users, who give a minimum of 40 energy units per request. If the request is serviced with a delay of 1 second or less, the user gives the cyber-entity an additional 160 energy units. This additional energy amount decreases linearly from 160 (when the delay is 1 second or less) to 40 (when the delay is 7 seconds) and then to 0 (when the delay is 120 seconds or more). Basically, when a user’s request is serviced with lower delay, the user is happier and pays more energy units. However, in order to ensure quicker service to users, a larger population of cyber-entities is needed, and a larger population translates to more energy expended. When the utility is high, it indicates that the cyber-entities adapted well to both user demand and network environment by keeping users happy and minimizing resource expenditure. Table 4 shows that the r2d3 cyber-entities achieved a good balance of adapting to user demand and minimizing resource cost, generating 94.9% of the utility of the best cyber-entities.
r1 r2d3 best
Energy collected
Energy expended
Utility
399.3 402.3 403.1
399.5 127.1 113.2
-0.2 275.2 290.0
Percent from best na 94.9 100.0
Table 4: Utility, in millions of energy units
4.3
Increasing Survivability/Availability In the previous section, we described the r2d3 cyber-entity, which adapted well to changing user demand.
However, there was only one r2d3 cyber-entity during most of the simulation period (see Figure 3). If that cyberentity is killed or crashes, the web page that it disseminates will become unavailable. From a biological perspective, the death of the last r2d3 cyber-entity represents the extinction of the r2d3 cyber-entity population. To increase the survivability of the r2d3 cyber-entity population and hence the availability of the web page they disseminate, we can modify the r2d3 cyber-entities so that they maintain a given minimum population. In the simulation results shown in this subsection, the minimum population size was chosen to be 3. This population size was chosen arbitrarily; it can be set to any number depending on the requirements of the application. By maintaining a minimum population of 3, the cyber-entity population will survive and the web page they disseminate will remain available even after 2 cyber-entities die or crash. We made the following modifications to the r2d3 cyber-entity so that they will maintain a minimum population of 3. First, we add a reproductionPopulation3 factor, which encourages reproduction when the number 15
of relationships that a cyber-entity has is below 2 (indicating that the total population of cyber-entities is below 3). Second, we replace the deathPopulation1 factor with the deathPopulation3 factor. The deathPopulation3 factor inhibits the death behavior when the number of relationships that a cyber-entity has is below 2. Finally, we add the deathGroupEnergyWeakness factor. This factor encourages the death behavior if a cyber-entity is one of the weaker cyber-entities in its group, i.e. it has less energy than most of the other cyber-entities it has relationships with. Conversely, this factor inhibits the death behavior if the cyber-entity is one of the stronger ones in the group. When user demand decreases, it is important for cyber-entities with lower energy levels to die first because those with higher energy levels can live longer during a period of low user demand. This improved cyber-entity is named r3d4, and the factors, weights, and thresholds for its reproduction and death behaviors are listed in Table 5. Consistent with biological principles, these factors are based only on local information and local interactions. Factor Name/ Threshold reproductionRequestRatePredictive reproductionStoredEnergy reproductionPopulation3 reproductionThreshold deathRequestRate deathAge deathPopulation3 deathGroupEnergyWeakness deathThreshold
Weight/ Threshold Value 1.0 0.8 1.8 9.9 1.0 1.0 10.0 0.3 9.0
Table 5: r3d4 cyber-entity Figure 5 shows the r3d4 cyber-entity population during the entire simulation period, while Figure 6 shows a close-up of the population between 12:00am and 12:10am. The simulation starts at 12:00am with a single r3d4 cyber-entity with 300 million energy units. The reproductionPopulation3 factor encourages this cyber-entity to reproduce, and within 3 minutes, a population of 3 is reached. To demonstrate the survivability feature of the r3d4 cyber-entities, the simulator kills one of the cyber-entities at 12:05am. Cyber-entities detect the death of other cyber-entities when they fail to respond to the periodic relationship maintenance messages. Since the Bio-net platform schedules the cyber-entities for execution at different times, one of the two remaining cyber-entities detects the death first and reproduces (encouraged by the reproductionPopulation3 factor). By 12:07am, a population of 3 is again established. In Figure 5, the cyber-entities reproduce and create a larger population to adapt to increasing user demand at 7am. After 10am, all but 3 cyber-entities die (adapting to a decrease in user demand), and a population of 3 is maintained for the remainder of the simulation run. Because it maintains a minimum population of 3, the r3d4 cyber-entity population can survive even when some cyber-entities are killed or crashes. Therefore, the application created by the cyber-entities will remain available. 16
10
8
8 Number of Cyber-entities
Number of Cyber-entities
10
6
4
2
4
2
0
0 3am
6am
9am
noon
3pm
6pm
9pm
12:00am
Figure 5: r3d4 cyber-entity population
4.4
6
12:05am
12:10am
Figure 6: r3d4 cyber-entity population close-up
Adaptation to the location of users in the network Aphid cyber-entities and users may be located far apart in the network. Therefore, it is desirable for the
Aphid cyber-entities to adapt to the location of the users by migrating towards them. The result of cyber-entity migration is a reduction in the average number of network hops between users and their closest cyber-entities. Generally, a smaller hop count between users and cyber-entities is desirable because it reduces latency and bandwidth usage. To demonstrate the Aphid cyber-entity’s ability to adapt to the location of users in the network, four separate simulations were conducted using four different types of cyber-entities: r3d4m3, r3d4mw, static6, and best. These cyber-entities are described below. We developed the r3d4m3 cyber-entity6 after experimenting with numerous migration factors, weights, and thresholds. This cyber-entity has the same reproduction and death behaviors as the r3d4 cyber-entity described in Table 5 along with a migration behavior containing the factors, weights, and threshold listed in Table 6. The migrationRequestPercentage factor indicates the percentage of the cyber-entity’s total requests that are coming from the direction of a particular neighboring Bio-net platform. The migrationRest factor inhibits the migration behavior if the cyber-entity has migrated recently. The migrationRepulsion factor encourages the cyber-entity to migrate away from its current Bio-net platform if there is another Aphid cyber-entity on the same platform. Consistent with biological principles, these factors are based only on local information. At the beginning of the simulation, a single r3d4m3 cyber-entity with 300 million energy units is placed on node 9.
6
The factors for the migration behavior were much more complicated to design and select than the factors for the reproduction and death behaviors. The factors, weights, and thresholds described in Table 6 are most likely not optimal. However, they are intuitive and produce acceptable performance. One of the ultimate goals of the Bio-Networking Architecture is to place cyberentities with different migration factors, weights, and thresholds in the network at the same time and allow evolution and natural selection to create the optimal cyber-entity.
17
Factor Name/ Threshold
Weight/ Threshold Value 1.0 6.5 9.0 40.0
migrationRequestPercentage migrationRest migrationRepulsion migrationThreshold
Table 6: Migration factors, weights, and threshold for the r3d4m3 cyber-entity The r3d4mw cyber-entity is intended to provide a comparison base for the r3d4m3 cyber-entity. The r3d4mw cyber-entity has a migration behavior that causes it to migrate randomly in the network. It has the same reproduction and death behaviors as the r3d4 cyber-entity. At the beginning of the simulation run, a single r3d4mw cyber-entity with 300 million energy units is placed on node 9. The static6 cyber-entity is actually 6 static cyber-entities that are strategically distributed in the network (on nodes 1, 3, 4, 9, 10, and 41). Static cyber-entities do not migrate, reproduce, or die. They imitate the web servers that are in use today. Locating multiple web servers throughout the network is one possible approach to handling a large numbers of users. These cyber-entities are also used as a comparison base for the r3d4m3 cyber-entity. Best cyber-entities were described in Section 4.2 and are used to provide an approximate upper bound on the performance of any adaptation algorithm. There is a minimum of 3 best cyber-entities throughout the simulation period. This is done to allow fair comparisons between best cyber-entities and the r3d4m3 cyber-entities, which maintain a minimum population of 3. 3.0
Number of Cyber-entities
2.5
Avg. Hop Count
20
static6 r3d4mw r3d4m3 best
2.0
1.5
1.0
static6 r3d4mw r3d4m3 best
15
10
5
0.5
0.0 2am
0 2:30
3am
3:30
4am
6am
Figure 7: Hop count comparison
7am
8am
9am
10am
11am
noon
Figure 8: Cyber-entity population
Figure 7 shows the average hop count from users to the cyber-entity closest to them between 2am and 4am. This time interval (during the non-peak user hours) was chosen because all types of cyber-entities, except for the 6 static cyber-entities, have a population of 3, allowing for a fair comparison of location adaptability. During the peak user hours, the cyber-entity populations are different, making a fair comparison difficult. Figure 7 demonstrates that the migration factors, weights, and thresholds we chose for the r3d4m3 cyber-entities adapt better to the location of the users (as evidenced by the smaller average hop counts) than a simplistic approach, represented by the wandering 18
r3d4mw cyber-entities. The average hop count for best cyber-entities fluctuates between 0.1 and 1.7 for the following reason. Between 2am and 4am, the number of users vary between 0 and 10. When there are 0 to 3 users in the network, the 3 best cyber-entities are placed on the same node as the users, resulting in an average hop count of 0. When there are more than 3 users spread throughout the network, the 3 best cyber-entities cannot be near all the users simultaneously, resulting in an average hop count that is greater than 0. Figure 7 shows that the migration behavior of the r3d4m3 cyber-entities allows them to adapt to the location of the users in the network. Figure 8 shows the number of cyber-entities between 6am and noon. During the other times, the population was 6 for the 6 static cyber-entities and 3 for all the others. By 10am, the population of r3d4m3 cyber-entities has grown to 17 cyber-entities, which is significantly more than the 8 cyber-entities that are required to handle the user demand at that time. (Since each cyber-entity can service 20 requests per second and there a maximum of 150 users at 10am, 8 cyber-entities are sufficient to handle the user demand.) The population of r3d4mw grows to up to 21 cyber-entities by 8am. The excessively large population of r3d4m3 and r3d4mw cyber-entities is caused by geographical imbalance of users. A geographical imbalance occurs when too many users are randomly placed near a cyber-entity. This results in a high request rate at that particular cyber-entity, which causes it to reproduce. The simulator instantly adjusts the locations of the best cyber-entities to prevent user imbalances. Therefore, the population of the best cyber-entities does not exceed 8. The excessively large population of the r3d4m3 cyberentities indicates a deficiency in the cyber-entity’s ability to adapt to changing user location. Further development and refinement of the r3d4m3’s reproduction, death, and migration behaviors are needed to mitigate the effects of the geographical imbalance of users. Table 7 shows the utility generated by the various types of cyber-entities. Utility was defined in Section 4.2. Since we are studying the cyber-entity’s ability to adapt to user location, we modify the amount the users pay the cyber-entities in the following way. In addition to the minimum payment of 40 energy units and the variable additional energy payment of 0 to 160 energy units depending on delay (as described in Section 4.2), users also give an additional amount of energy depending on the hop count to the cyber-entity that serviced their request. This additional energy decreases linearly from 200 (when the hop count is 1 or less) to 0 (when the hop count is 11 or greater). Thus the amount of energy that cyber-entities collect now reflects their ability to adapt to user demand and user location. The second column of Table 7 shows that the r3d4m3 cyber-entities collected more energy than any other type of cyber-entity. The 6 static cyber-entities collected the least energy because users experienced high delays during the peak hours of 7am to 10am. The 6 static cyber-entities simply did not have enough service capacity to 19
handle the 150 users. The r3d4m3 cyber-entities were able to collect more energy than even the best cyber-entities because there were approximately 16 r3d4m3 cyber-entities compared to 8 best cyber-entities during the peak user hours. Therefore, the r3d4m3 cyber-entities had a lower hop count to the users and were able to collect more energy. Even though the r3d4mw cyber-entities had a population of approximately 20 during the peak user hours, they did not collect as much energy as the r3d4m3 cyber-entities because their poor migration behavior (randomly wandering) did not significantly reduce the hop count. The third column of Table 7 shows the amount of energy expended by each type of cyber-entity. The 6 static cyber-entities expended the most energy because there were 6 cyber-entities throughout the simulation period. The best cyber-entities expended the least energy because the simulator inserts and removes the best cyber-entities as needed. The r3d4m3 cyber-entities expended more energy than best because of its excessively large population during the peak user hours. Overall, the r3d4m3 cyber-entities achieved a satisfactory balance between adapting to users and minimizing resource costs, generating 89.7% of the utility of the best cyber-entities. (This figure is lower than the 94.9% achieved by the r2d3 cyber-entities in Section 4.2 because the r3d4m3 cyber-entities had difficulty adapting to the geographical imbalances of users. The r2d3 cyber-entities were studied for their ability to adapt to changing user demand only. Thus they were not exposed to the problem of geographical imbalances of users. ) Energy collected
Energy expended
Utility
370.9 774.9 792.3 790.0
362.1 316.3 279.5 218.0
8.8 458.6 512.8 572.0
static6 r3d4mw r3d4m3 best
Percent from best 0.0 80.2 89.7 100.0
Table 7: Utility, in millions of energy units
4.5
Scalability In the previous subsections, we studied the adaptability and survivability of Aphid cyber-entities when
there are 150 users during the peak hours of 7am to 10am (see Figure 2). In this subsection, we study the scalability of Aphid cyber-entities, specifically the r3d4m3 cyber-entities, by increasing the number of users during the peak hours to 1500. Figure 9 shows the r3d4m3 cyber-entity population when there are 150 and 1500 users during the peak hours. This figure shows that the r3d4m3 cyber-entities are able to scale to a population of 130.
20
140
10
150 user peak 1500 user peak
150 user peak 1500 user peak
120
delay in seconds
Number of Cyber-entities
8
100 80 60
6
4
40 2
20 0
0
6am
7am
8am
9am
10am
11am
noon
6am
Figure 9: r3d4m3 cyber-entity population
7am
8am
9am
10am
11am
noon
Figure 10: Delay comparison
Figure 10 shows the average delay experienced by the users during 6am and noon. The average user delay during the other times of the simulation run was very low. As explained in Section 4.2, the average user delay characterizes the timeliness of the cyber-entity’s adaptation. When there are 1500 users during the peak user hours, there is very high delay between 7am and 8am. After 8am, the average delay is reduced to less than 5 seconds. The period of high delay between 7am and 8am indicates that the r3d4m3 cyber-entities did not adapt in a timely manner when 1500 users appeared in the network. This does not represent a fundamental limitation in the scalability of Aphid or the Bio-Networking Architecture. Rather, the initially high delay is caused by the fact that the r3d4m3 cyber-entities cannot collect and store enough energy to reproduce fast enough to match the rapidly increasing user demand. Specifically, the reproductionStoredEnergy factor inhibits the reproduction behavior when a cyber-entity’s energy is low. By improving this factor and/or adding additional factors (as we have done in the earlier sections), it is possible to reduce this initially high delay. Max. users 150 1500
Max. cyberentities 17 130
Utility, as percent from best 89.7 87.1
Messages sent per cyber-entity 1300 1167
Table 8: Additional Scalability Measures Table 8 contains additional measures of scalability. The first two columns summarize data from previous figures. They show that the r3d4m3 cyber-entities are able to scale to a large population. The third column shows the utility generated by the r3d4m3 cyber-entities as a percentage of the utility generated by the best cyber-entities. When there are 150 users during the peak hours, the r3d4m3 cyber-entities generated 89.7% of the utility generated by best (this was shown in the fifth column of Table 7 and repeated here in Table 8). When there are 1500 users during the peak hours, the percentage decreases slightly to 87.1%. The decrease is due to the higher delays experienced by users between 7am and 8am. The cause of the higher delay was discussed in the previous paragraph. When users experience higher delays, they give fewer energy units to the cyber-entities. The lower energy payments results in a lower utility. The fourth column of Table 8 shows the average number of relationship 21
maintenance messages sent by the r3d4m3 cyber-entities during the simulation two runs. Relationship maintenance messages are a form of overhead that could limit scalability if the number of messages a cyber-entity sends increases with the total number of cyber-entities. However, since cyber-entities use local interactions (recall that each cyberentity has a maximum of 6 relationships), the fourth column of Table 8 shows that the average number of relationship maintenance messages sent per cyber-entity is approximately the same when there are 17 or 130 cyberentities. The figures in Table 8 show that the r3d4m3 cyber-entity can scale to a large population without a significant decrease in utility or significant increase in message overhead.
4.6
Discussion of results The simulation results of Aphid and the Bio-Networking Architecture support our belief that applications
which follow biological principles and mechanisms are adaptive, survivable/available, and scalable. In Sections 4.2 through 4.4, we incrementally developed several Aphid cyber-entities by studying their ability to adapt to the number and location of users as well as their ability to survive and remain available. The resulting cyber-entity was called r3d4m3. Using a utility measure, we showed that the r3d4m3 cyber-entity was within 89.7% of the upper bound of any adaptation algorithm. The r3d4m3 cyber-entity also maintains a minimum population of 3 cyberentities. This allows the r3d4m3 cyber-entity population to survive and to maintain the availability of the application even when some of the cyber-entities crash or are killed. In Section 4.5, we studied the scalability of the r3d4m3 cyber-entity and showed that it could scale to a large population without a significant decrease in utility or significant increase in overhead. A few aspects of these simulations deserve clarification. First, the results revealed some overheads and deficiencies in the cyber-entity behaviors, i.e. excessively large population of the r3d4m3 cyber-entities during the peak user hours (Section 4.4) and a temporary period of high delay when 1500 users appeared in the network (Section 4.5). These are technical problems that can be resolved by enhancing the cyber-entity behaviors and not fundamental limitations of the Bio-Networking Architecture. Second, the scenarios used in these simulations were very simplistic. However, the cyber-entity behaviors were also simplistic. To perform well in more complex environments (simulation or real-world), cyber-entity behaviors may have to be more complex, possibly consisting of tens or hundreds of factors and weights. We believe these more complex cyber-entities can still follow the biological principles we described in Section 2.1 and therefore exhibit the beneficial characteristics of large scale biological systems. Simulations of more complex network environments are underway to confirm this.
22
Of real concern are the lack of a formal approach to the design of cyber-entity behaviors and the lack of a (mathematical) model of the Bio-Networking Architecture. The cyber-entity behaviors described in this paper were designed using ad-hoc calculations and trial and error. If cyber-entity behaviors become more complex, i.e. consisting of hundreds of factors and weights, a formal approach may be required. The lack of a model of the BioNetworking Architecture prevents us from predicting the global/emergent behavior of an application given a description of individual cyber-entity behaviors.
5. Related Work Researchers in the fields of Artificial Life [2][12][14] and Complexity [9][19] have studied large scale biological systems and the behaviors of simple entities within those systems. That work has been concentrated in imitating life in a computer and understanding the basic processes. The Bio-Networking Architecture applies the findings of those researchers in a new domain: the design of middleware that enables the construction and deployment of scalable, adaptive, and survivable/available network applications. Our project is not the first to use biological principles in the design of network applications. [3] [10] used the immune system as a model for network security and intrusion detection. [1] [6] draws inspiration from the biological world in the design of scalable sensor networks. While those works parallel ours, the Bio-Networking Architecture addresses a broader range of applications. It is also more open because the biological middleware (Bio-net platforms and cyber-entities) allow other researchers to create and deploy novel applications. While there are similarities between the Bio-Networking Architecture and Active networks [17], they are different because they operate at different levels in the protocol stack. In Active Networks, executable code is injected into the network to modify behaviors of network elements at or below the transport layer. In the BioNetworking Architecture, cyber-entities containing executable code are also introduced into the network; however, cyber-entities act at the application layer and do not modify network layer behaviors. Although the Bio-Networking Architecture heavily utilizes mobile agent middleware, it is different from current mobile agent middleware systems [11] [13] [18] in several respects. The Bio-Networking Architecture includes a set of design principles derived from the biological world that allow resulting applications to scale, adapt, and survive. It includes mechanisms that strictly control resources, emulating the role of energy or food in the biological world. Finally, the Bio-Networking Architecture includes cyber-entity evolution.
23
6. Future Work This paper describes the initial steps in a very large project. There is still a tremendous amount of study, design, and implementation to be done. We are continuing our study of biological systems, paying particular attention to how differentiated entities self-organize to form groups and/or hierarchies. We believe there are principles and mechanisms at work in this process that has relevance for the design of network applications. We continue to use the simulator to study and refine existing cyber-entity behaviors under different scenarios and to study the mutation, crossover, and evolution of cyber-entity behaviors. On the design front, we are developing additional cyber-entity behaviors that allow them to use their relationships to help users locate a particular cyberentity. (Basically, the web of cyber-entity relationships is used to create a completely decentralized cyber-entity directory service.) We have also started the construction of another application, called Hornet, using the BioNetworking Architecture. Hornet is targeted at an environment filled with wearable and embedded computing elements communicating using wired and wireless technologies. Hornet will push the Bio-Networking Architecture harder because it is larger in scale and must be more responsive to users. In terms of implementation, a graduate student in our group has implemented very simple versions of the Aphid cyber-entity and Bio-Networking platform software. They currently run on 3 WindowsNT computers (Bio-net platforms). We are refining the implementation and plan to deploy more Bio-net platforms.
24
References [1] Amorphous Computing web page. http://www.swiss.ai.mit.edu/projects/amorphous [2] Collins, R. and Jeffereson, D. AntFarm: Towards Simulated Evolution. In Proceedings of Artificial Life II, 1992 [3] D’haeseller, P., Forrest, S., and Helman, P. An Immunological Approach to Change Detection. In Proceedings of IEEE Symposium on Security and Privacy, 1996 [4] Dawkins, R. The Selfish Gene. Oxford University Press, 1989 [5] Dumpert, K. The Social Biology of Ants. Pitman Publishing Inc., 1978 [6] Estrin, D., Govindan, R., Heidemann, J., and Kumar, S. Scalable Coordination in Sensor Networks. In Proceedings of the Fifth Annual International Conference on Mobile Computing and Networking (MobiCom), 1999 [7] Franks, N. Army Ants: A Collective Intelligence. American Scientist, 1989 [8] Holland, J. Hidden Order: How Adaptation Builds Complexity. Addison-Wesley, 1995 [9] Kauffman, S. At Home in the Universe. Oxford University Press, 1995 [10] Kephart, J. A Biologically Inspired Immune System for Computers. In Proceedings of Artificial Life IV, 1994 [11] Lange, D. and Oshima, M. Programming and Deploying Java Mobile Agents with Aglets. Addison-Wesley, 1998. [12] Millonas, M. Swarms, Phase Transitions, and Collective Intelligence. In Proceedings of Artificial Life III, 1994 [13] Odyssey web page. http://www.genmagic.com/technology/odyssey.html [14] Ray, T. and Hart, J. Evolution of Differentiated Multi-Threaded Digial Organisms. In Proceedings of Artifical Life VI, 1998 [15] Seeley, T. The Honey Bee as a SuperOrganism. American Scientist, 1989 [16] Seeley, T. The Wisdom of the Hive. Harvard University Press, 1995 [17] Tennenhouse, D., Smith, J., Sincoskie, W., Wetherall, D. and Minden, G. A Survey of Active Networks Research. IEEE Communications Magazine, January 1997 [18] Voyager web page. http://www.objectspace.com/products/voyager. [19] Waldrop, M. Complexity. Simon & Schuster, 1992
25