The Causality Workbench Virtual Lab Isabelle Guyon1, Constantin Aliferis, Greg Cooper, André Elisseeff, Olivier Guyon, Jean-Philippe Pellet, Peter Spirtes, Alexander Statnikov I.
Summary
We implemented a virtual laboratory allowing researchers to perform experiments on artificial systems to infer their causal structure. This is part of the “Causality Workbench” effort. The design of the platform is such that: - Researchers can submit new artificial systems with which other can experiment. - Experimenters can place queries and get answers. - The activity is logged. - Registered users have their own virtual lab space. We have released a first version http://www.causality.inf.ethz.ch/workbench.php.
II.
Background
The problem of attributing causes to effects is pervasive in science, medicine, economy and almost every aspects of our everyday life involving human reasoning and decisionmaking. Advancing the methodology for reliably determining causal relationships will therefore have an important impact, both economical and fundamental. Determining causal relationships allows us to predict the consequences of actions or manipulations. For instance, the effect of taking a drug on health status, or the effect of reducing taxes on the economy. This is fundamentally different from making predictions from observations. Observations imply no experimentation, no interventions on the system under study, whereas actions introduce a disruption in the natural functioning of the system. The canonical way of determining whether events are causally related is to conduct controlled experiments in which the system of interest is “manipulated” to verify hypothetical causal relationships. However, experimentation is often costly, infeasible or unethical. This has prompted a lot of recent research on learning causal relationships from available observational data. These methods can unravel causal relationships to a certain extent, but must generally be complemented by experimentation. To this day, the methods, which have emerged in various application domains, have not been systematically compared because of the lack of standard benchmarks. To stimulate research in causal discovery, we created an interactive platform available via a web interface, which will allow researchers to share problems and test methods. Because experimentation is a key component of causal discovery, the platform simulates a laboratory environment in which researchers can experiment via the interface giving access to artificial data generating systems, emulating real systems. In the virtual laboratory, users can place queries to an unknown system, including request to observe some variables while setting other variables to given values (manipulations), to discover its causal structure. Users have personal accounts and lab space. A given user may choose among a number of data generative systems to reverse engineer. For each new experiment, the user receives: (1) a certain amount of virtual cash to be spent to 1
Corresponding author: Isabelle Guyon –
[email protected] 1
obtain data from the system by placing queries, (2) information about which variables are observable or actionable (actionable means potentially subject to “action” or “manipulation”), and (3) information about the cost of queries. The system may have hidden variables. The cost of a query varies depending on the number of variables manipulated and/or observed and the number of instances requested. The virtual laboratory keeps track of the queries and virtual cash spent during virtual experiments. When a user runs out of virtual cash, the experiment terminates and he/she must return the answer to the problem. Depending on the nature of the problem, the answer may consist in (i) point-wise predictions of variables (while others are being manipulated), (ii) predictions of distributions, (iii) information on the causal structure of the system, or (iv) a policy to obtain a desired outcome. In this first version, we focus on point-wise predictions of variable values.
III.
Architecture
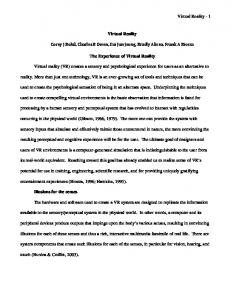
The system architecture is schematically represented in Figure 1. It is a hub-and-spokes architecture. A central server (the Causality Workbench server) provides a web interface to the users and in equipped with a database.2 The server communicates with one or several other servers on which causal systems (models) to be studied are simulated. In this first version, we have only one remote server hosting models. This server launches Matlab® upon request of the Causality Workbench server to run the models.
Query: Fill form or upload file.
Send queries as text files
Remote server hosting artificial system or model
Store query Our database Store result
Result: Get as file or display.
Return answer as text files
Figure 1: Overview of the Virtual Lab architecture. 2
All implementations are done with PHP and MySQL.
2
IV.
Overview of the platform
The Virtual Lab (Figure 1) has a web-based user interface available from http://www.causality.inf.ethz.ch/workbench.php. It is part of the Causality Workbench, which includes other resources (challenges, repository of data/models/software, teleconference seminars, etc.) The Virtual Lab section includes 6 pages. The Index, Leaderboard, and Info pages are publicly available. The Mylab and Upload pages are only available to registered users.
Figure 1: The Virtual Lab Info page. The users can familiarize themselves with the models, which are listed on the Index page (Figure 2). The table lists the model properties and the initial budget (amount of virtual cash available for experimentation) as well as the cost per experimental unit. The models are cross-indexed with the model repository automatically when a new model is registered (Figure 3). At present, model registration is via its inclusion in the GLOP package.
3
Figure 2: The Virtual Lab Index page. The models listed are linked to the repository.
Figure 3: Repository. The registered models are included in the repository. Following the instructions described in the Info page, Registered users may upload queries and results from the Upload page and retrieve data and performance scores from the Mylab page (Figure 4). When final prediction results on test data are uploaded, the experiment terminates and the final score is published on the Leaderboard page.
4
Figure 4: Mylab. Each user has his/her personal lab space holding his/her experiments.
Figure 5: GLOP. The GLOP Matlab package is available for download in the software repository.
5
V.
The GLOP package
Our first release of the Virtual Lab uses a single remote server running Matlab to implement artificial causal systems. We developed an object-oriented interface to easily incorporate new generative models. It is based on two simple abstractions: - query object and - model object. The query object holds the query information delivered by users or the data delivered by the generative models. It has a fixed structure. The model object is a template from which data generative models can be derived. We call GLOP (Generative Lab Object Package) the resulting package of objects. GLOP may be downloaded from http://www.causality.inf.ethz.ch/repository.php?id=23 (Figure 5). %============================================================== % QUERY object %============================================================== % q = query; % q = query(filename); % q = query(filename, fn2); % % Stores query information and results. % The argument "filename" is the root name of the query file. % If fn2 is specified, make a copy to the second file % % One expects a subset of the files: % .type: Type of the query, types={'TRAIN', 'TEST', 'OBS', % 'SURVEY', 'EXP', 'PREDICT'}; TEST and PREDICT can be followed by the test % set number; OBS can be followed by the number of samples requested. % .premanipvar, .manipvar, .postmanipvar: % One line with a list of variables. % .premanipval, .manipval, .postmanipval: % Multiline matrix, each line corresponding to one instance. % Each column corresponds to a variable. % The query object stores this information in corresponding fields. % Missing values are coded as NaN. % Methods: % load -called by the constructor to load the this. % save -save the query to file % struct -- show the structure % xml_display -- show structure as XML % In addition, many fields can be set/get with a method having the same % name; see methods(query) % Isabelle Guyon --
[email protected] -- May-Oct 2009
6
classdef query properties (SetAccess = private) % Identification participant_ID=[]; model_name=[]; experiment_name=[]; date_submitted=[]; type='OBS'; README=''; % Inputs sample=[]; manipvar=[]; manipval=[]; postmanipvar=[]; % Auxiliary fields and output fields postmanipval=[]; % The values for the queried "queryvar" variables premanipvar=[]; % The list of variables in the premanipval array premanipval=[]; % The values used to initialize the system before manipulating it % This is used if paricular subjects are chosen on which % to perform a given manipulation rather than drawing % them at random according to the natural distribution. % This is also used to return training or test data. predict=[]; % Same as postmanipval varnum=0; % Total number of variables (not including the target) % ie the maximum variable index value samplenum=[]; % Number of samples asked for manipnum=[]; % Effective number of time a variable is manipulated in the query obsernum=[]; % Effective number of time a variable has been observed (value requested) in the query, including targets targetnum=[]; % Number of times a target variable is observed % Private types={'TRAIN', 'TEST', 'OBS', 'SURVEY', 'EXP', 'PREDICT'}; end properties % All the costs are computed by the model samplecost=0; % samplenum * cost_per_sample manipcost=0; % manipnum * cost_per_manip obsercost=0; % obsernum * cost_per_observation targetcost=0; % targetnum * cost_per_target (this is on top of the regular cost for observing a variable: the target may be more expensive totalcost=0; % Overall cost % Prediction score and estimated error bar score=[]; ebar=[]; % Flag(s) is_overbudget=0; % Budget exceeded end end
7
%====================================================================== % MODEL template for a data generative model %====================================================================== % M=model(hyper) % hyper -- Hyperparameters (public properties). Use the Spider syntax. % train_num (Size of the training set) % test_num (Size of the test set) % cost_per_sample % cost_per_target_observation % cost_per_var_observation % cost_per_var_manipulation % By default, all values are set to zero. % If a configuration file model_config.txt exists, the hyperparameters are % loaded from that file. Any hyperparameter specified as argument % overwrites the default or configuration values. % % Examples: % default(model) % list the default values of the HP % M=model; % M=model('train_num=3000'); % M=model({'train_num=3000', 'cost_per_sample=234'}); % M.task_n_pricing or task_n_pricing(M) % B=initial_budget(M); % var_profile(M) % shows the variable properties % [Q, M]=process_query(M, query); % Isabelle Guyon --
[email protected] -- October 2009 classdef model % properties train_num=0; % load_config/evel_hyper: Size of the training set test_num=0; % load_config/evel_hyper: Size of the test set(s) cost_per_sample=0; cost_per_target_observation=0; cost_per_var_observation=0; cost_per_var_manipulation=0; end % protected) % init: Time dependency (0/1) % init: Indices of the target variables % init: Indices of the observable variables % init: Indices of the actionable variables % init: Indices of the unobservable % compute_budget: Price of the default % compute_budget: Price of the default test % compute_budget: Initial budget
8
VI.
Getting started guide
You may either use the Virtual Lab interface available from http://www.causality.inf.ethz.ch/workbench.php Or download the Matlab package GLOP from http://www.causality.inf.ethz.ch/repository.php?id=23. Working directly with GLOP will allow you to quickly perform trial experiments on example models. The Virtual Lab interface may then be used to get familiar with the query protocol. The Virtual Lab will be used in benchmarks and challenges to evaluate methods on new unknown models.
Getting started with GLOP Installation Unzip glop.zip Open Matlab and go to the GLOP directory and type use_glop at the prompt. Finding your way around To know the list of models, type > whoisglop To know the default values of a model hyperparameters: > default(model) To know the methods: > methods(model) To know the properties: > properties(model)
Examples > q=query('OBS 20'); or > q=query('TRAIN'); or > q=query('TEST'); and > a=alarm({'cost_per_sample=1', 'cost_per_var_observation=1', 'cost_per_var_manipulation=2'}); or > a=sprinkler; etc. > initial_budget(a) > task_n_pricing(a) > [q, a]=process_query(a, q);
Getting started with the Virtual Lab You may follow these simple steps: - Investigate the models by clicking on the links in the Virtual Lab Index page. Choose a model you want to work on. - Use the format described on the Info page to format your query. - Register by entering your personal information in the Login page (or just login if you are already registered). - Upload your query packaged as a zip archive using the Upload page form. - Retrieve the answer (your data) from the My Lab page.
9
How to design experiments? Here is a brief outline of the steps taken in experimenting and causal modeling: 1. Problem specification: Define your problem and your goals . In the Virtual Lab, problems are already formalized. 2. Feature set definition: Identify potentially relevant factors . In the virtual lab the feature set is already given: those are the system variables. In some cases, the task designer may hide a number of variables to test the robustness of algorithms against hidden confounders, which are unknown common causes to several variables in your system. 3. Manipulation protocol: Figure out how to perform actions on the system and manipulate variables of interest. This step is often very complex in real experiments because we do not always have easy means of influencing variables individually as an external agent. Not all variables are actionable or even observable. Some may be unethical to manipulate. In the Virtual Lab, things are simple: we tell you which variables are actionable. All you have to do to carry out experiments is to initialize or clamp desired variables. 4. Experimental design: Given a budget (here you have "virtual cash"), spend it in data collection, observations, and manipulations to achieve the goals you have set to yourselves. 5. Modeling: Carry out the experiments and build models with the data collected. Eventually iterate this process until a satisfactory model is obtained. In the Virtual Lab, all you have to do is to submit queries via the Upload Page using the format described below. Your virtual cash account will be automatically debited and you will be able to download the results of your experiments your private Mylab page. 6. Deployment: Deploy your model to predict the consequences of actions in new situations. In the Virtual Lab, we provide you with test data, which was drawn from a post-manipulation distribution. The manipulations are performed by the task designers. depending on the task, the designers may or may not inform you of what exact manipulation(s) was performed in test data. When you are done with modeling and before your run out of virtual cash, you must ask for the test data. WARNING: The test data will cost you virtual cash, so make sure you keep enough virtual cash. We do not withhold from your cash account a fixed amount to pay for the test data because, if you cleverly design your experiments and your model, you might get it at a discount price by querying only a subset of the variables. Once you ask for test data, you must return your prediction results on test data, no query for more data are allowed. We will organize competitions in the future. In a competition setup, it will not be possible to work several times on the same task. However, for the time being, you are free to experiment multiple times on the same problem and even to run concurrent experiments with different strategies.
10
VII. Data formats and protocol The submission of data requests and prediction results is via the Upload page of the Causality Workbench. A submitted query should be a zip file bundling files described below. Use zip query.zip *
or tar cvf query.tar *; gzip query.tar
to create valid archives. We provide several examples of queries for the LUCAS model: 1. Observations. Request 25 examples of all the variables. No manipulation is performed. observational data only. 2. Experiment 1.. Request 10 values of the target variable. Most covariate values are provided, except a few missing values. 3. Experiment 2.. Not all variables are manipulated. The pre-manipulation values are given by the selection of training samples. 4. Test data. We ask for the test set 2. Here we ask for postmanip variables, but we will not get them because the test data does not include any postmanipulation observations. 5. Default training set. Training data can be purchased unlabeled, this is cheaper. Then the labels may be queried separately. 6. Survey data. Query asking for a subset of the labels of the default training set. 7. Prediction results. Predictions of the target post-manipulation values on test set 2. If you want to get baseline results without experimenting, it is always possible with the initial budget to buy the default training set and the entire test set. Just submit two (separate) queries with a single query file, each containing a single word: 1. To get training data, write the word TRAIN on the first line. 2. To get test data, write the word TEST on the first line. File formats for data queries and prediction results Filename
[submission].query
NonExperimental experimental data data
Compulsory (TRAIN, TEST [n] or OBS [num])
Compulsory (EXP)
Survey data
Prediction results
Description
Optional Optional (PREDICT Type of query. (SURVEY) [n])
11
File Format A single key word on the first line, optionally followed by a number on the same line: TRAIN: get the default training set. TEST [n]; replace [n] by 1, 2, 3 to get the nth test set TEST=TEST 1. OBS [num]: get observational data; replace [num] by the number of samples requested. EXP: get experimental data (the number of samples is determined by the number of lines in [submission].sample and
[submission].manipval). SURVEY: get training labels. PREDICT [n]: replace [n] by 1, 2, 3 to indicate that predictions correspond to the nth test set. PREDICT=PREDICT 1.
[submission].sample
[submission].premanipvar
[submission].manipvar
[submission].postmanipvar
NA
Optional
NA
NA
Optional
Optional
Compulsory
Compulsory
Compulsory
Optional
NA
NA
[submission].premanipval
NA
NA
NA
[submission].manipval
NA
Compulsory
NA
[submission].postmanipval or [submission].predict
NA
NA
NA
NA
Sample ID in the default training set. The corresponding samples are used to set premanipulation values.
NA
List of the premanipulation variables (observed before or without experimentation). By default (no file given): (1) for nonexperimental and experimental data: all the observable variables, except the target; (2) for survey data: the target.
NA
Optional
A list of sample numbers, one per line (the numbering is 1-based and corresponds to lines in the training data).
A space-delimited list of variable numbers on the first line of the file. All variables are numbered from 1 to the maximum number of visible variables, except the target List of the variables to variable (if any), which is be manipulated numbered 0. (clamped).
List of the postmanipulation variables (observed after experimentation). By default: the target variable. Not applicable: use [submission].sample to initialize values of the pre-manipulation variables.
Each line corresponds to an instance (sample) and NA should contain space delimited variable values for all the variables of that instance. Use NaN if the Clamped values for the value is missing or manipulated variables, NA omitted. listed in The number of lines in [submission].manipvar. [submission].manipval should match the number of samples in [submission].sample (if provided). You may omit Predictions values for [submission].query and Compulsory all the samples of provide TESTn. [submission].predict instead of [submission].postmanipval if there is a single test set and no experiments are involved.
File formats for data received and prediction scores Data archives with the training or test data you requested are available from your private Mylab a short time after you placed your query. Prediction score are also displayed on the Leaderboard page.
12
Filename
Nonexperimental training data
Optional (TRAIN or OBS)
Survey data
Experimental Evaluation Test data training data score
One keyword and optionally a number on the first line (copied from the query submitted).
Optional EXP
Optional
NA
Present if requested
Present
NA
[answer].manipvar
NA
NA
Present
Optional
NA
[answer].postmanipvar
NA
NA
Optional
Optional
NA
Present
NA
Present if requested
Present
NA
NA (to get the target variable values, use the index 0)
Present
NA (to get the target variable values, use the index 0)
NA
NA
[answer].manipval
NA
NA
Present
Optional
NA
[answer].postmanipval
NA
NA
Present
Hidden to the participants
NA
[answer].is_overbudget
Optional
Optional
Optional
Optional
Optional
File indicating that the budget was overspent and the query was not processed.
The value1.
[answer].score
NA
NA
NA
NA
Present
Prediction score.
A numeric value.
[answer].ebar
NA
NA
NA
NA
Present
Error bar.
A numeric value.
Present
Present
Present
Present
NA
The total number of observable variables (excluding the target).
A numeric value.
[answer].premanipvar
[answer].premanipval or [answer].data
[answer].label
[answer].varnum
13
Optional Type of query. PREDICT
File Format
Optional SURVEY
[submission].query
Optional TEST
Description
A spacedelimited list of variable numbers on the first line of the List of the variables to be file. All manipulated (clamped). variables are numbered from 1 to the maximum number of visible variables, List of the postexcept the manipulation variables. By default target default: the target variable variable (if 0. any), which is numbered 0. If the file is missing or empty, an empty list is assumed. List of the premanipulation variables. By default, all the observable variables except the target.
Each line corresponds to an instance (sample) and Target values for default contains space trainign examples. delimited Equivalent to variable values [answer].premanipval when [answer].premanipvar for all the (with the single value 0) is variables of that instance (or a omitted. single target Clamped values for the value for manipulated variables, [answer].label listed in [answer].manipvar. files). Those correspond to [answer].data manipulations performed files contain by the organizers so they unlabeled are free of charge. default training data for Post-manipulation values. problems In answer to without [submission].postmanipvar experimentation Pre-manipulation values.
[answer].samplenum
Present
Present
Present
Present
NA
Number of samples requested.
A numeric value.
[answer].obsernum
Present
Present
Present
Present
NA
Number of variable values observed (including the target).
A numeric value.
[answer].manipnum
Present
Present
Present
Present
NA
Number of values manipulated.
A numeric value.
[answer].targetnum
Present
Present
Present
Present
NA
Number of target values observed.
A numeric value.
[answer].samplecost
Present
Present
Present
Present
NA
Cost for the samples requested (labeled samples A numeric may cost more than value. unlabeled samples).
[answer].obsercost
Present
Present
Present
Present
NA
Cost for the observations made.
A numeric value.
[answer].manipcost
Present
Present
Present
Present
NA
Cost for the manipulations made.
A numeric value.
Present
Present
Present
Present
NA
Additional cost for target observations.
A numeric value.
Present
Present
Present
Present
NA
Total cost.
A numeric value.
[answer].targetcost [answer].totalcost
In addition, summary information is provided to the central server via an XML format. Both “models” and “queries” have data structures, which can be summarized in XML. We give below typical examples. 1) Following request from the Causality Workbench server to the remove server named “GLOP” to list its models, the remote server returns the following information, which is then formatted as a table in the “Index” page of the Virtual Lab: alpha version - Oct 27 2009 ...
14
[etc. more models here] ...
2) Following the same request, the remote server creates individual profile files for the models, for information to the participants (those are linked from the model table in the “Index” page): LUCAS: This is a Bayesian network simulator for a toy problem inspired by the problem of identifying risk factors of lung cancer. See http://www.causality.inf.ethz.ch/data/LUCAS.html , etc
15
1 1
3) Following a data request from the Causality Workbench to answer a query (a zip file), the remote server packages the answer as a zip file and also returns the following information, which will serve to update the experiment table in the “My Lab” page of the Virtual Lab:
16
3) Following a scoring request of prediction results from the Causality Workbench (a PREDICT query formatted as a zip file also), the remote server packages the answer as a zip file and also returns the following information, which will serve to update the “Learderboard” page:
Acknowledgements: This project is supported by the U.S. National Science Foundation under Grant N0. ECCS-0725746. Any opinions, findings, and conclusions or recommendations expressed in this material are those of the authors and do not necessarily reflect the views of the National Science Foundation. 17