Unsupervised and Transfer Learning Challenge - Causality Workbench
Recommend Documents
Keywords: Deep Learning, Unsupervised Learning, Transfer Learning, Neural Networks, ... 1. http://http://www.causality.inf.ethz.ch/unsupervised-learning.php. 2 ...
Geoffrey Hinton collected and made available publicly the CIFAR datasets. See the techreport Learning .... Here is an abbreviated list from http://yann.lecun.com/exdb/mnist/: ...... Journal of Machine Learning Research, 5:361-397, 2004.
Dataset. Domain. Feat. num. Sparsity. (%). Development num. Transfer num. .... was used in the NIPS 2003 Feature Selection Challenge under the name.
features and exploring sparse codes that would result in most of the features .... models are implemented in Theano (Bergstra et al., 2010), a Python library that ...
Oct 27, 2009 - this first version, we have only one remote server hosting models. This server ... 2 All implementations are done with PHP and MySQL.
Uncovering cause-effect relationships is central in many as- pects of everyday life in both ..... Marginal structural models and causal inference in epidemiology.
in order to discover good representations, often at multiple levels, with ... ing, multi-task learning, self-taught learning, domain adaptation, neural networks, Re- ..... there are no known cheap ways of estimating the log-likelihood itself (Anneale
Jun 1, 2018 - tal machine learning technique that aims to use .... Supervised Transfer Learning ... Algorithm 1 Unsupervised QA Transfer Learning.
1MIT Computer Science and Artificial Intelligence Laboratory, Cambridge, .... Supervised Transfer Learning ... Algorithm 1 Unsupervised QA Transfer Learning.
Abstract. Although transfer learning has been shown to be successful for tasks like object and speech recognition, its applicability to question answering (QA) ...
Missing Data. ⢠Missing data are a part of almost all research, and we all have to .... often, the best approach is to
computational learning theory of supervised learning or by information theoretic compression ... 11 ICA Mixture Models for Unsupervised Classification of Non- .... Unsupervised learning algorithms are designed to extract structure from data.
(motorcycle), etc. have no final official definition that they are single words or combinations of two .... Le [7] is based on hybrid algorithms with maximal-matching.
Aug 24, 2017 - for the Environmental Sound Classification (ESC) task with su- pervised ... factorization [9, 10], dictionary learning [3], and wavelet-based features [11]. ... proaches that are based on data-driven learning and/or optimiza-.
... intelligence NI Courses offered by the Department of Computer Science are ... of Neural Computation (Computational N
Clustering is the organisation of unlabelled data into sim- ilarity groups called clusters. A cluster is a ... the kind of the used similarity metric. â[email protected].
Nov 4, 2014 - of the Internet messages, and also to the underground economy in the form of .... By contrast, the present work will generalize Trojan attacks in unsupervised ..... The first is polymorphism: where the virus uses encryption to.
Nov 13, 2015 - Human excel when given larger context and ability to reason about object presence [47]. 1. arXiv:1511.04166v1 [cs.CV] 13 Nov 2015 ...
Unsupervised Learning: The machine sees only the input sequence x1, x2,...,. xN . ... The emerging features are used as input for a supervised digit classifier in.
Dec 29, 2016 - presently it relies on Python in order to use Keras and scikit- learn for feature learning and t-SNE. The software behind this work is also ...
autoencoder (known as VAE) and the Gaussian Mixture variational autoencoder (called ..... space that aims to capture the multimodal nature of the input data.
Spurious causality. ▫ Eating ... We will describe languages that have causal
concepts as ..... query. (Spirtes et al, 2000 – Chapter 7; Pearl, 2000 – Chapter 3)
...
tomatically segment such objects and provide BBs without human intervention. ... the objectness property from still images to videos (the out- come of our method ... in which the object is static, while common tube-proposal approaches usually.
Highly frequent in language and communication, metaphor represents a significant challenge for. Natural Language Process
Unsupervised and Transfer Learning Challenge - Causality Workbench
pervised and transfer learningâ (the UTL challenge), in collab- oration with the ... made available large datasets from various application domains: handwriting ..... In the first phase, the winner (team name: AIO) used an algorithm to train kernels ...
Unsupervised and Transfer Learning Challenge Isabelle Guyon, Gideon Dror, Vincent Lemaire, Graham Taylor, David W. Aha Abstract— We organized a data mining challenge in “unsupervised and transfer learning” (the UTL challenge), in collaboration with the DARPA Deep Learning program. The goal of this year’s challenge was to learn good data representations that can be re-used across tasks by building models that capture regularities of the input space. The representations provided by the participants were evaluated by the organizers on supervised learning “target tasks”, which were unknown to the participants. In a first phase of the challenge, the competitors were given only unlabeled data to learn their data representation. In a second phase of the challenge, the competitors were also provided with a limited amount of labeled data from “source tasks”, distinct from the “target tasks”. We made available large datasets from various application domains: handwriting recognition, image recognition, video processing, text processing, and ecology. The results indicate that learned data representation yield results significantly better than what can be achieved with raw data or data preprocessed with standard normalizations and functional transforms. The UTL challenge is part of the IJCNN 2011 competition program1 . The website of the challenge remains open for submission of new methods beyond the termination of the challenge as a resource for students and researchers2 .
I. I NTRODUCTION This challenge addressed a question of fundamental and practical interest in machine learning: the assessment of data representations produced by unsupervised learning procedures, for use in supervised learning tasks. We evaluated the claim that unsupervised learning may be beneficial to learn better data representations in Deep Learning architectures, including deep belief networks and multi-layer neural networks, particularly by capitalizing on the availability of large amounts of unlabeled data. The challenge also addressed the evaluation of transfer learning methods capable of producing data representations useful across many similar tasks, after only training on one of them. Classification problems are found in many application domains, including classification of images or videos, speech recognition, medical diagnosis, marketing, and text categorization. The category identifiers are referred to as “labels”. Predictive models capable of classifying new instances (correctly predicting their labels) usually require “training”, or parameter adjustment, with large amounts of labeled training data (pairs of examples of instances and associated labels). Unfortunately, few labeled training data may be available due to the cost or burden of manually annotating data. Isabelle Guyon is an independent consultant. Direct correspondence to Clopinet, 955 Creston Road, Berkeley, CA 94708 (phone: +1 510 524 6211; email: [email protected]). Gideon Dror is with Yahoo! labs Haifa, Israel, Vincent Lemaire is with Orange, France, Graham Taylor is with New York University, USA, and David W. Aha is with the Naval Research Laboratory, USA. 1 http://www.ijcnn2011.org/competitions.php. 2 http://clopinet.com/ul.
Labeling data is not only expensive, it is tedious. In recent years, Amazon Mechanical Turk and other crowd-sourcing platforms have emerged as a way of rapidly labeling large datasets. However, these are not appropriate for personal or sensitive data. To help us quickly tag our personal pictures, videos, and documents, we need systems that can learn with very few training examples. “Active learning”, which was the topic of the challenge we organized for IJCNN 2010, helps reducing the burden of labeling by letting the learning machine query only the examples for which the labels are informative. In this challenge, we attacked the problem from a different angle: we examined whether one can exploit data similar to the target task data (labeled with different types of labels or completely unlabeled) to produce more salient representations. Following the seminal work in multi-task learning [1], there has been considerable progress in the past decade in developing cross-task transfer using both discriminative and generative approaches in a wide variety of settings [2]. These approaches include multi-layer structured learning machines from the “Deep Learning” family (Convolutional neural networks, Deep Belief Networks, Deep Boltzmann Machines) [3], [4], [5], [6], sparse coding [7], [8], and matrix factorization methods, metric or kernel learning methods [9], [10], [11], [12], [13]. “Learning to learn” new concepts [14] is a promising area of research in both machine learning and cognitive science revolving around these ideas. Important progress has also been made in purely unsupervised learning [15], [16], [17], [18], [19]. However, these advances tend to be ignored by practitioners who continue using a handful of popular algorithms like PCA, ICA, k-means, and various hierarchical clustering methods [20]. The goal of this challenge was to perform an evaluation of unsupervised and transfer learning algorithms free of inventor bias to help to identify and popularize algorithms that have advanced the state of the art. We made available five larger datasets from various domains. The participants needed to exploit the data provided for learning and submit results (transformed data representations or kernel matrices) on a validation set and a final evaluation set, in a prescribed format. The data representations or kernel matrices were evaluated by the organizers on supervised learning tasks that were unknown to the participants. To emphasize the capability of the learning systems to develop useful abstractions, such tasks made use of very few labeled training examples and the classifier used was a simple linear discriminant classifier. The challenge, which launched in December 2010, ended in April 2011. This paper presents the design and the results of the challenge.
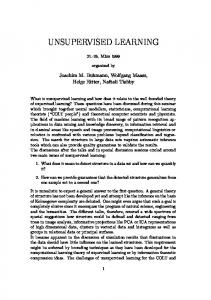
II. S ETTING AND TASKS OF THE CHALLENGE The datasets of the challenge (Table I) were split is illustrated in Figure 1 into a large development set, a validation set and a final evaluation set. The goal of the challenge was to produce good data representations on the final evaluation set. The validation set is similar to the final evaluation set; it was provided for practice. The assessment of the data representations was carried out on target tasks (that are supervised learning classification tasks), using labels known only to the competition organizers. The target tasks for the validation set and the final evaluation set are different (they correspond to different sets of target task labels). During the development period, online feedback was provided only on the validation set. The results on the final evaluation set were revealed only at the end of the challenge. For clarity of the scientific evaluation, the challenge proceeded in two phases. The first phase focused strictly on unsupervised learning. During that phase, no label was provided to the participants. It was then followed by a second phase on transfer learning for which some labels on source tasks, distinct from the target tasks, were provided for a subset of the development set (source task labels). We call that setup “cross-task transfer learning” [2] (labels available source tasks, not for target tasks) to contrast it with “inductive transfer learning” in which labels are available both for source and target tasks. For instance, consider the toy dataset ULE (handwritten digits). The development set, which contains examples of all the digits, is initially unlabeled for unsupervised learning. The development set labels made available for transfer learning include only examples of classes 4, 5, 8, and 9 (source tasks). The target tasks are associated with the validation and final evaluation sets: for the validation set, the classification of digits 1, 3, and 7; for the final evaluation set, the classification of digits 0, 2, and 6. TABLE I UTL CHALLENGE DATASETS All features are numeric (no categorical variables). There are no missing values. Feat. is the number of features; Spars. is the sparsity of the data calculated as the fraction of zero entries in tha data matrix; Devel. and Transf. are the number of examples in the development dataset and the number of source task labels released in the transfer learning phase respectively. The validation and final evaluation datasets consist of 4096 examples each (not shown). The ULE dataset was not part of the challenge. Dataset AVICENNA HARRY RITA SYLVESTER TERRY ULE [toy]
Domain Handwriting Video Images Ecology Text Handwriting
Feat. 120 5000 7200 100 47236 784
Spars. 0% 98.1% 1.1% 0% 99.8% 80.9%
Devel. 150205 69652 111808 572820 217034 26808
Transf. 50000 20000 24000 100000 40000 10000
We selected five different application domains that are illustrative of fields in which transfer learning is applicable:3
Fig. 1.
Data split in the UTL challenge
Handwriting recognition: Historical archives are difficult to process by traditional Optical Character Recognition (OCR) methods, due to their ancient scripts no longer in use. Thousands of different scripts in use worldwide and large volumes of scanned documents are waiting to be indexed to facilitate retrieval. Transfer learning methods could accelerate the application of handwriting recognizers by reducing the need for using human experts to label ´ data. Professor Mohamed Ch´eriet, Ecole de Technologie Sup´erieure, University of Quebec, Montr´eal, Canada, and his students prepared a large corpus of historical Arabic documents for this challenge: the AVICENNA dataset. The toy dataset ULE of handwritten digits (provided for practice purpose only) was derived from the MNIST data made available by Yann LeCun and Corinna Cortes4 . Video processing: The identification and recognition of gestures, postures and human behaviors has gained importance in applications such as video surveillance, gaming, marketing, computer interfaces and interpretation of sign languages for the deaf. The HARRY dataset was constructed from the KTH human action recognition dataset (collected and made publicly available by Ivan Laptev and Barbara Caputo)5 and the Hollywood 2 dataset of human actions and scenes (collected and made publicly available by Marcin Marszalek, Ivan Laptev, and Cordelia Schmid)6 . The data include video clips designed to illustrate human actions (KTH data) and clips of Hollywood movies (Hollywood2). The task is to recognize human actions like hand clapping, picking up a phone, walking, running, driving a car, etc. The data were preprocessed into a “bag” of STIP features [21]. Image recognition: Object recognition in images is a classical pattern recognition task. Its practical importance is growing particularly in image retrieval applications, including for Internet search. The RITA dataset we propose 4 http://yann.lecun.com/exdb/mnist/
3A
detailed technical report on the datasets was made available after the challenge ended: http://www.causality.inf.ethz.ch/ul_ data/DatasetsUTLChallenge.pdf
in the challenge was constructed from the CIFAR dataset of Alex Krizhevsky, Vinod Nair, and Geoffrey Hinton7 , a subset of the 80 million Tiny images dataset (collected and made publicly available by Antonio Torralba, Rob Fergus, and William T. Freeman)8 . See [22] for more details. The original data representation was enriched with new features and transformed to obfuscate the features. Ecology: The state of the world is constantly monitored from space via satellite images. Airborne imaging systems also allow monitoring vegetation and activity. These massive datasets need to be processed automatically to assist experts in ecology, geography, geology, climatology, archaeology, and seismology. We used data from the US Forest service to illustrate such tasks on the SYLVESTER dataset. The original dataset called Covertype was obtained from the UCI Repository of Machine Learning Databases9 . Text processing: Internet search engines process billions of queries daily to rank web pages. The ever increasing number of documents available on the Internet makes this task ever more difficult. Very few labeled data are available, but millions of documents must be indexed. The TERRY dataset used in this challenge is a subset of the RCV1-v2 Text Categorization Test Collection derived from Reuter’s news articles formatted and made publicly available by David Lewis [23]. It is preprocessed in a bag-of-words representation.
video tutorial on transfer learning.11 The rules can be found on the website of the challenge.12 Briefly: Development: From the outset of the challenge, all unlabeled development and evaluation data were provided to the participants. All data were preprocessed in a feature representation, such that the patterns were not easily recognizable by humans, making it difficult to label data using human experts. The labels of the supervised learning tasks used for evaluation remained unknown to the participants in both phases (and will never be disclosed so the platform can remain in use for benchmark purpose). The “transfer learning” labels were provided mid-way into the challenge. During development there was no limitation on the number of submissions on the validation set, except a maximum number of submission per day, which we enforced only in the last few days of each phase. The participants received on-line feedback on the quality of their representation (or kernel) with the metrics described in the next section. Submission format: Given a data matrix of samples represented as feature vectors (m samples in rows and n features in columns), the objective of the participants was to produce another data matrix of dimension (m, n0 ) (the transformed representation of n0 new features) or a kernel matrix between samples of dimension (m, m). The objective of the participant was that the transformed representations (or kernel matrices) would lead to good performance on the supervised learning evaluation tasks provided by the organizers. Final evaluation: To participate in the final evaluation the participants had to (i) register as mutually exclusive teams; (ii) make one “final” complete submission of a feature based representation (or kernel matrix) for the final evaluation data for all five datasets of the challenge, (iii) submit the answers to a questionnaire on their method (method factsheet) and (iv) compete either in one of the two phases only or in both phases (it was not necessary to compete in both phases to earn prizes). For each phase, the team performances were ranked for each individual dataset and the winner was determined by the best average rank over all datasets. Baseline results: Results using baseline methods were provided on the website of the challenge by the organizing team. IV. E VALUATION METRICS
Fig. 2.
Example of a learning curve
III. C HALLENGE PROTOCOL The challenge protocol was inspired by previous competitions we organized [24] and was designed to ensure fairness of the evaluation and stimulate participation. We provided guidance to the participants with detailed answers to Frequently Asked Questions (FAQ)10 and we posted a short 7 http://www.cs.toronto.edu/
˜kriz/cifar.html
8 http://groups.csail.mit.edu/vision/TinyImages/
The data representations were assessed automatically by the evaluation software on the website of the challenge. The evaluation software and sample code were provided to the participants. Notations: The goal of supervised learning is to predict an outcome y given a number of predictor variables x = [x1 , x2 , ...xn ], also called features, attributes, or factors. During training, the learning machine is provided with example pairs {x, y} (the training examples) with which to adjust its parameters. After training, the learning machine is evaluated
on new example pairs (the test examples) to estimate its generalization performance. In what follows, we call X a data matrix and use context to clarify the data subset to which it refers. Machine learning practitioners seldom use raw data to develop their systems. The original data matrix of dimension (m, n) may be transformed into a new matrix X of dimension (m, n0 ), whose columns represent transformed features. In the present challenge, we ask the participants to submit such transformed data matrices. The organizers then score the submitted representations using supervised learning tasks unknown to the participants. The competitors may either submit a (m, n0 ) transformed data matrix X of m examples and n0 features, or a (m, m) positive semidefinite kernel matrix K, which is an inner product between examples in some feature-space. The evaluation platform detects if the submitted matrix is a kernel matrix and switches to the kernel version of the algorithm. Hence, submitting K = XX 0 yields the same result as submitting X. This can be useful to reduce the amount of data transmitted when submitting results. The participants who are using dimensionality expansion techniques, leading to feature representations for which n0 n, may prefer submitting XX 0 if it its compressed archive to be transmitted is smaller than that X, while the participants using dimensionality reduction techniques might be better off submitting X directly. We also allowed the participants to explore metric learning (kernel learning) as an alternative to data representation learning and submit any kernel matrix. Scoring metrics: For each evaluation set (validation set or final evaluation set) the organizers defined several binary classification tasks unknown to the participants. The platform used the data representations provided by the participants to train a linear classifier to solve these tasks. To that end, a form of cross-validation was performed by partitioning randomly the evaluation data (validation set or final evaluation set) multiple times into a training and a test set, and averaging performances.13 The number of training examples was varied and the AUC was plotted against the number of training examples in a log scale (to emphasize the results on small numbers of training examples). The area under the learning curve (ALC) was used as a scoring metric to assess the results. The participants were ranked by ALC for each individual dataset. The participants having submitted a complete experiment (i.e., reporting results on all 5 datasets of the challenge) could enter the final ranking. The winner was determined by the best average rank over all datasets for the results on a complete experiment or their choice. Global Score: We measured prediction performance using the ALC. A learning curve plots the AUC (see the definition below) as a function of the number of training examples. We consider two baseline learning curves: - The ideal learning curve, obtained when perfect predictions are made (AUC=1). It goes up vertically then 13 The parameters of the linear classifier are adjusted using the training set. Then, predictions are made on test data using the trained model. The Area Under the ROC curve (AUC) is computed to assess the performance of the linear classifier. The results are averaged over all tasks and over several random training/test partitions.
follows AUC=1 horizontally. It has the maximum area “Amax”. - The “random” learning curve, obtained by making random predictions (expected value of AUC: 0.5). It follows a straight horizontal line. We call its area ”Arand”. To obtain our ranking score, we normalize the ALC as follows: globalscore = (ALC − Arand)/(Amax − Arand) We interpolate linearly between points. The global score depends on how we scale the x-axis and the number of points. We used a log2 scaling and plotted the curve from m = 1 to m = 26 training examples. We show in Figure 2 an example learning curve for the toy problem ULE, obtained using the sample code. Classifier: We used a linear discriminant classifier to evaluate the quality of the data representations. Denoting by w = [w1 , w2 , . . . , wn ] the parameter vector of the model, classification is performed using the discriminant function f (x) = w · x .
(1)
If a threshold θ is set, patterns having a discriminant function value exceeding θ are classified in the positive class. Otherwise they are classified in the negative class. The weights wi are computed as the difference between the average of feature xi for the examples of the positive class and the average of feature xi for the examples of the negative class. In other words, if we call X the training data matrix of dimensions (m, n), m being the number of patterns and n the number of features, and Y the target vector of weighted binary target values (1/m+ ) and −(1/m− ), where m+ and m− are the number of examples of the positive and negative classes respectively, we compute the weight w of the linear discriminant as: w = X 0Y . (2) If a participant would submit XX 0 instead of X or any positive semi-definite matrix, the evaluation code recognized that it was a symmetric matrix with eigenvalues positive or zero. The linear discriminant would then be computed as follows: X f (x) = αk xk · x , (3) k
where xk are the training examples, αk = 1/m+ for the elements of the positive class, αk = −1/m− for the elements of the negative class. Notice that the weight vector w of Equation 2, where Y is the “balanced” target vector with values 1/m+ and −1/m− , can be written as: X w= αk xk . k
Hence, the dual form of the discriminant function of Equation 3 is equivalent to the primal form of Equation 1. Therefore, the result is the same regardless of whether one submits X or XX 0 . Area under the ROC Curve: The organizers evaluated classification performance with the area under the ROC
curve (AUC). The AUC is the area under the curve plotting sensitivity vs. (1− specificity) when the threshold θ to which f (x) is compared is varied (or equivalently the area under the curve plotting sensitivity vs. specificity). We define “sensitivity” as the error rate of the positive class and “specificity” as the error rate of the negative class. The AUC is a standard metric for classification tasks. The participants were judged on the normalized ALC (global score), but online feedback was provided on both AUC and ALC. V. R ESULTS Oftentimes challenges end up being disappointing because their results are either negative or not statistically significant. In this challenge, we are pleased that the answer to our questions are positive and we believe that the results are significant because we used 5 datasets from different domains, we received a large number of submissions, and the top ranking participants used successfully the same method on all the datasets. The central questions investigated were: • Does unsupervised learning help compared to simple normalizations of no preprocessing? [Answer: YES] • Does cross-task transfer learning help compared to unsupervised learning? [Answer: YES] • Are Deep Learning methods competitive in this arena? [Answer: YES] Participation. The challenge attracted 76 participants. There was more participation in the first phase than in the second phase: In the first phase, 6933 jobs were submitted, including 41 complete final entries, while, in the second phase, 1141 jobs were submitted including 14 complete final entries. There were in the end 16 ranked teams in the first phase and 8 ranked teams in the second phase. Not all teams decided to enter the final ranking, despite the option to preserve their anonymity. The lower participation in phase 2 may be partially explained by the competition of other popular challenges taking place in the same time period. But this may also be due to the fact that “unsupervised learning” is a more mature topic than “transfer learning”, making it easier for researchers to contribute. However, we are pleased that strong teams participated in both phases and made contributions with advanced techniques. Analysis of the results tables. The results of the top ranking teams are shown in Table II. The complete result tables are available online.14 In support of the significance 14 Result tables: http://www.causality.inf.ethz.ch/ unsupervised-learning.php?page=results. In phase 1, the organizers detected that the team 1055A submitted by error their results on the validation set instead of those on the final evaluation set for the dataset SYLVESTER. The team was allowed to re-submit their results on that dataset and those are shown in the table. Without this correction, the 1055A team ranks 3rd and this is the official ranking (with the correction they rank 2nd ex aequo with tkgw). In phase 2, due to an accidental release of the results on the final evaluation set on the scheduled deadline, the planned grace period was canceled. However, the participants were permitted to make one last submission. The results reported in this paper are those of the official ranking. The results of the additional final submission are shown on the referenced webpage. The ranking of the top ranked participants remained unchanged.
of the results of the challenge, the top ranking participants performed consistently well on all the datasets. We show in Figure 3 the distribution of the results (on final evaluation data) in the two phases as a box plot. On each box, the central mark is the median, the edges of the box are the 25th and 75th percentiles, the whiskers extend to the most extreme datapoints the algorithm considers to be not outliers, and the outliers are plotted individually. We use the red color for the results of phase 1 and the blue color for the results of phase 2. The initial letter of the dataset and the phase number are indicated on the horizontal axis. The distribution of the results reveals that there are important differences difficulties across datasets. AVICENNA was very hard, HARRY and TERRY were the easiest tasks (but there is a very wide range of results) and RITA and SYLVESTER were of medium difficulty. The tasks also differed in how much transfer learning could help. We used the results of phase 1 (unsupervised learning) as a baseline for phase 2 (transfer learning). For HARRY, RITA and SYLVESTER, both the median and the best results are better in phase 2. For AVICENNA, the best result is a little better in phase 2, but the median is worse. For TERRY, it is the opposite. Overall, we conclude that transfer learning has a potential for improving preprocessing since whether we use the median or the best result, in 4/5 cases the results of phase 2 are better than those of phase 1. It is also important to assess whether unsupervised learning helps compared to classical normalizations or no preprocessing at all. We ran a couple of algorithms for comparison (Table II, bottom).15 Using unsupervised learning, the participants outperformed the organizers on 4/5 datasets (for HARRY, the normalized representation achieved the best results in phase 1). Finally, we examined the correlation between validation set and final evaluation set performances. After removing a few outliers (probably due to submission errors) we obtained a correlation coefficient of 0.88 in the first phase and 0.89 in the second phase. Most participants simply used the validation set performance as a model selection criterion. This turned out to be an effective strategy. Survey of the participants. We surveyed the participants to determine what algorithms, software and hardware was used in the challenge and the amount of effort that was put into solving the tasks. Sixteen teams turned in fact sheets. We review briefly our findings. In this challenge, effort paid off. The top ranking participants spent several man-weeks of work compared to just a few days for the lower ranking participants. Most reported having had enough development time. Most people used the same method on all the datasets (72%), which is great news because it demonstrates that systematic methods were developed. 15 200 dimensions were used for PCA except for TERRY, for which 4096 dimensions were used and data were subsambled to compute the covariance matrix.
Fig. 3. Distribution of the results in the two phases of final evaluation data
For preprocessing, most participants just normalized the columns and/or the lines of the data matrix. Feature construction, non-linear transformations, and orthogonalization were more prevalent among the top ranking participants. In most cases, no feature selection was used unless it was embedded in the learning algorithm. Interestingly, several top ranking participants of the second phase used wrapper methods of feature selection, making thus use of the available transfer labels. Linear transformations and clustering were the most popular methods of unsupervised learning (83% of the participants used either one of these two methods). Even among the top ranking participants, users of non-linear methods and Deep Learning methods were the exception. In the second phase, a significant fraction (25%) of the participants used the transfer labels only for model selection. This trend is even more pronounced among the top ranking participant: 4/5 used this strategy. Hence, the transfer labels basically served to validate unsupervised learning strategies. The participants used the data is various ways for training and model selection. Not all of them used all the data for training (development set, validation set, and final evaluation set). Among the top ranking participants of phase 1, all used the (unlabeled) validation set for training, but only half used either the (unlabeled) development set or the (unlabeled) final evaluation set. The use of the development set for training went up to 80% among the top ranking participants in phase 2 (we remind that, in phase 2, the development set was partially labeled). For model selection, most participants relied, at least to some extent, on the performances on the validation set (available from the leaderboard). Some participants used cross-validation on the development test set during the second phase, to make use of the “transfer labels”. A few participants used ensemble methods, either by concatenating representations or averaging kernels.
Surprisingly, not all the participants made the effort of adapting their methods to the type of classifier used for evaluation (a linear classifier with Hebbian-style learning). Very few made the effort of orthogonalizing features, which we thought might help because Hebbian learning makes the implicit assumption of feature orthogonality/independence. However, most top ranking participants did make adaptations of their algorithms to the classifier used for evaluation. With respect to hardware and software implementation, all the participants used some form of parallelism to perform their computer experiments. More than half used parallel processors. For example, the LISA team used clusters (to parallelize hyper-parameter exploration) and GPUs to speed-up computation. The size of the datasets imposed some memory requirements on the hardware. Live memory requirements were large, but not exceptional. Two thirds of the participants reported needing between 2 and 8 Gbytes of memory. Also two-thirds of the participants reported using Matlab. Hence, the size of the datasets did not prevent the participant from using rather memory consuming and relatively slow software environments like Matlab (83% used Matlab at least to some extent). A variety of operating systems were used (33% MacOS, 61% Windows, 61% Linux). For the most part, the software used for the challenge is freeware or shareware (either produced by the participants or third-party code); only 1/4 of the participants reported using commercial or proprietary code. Winning methods. A special volume of JMLR W&CP will be published gathering the papers of the best participants. Here we give a brief summary of methods used, based on the fact sheets.16 In support of the significance of the results of the challenge, the top ranking teams in both phases used consistently the same principled methods on all datasets, and performed well on all of them. In the first phase, the winner (team name: AIO) used an algorithm to train kernels [26]. Using validation data, he incrementally improved his kernel, each time checking the performance on the leaderboard. He developed a systematic method of sequential kernel transformations and recorded which sequence ended up giving the best performance on validation data. Then, he applied the same sequence to the final evaluation data. The method can be interpreted as a greedy search for hyperparameters of a compound kernel. The team LISA, ranking first in the second phase and fourth in the first phase, based their solution on Deep Learning techniques, in particular for unsupervised learning of representations. Their methods follow the techniques described in [4]. Those exploit as building blocks unsupervised learning of single-layer models, such as Restricted Boltzmann Machines, to construct deeper models such as Deep Belief Networks. The team 1055A, ranking second in the first phase and third in the second phase used classical unsupervised learning methods: Principal component analysis (PCA) and k-means 16 http://www.causality.inf.ethz.ch/ unsupervised-learning.php?page=results
TABLE II N ORMALIZED ALC VALUES OF THE TOP RANKING PARTICIPANTS AND REFERENCE METHODS The ALC values are computed for 1 to 26 training examples. We show in boldface the best result for both phases. The numbers in parentheses are the ranks for the individual datasets in each phase.
clustering. They first computed the principal components on validation dataset and used the on-line feedback to determine the first n principal components that gave the best global score. Clustering was then performed in the PCA representation and repeated 100 times with different class seeds. The number of clusters was optimized with the feedback from the validation dataset. They submitted data representations in a binary encoding of cluster membership. The team tkgw, ranking second in the second phase, used a method called “Random Forest Proximity”, which recursively searches for principal directions when going down a decision tree (halting at a depth of 12). Random Forests [27] are ensembles of decision trees built by resampling variables and training examples. The method allowed the authors to create a large number of features, from which they generated a similarity measure. The similarity measure was then turned into a semi-definite positive kernel matrix with a suitable normalization. See the fact sheet for details. The team Airbus, ranking third in the first phase, tried various preprocessing methods and selected the best one one using the validation set. On AVICENNA they ended up using PCA with 90% of variance, and then a RBF kernel. For HARRY and TERRY, they rotated the representation then used a linear kernel. For RITA, they ran k-means to get some clusters then Maximum Variance Unfolding (MVU) on each of them to select features, and then a denoising algorithm. For SYLVESTER, they used whitening, taking 90% of the variance.
VI. C ONCLUSIONS The classical machine learning assumption of i.i.d. (independently and identically distributed) instances is constantly challenged in real applications. Data available for training are not always similar to data the system will be exposed to when it is deployed. Transfer learning exploits data from a “source task” whose target space or input domain is different from the “target task”. We organized a challenge in unsupervised and cross-task transfer learning. The results of the first phase on unsupervised transfer learning confirm results reported in the literature that unsupervised learning can be beneficial for preprocessing. The benefits of transfer learning in the “cross-task transfer learning” setting studied in this challenge are mainly derived from an improvement in model selection of unsupervised learning preprocessing techniques. New promising methods have been proposed. One of the main findings of this challenge is the power of unsupervised learning as a preprocessing. Regardless of methods used, results that are significantly better than those on the raw data were obtained in the challenge with unsupervised methods. The skepticism around the effectiveness of unsupervised learning is justified when no labeled data are available for validation. However, unsupervised learning can be the object of model selection using a supervised task, similarly to preprocessing, feature selection, and hyperparameter selection. There seems to be a particularly good fit between unsupervised learning and transfer learning, which can be married in what we refer to as “unsupervised transfer learning”. The method consists in preprocessing data with unsupervised methods in several ways and choosing the best
approach by training and testing a classifier on a source task (auxiliary task), distinct from the target task. This is a variant of the simpler model selection strategy generally used, which consists in using some validation data drawn from the same distribution at the target task data. In this challenge, we demonstrated that the validation data needs not to be drawn from the same distribution, it suffices that the source task used bears some resemblance with the target task. The importance of the degree of resemblance of the two tasks remains to be determined. This method was illustrated in the challenge in both phases. In phase 1, the source task was the classification of the validation set data. The participants used the feedback available from the leaderboard on the validation set to choose their method. There was a danger of overfitting by trying too many methods and relying too heavily on the performance on the validation set. One team for instance overfitted in phase 1, ranking 1st on the validation set, but only 4th on the final evaluation set. Possibly, criteria involving both the reconstruction error and the classification accuracy on the validation tasks may be more effective for model selection. This should be the object of further research. In phase 2, the participants had available labels from a source task (distinct from the classification tasks of the validation set and the final evaluation set). Therefore, they had the opportunity to use such labels to devise transfer learning strategies. The most effective strategy seems to have been to use those labels for model selection again. ACKNOWLEDGMENTS This project is part of the DARPA Deep Learning program and is an activity of the Causality Workbench supported by the Pascal network of excellence funded by the European Commission and by the U.S. National Science Foundation under Grant N0. ECCS-0725746. Any opinions, findings, and conclusions or recommendations expressed in this material are those of the authors and do not necessarily reflect the views of the National Science Foundation. The views, opinions, and/or findings contained in this article/presentation are those of the author/presenter and should not be interpreted as representing the official views or policies, either expressed or implied, of the Defense Advanced Research Projects Agency or the Department of Defense. Free registrations for the winners were offered by the IJCNN conference. Additional support was provided in various forms by Orange, Health Discovery Corporation, NEC and Kaggle. We are very grateful to all the members of the causality workbench team for their contributions and in particular to our co-founders Constantin Aliferis, Greg Cooper, Andr´e Elisseeff, Jean-Philippe Pellet Peter Spirtes, and Alexander Statnikov, and to the advisors and beta-testers Gavin Cawley (University of East Anglia, UK), Olivier Chapelle (Yahoo!, California), Ulrike von Luxburg (MPI, Germany), Gerard Rinkus (Brandeis University, USA), Quoc V. Le (Stanford University, USA), Danny Silver (Acadia University, Canada), and Gr´egoire Montavon (TU Berlin, Germany). The website implementation was done by MisterP.net who provided exceptional support. We are very grateful to Joachim Buhmann who made available to us his computer resources and to Thomas Fuchs for the computer administration. This project would not have been possible without generous donations of data. We are very grateful to the data donors mentioned in the text of the article.
R EFERENCES [1] R. Caruana, “Multitask learning,” Machine Learning, vol. 28, no. 1, pp. 41–75, 1997. [2] S. J. Pan and Q. Yang, “A survey on transfer learning,” IEEE Transactions on Knoweledge and Data Engineering, vol. 22, no. 10, pp. 1345–1359, October 2010. [3] R. Collobert and J. Weston, “A unified architecture for natural language processing: Deep neural networks with multitask learning,” in International Conference on Machine Learning, ICML, 2008. [4] Y. Bengio, “Learning deep architectures for AI,” Foundations and Trends in Machine Learning, vol. 2, no. 1, pp. 1–127, 2009, also published as a book. Now Publishers, 2009. [5] S. M. Gutstein, “Transfer learning techniques for deep neural nets,” Ph.D. dissertation, The University of Texas at El Paso, 2010. [6] D. Erhan, Y. Bengio, A. Courville, P.-A. Manzagol, P. Vincent, and S. Bengio, “Why does unsupervised pre-training help deep learning?” JMLR, vol. 11, pp. 625–660, 2010. [7] H. Lee, A. Battle, R. Raina, and A. Y. Ng, “Efficient sparse coding algorithms,” in Advances in Neural Information Processing Systems 19, B. Sch¨olkopf, J. Platt, and T. Hoffman, Eds. Cambridge, MA: MIT Press, 2007, pp. 801–808. [8] R. Raina, A. Battle, H. Lee, B. Packer, and A. Y. Ng, “Self-taught learning: Transfer learning from unlabeled data,” in Proceedings of the Twenty-fourth International Conference on Machine Learning, 2007. [9] J. Bromley, I. Guyon, Y. LeCun, E. S¨ackinger, and R. Shah, “Signature verification using a ”siamese” time delay neural network,” in In NIPS Proc, 1994. [10] G. Lanckriet, N. Cristianini, P. Bartlett, and L. E. Ghaoui, “Learning the kernel matrix with semi-definite programming,” Journal of Machine Learning Research, vol. 5, pp. 27–72, 2004. [11] K. Q. Weinberger and L. K. Saul, “Distance metric learning for large margin nearest neighbor classification,” J. Mach. Learn. Res., vol. 10, pp. 207–244, June 2009. [Online]. Available: http://portal.acm.org/citation.cfm?id=1577069.1577078 [12] L. Yang and R. Jin, “Distance metric learning: A comprehensive survey,” Michigan State University, Tech. Rep., 2006. [Online]. Available: http://citeseerx.ist.psu.edu/viewdoc/summary?doi=10.1.1.91.4732 [13] L. Yang, “An overview of distance metric learning,” Carnegie Mellon University, Tech. Rep., 2007. [Online]. Available: http: //www.cse.msu.edu/\∼yangliu1/frame survey v2.pdf [14] S. Thrun and L.Y. Pratt, editors, Learning to Learn. Boston, MA: Kluwer Academic Publishers, 1998. [15] A. J. Smola, S. Mika, B. Schlkopf, and R. C. Williamson, “Regularized principal manifolds,” JMLR, vol. 1, pp. 179–209, 2001. [16] Y. Bengio, J.-F. Paiement, P. Vincent, O. Delalleau, N. L. Roux, and M. Ouimet, “Out-of-sample extensions for lle, isomap, mds, eigenmaps, and spectral clustering.” in NIPS03, 2003. [17] A. Globerson and N. Tishby, “Sufficient dimensionality reduction,” J. Mach. Learn. Res., vol. 3, pp. 1307–1331, March 2003. [Online]. Available: http://portal.acm.org/citation.cfm?id=944919.944975 [18] Z. Ghahramani, Unsupervised Learning. Berlin: Springer-Verlag, 2004, vol. 3176, pp. 72–112. [19] U. Luxburg, “A tutorial on spectral clustering,” Statistics and Computing, vol. 17, pp. 395–416, December 2007. [Online]. Available: http://portal.acm.org/citation.cfm?id=1288822.1288832 [20] A. K. Jain, M. N. Murty, and P. J. Flynn, “Data clustering: A review,” 1999. [21] I. Laptev, “On space-time interest points,” International Journal of Computer Vision, vol. 64, no. 2/3, pp. 107–123, 2005. [22] A. Krizhevsky, “Learning multiple layers of features from tiny images,” University of Toronto, Tech. Rep., 2009. [Online]. Available: http://www.cs.toronto.edu/∼kriz/learning-features-2009-TR.pdf [23] D. D. Lewis, Y. Yang, T. G. Rose, F. Li, G. Dietterich, and F. Li, “Rcv1: A new benchmark collection for text categorization research,” Journal of Machine Learning Research, vol. 5, pp. 361–397, 2004. [24] Clopinet, “Challenges in machine learning.” [Online]. Available: http://clopinet.cm/challenges [25] I. Guyon, A. Saffari, G. Dror, and J. Buhmann, “Performance prediction challenge,” in IEEE/INNS conference IJCNN 2006, Vancouver, Canada, July 16-21 2006. [26] J. Shawe-Taylor and N. Cristianini, Kernel Methods for Pattern Analysis. New York, NY, USA: Cambridge University Press, 2004. [27] L. Breiman, “Random forests,” Machine Learning, vol. 45, no. 1, pp. 5–32, 2001.