JULY 1999
DRITSCHEL ET AL.
1551
The Contour-Advective Semi-Lagrangian Algorithm for the Shallow Water Equations DAVID G. DRITSCHEL Mathematics Institute, University of St. Andrews, Fife, United Kingdom
LORENZO M. POLVANI Department of Applied Physics and Applied Mathematics, Columbia University, New York, New York
ALI R. MOHEBALHOJEH Department of Applied Mathematics and Theoretical Physics, University of Cambridge, Cambridge, United Kingdom (Manuscript received 17 February 1998, in final form 23 June 1998) ABSTRACT A new method for integrating shallow water equations, the contour-advective semi-Lagrangian (CASL) algorithm, is presented. This is the first implementation of a contour method to a system of equations for which exact potential vorticity invertibility does not exist. The new CASL method fuses the recent contour-advection technique with the traditional pseudospectral (PS) method. The potential vorticity field, which typically develops steep gradients and evolves into thin filaments, is discretized by level sets separated by contours that are advected in a fully Lagrangian way. The height and divergence fields, which are intrinsically broader in scale, are treated in an Eulerian way: they are discretized on an fixed grid and time stepped with a PS scheme. In fact, the CASL method is similar to the widely used semi-Lagrangian (SL) method in that material conservation of potential vorticity along particle trajectories is used to determine the potential vorticity at each time step from the previous one. The crucial difference is that, whereas in the CASL method the potential vorticity is merely advected, in the SL method the potential vorticity needs to be interpolated at each time step. This interpolation results in numerical diffusion in the SL method. By directly comparing the CASL, SL, and PS methods, it is demonstrated that the implicit diffusion associated with potential vorticity interpolation in the SL method and the explicit diffusion required for numerical stability in the PS method seriously degrade the solution accuracy compared with the CASL method. Moreover, it is shown that the CASL method is much more efficient than the SL and PS methods since, for a given solution accuracy, a much coarser grid can be used and hence much faster computations can be performed.
1. Introduction The shallow water equations (SWE) are widely used in idealized studies of atmospheric and oceanic dynamics. They are the simplest equations able to describe both slow, balanced flows and fast, gravity wave oscillations, the two main categories of fluid motion present in the more complicated primitive equations, which are commonly used for atmospheric, oceanic, and climate modeling. For this reason SWE have been proposed as an appropriate test bed for new numerical algorithms (Williamson et al. 1992). In this paper we present a new algorithm for the solution of the SWE. The guiding idea behind the new
Corresponding author address: Dr. Lorenzo M. Polvani, Department of Applied Physics and Applied Mathematics, Columbia University, 209 S W MUDD, Mail Code 4701, New York, NY 10027. E-mail:
[email protected]
q 1999 American Meteorological Society
algorithm rests on the well-established observation that, even in the presence of relatively smooth, large-scale flows, tracer fields in the atmosphere and the ocean readily develop extremely fine scales, often by simple kinematic stirring. The stratospheric circulation, long thought to be dominated by large-scale features, provides a case point; recent aircraft observations combined with trajectory filling techniques (Waugh et al. 1994; Plumb et al. 1994) have demonstrated the existence of extremely fine structure in the constituent distributions. In the ocean, the recent observation of Wunsch and Stammer (1995) of very small-scale features on the ocean surface is another striking example. Furthermore, recent studies suggest that fine scales can play an important role in stratospheric chemistry (McIntyre 1995; Edouard et al. 1996; Tan et al. 1997). For inviscid SWE, a conserved tracer of particular dynamical significance (Hoskins et al. 1985) is the potential vorticity. The main novelty of the new algorithm rests in that the potential vorticity is represented by level
1552
MONTHLY WEATHER REVIEW
sets separated by contours, which are advected in a fully Lagrangian way. This technique allows one to compute potential vorticity scales well below the grid scale, while the fields that are not materially conserved by the flow are numerically represented and time stepped on an Eulerian grid. Hence the name of the new algorithm: the contour-advective semi-Lagrangian (CASL) method for SWE. As we demonstrate below, advecting potential vorticity in a Lagrangian way allows one not only to resolve features on scales that are much smaller than the grid scale but also to maintain potential vorticity gradients that are steeper than the grid resolution allows. The net effect is that the convergence of the computed solutions substantially improves as the grid is refined. To the best of our knowledge, the CASL method presented in this paper is the first implementation of a contour-based algorithm to a system of equations for which no exact potential vorticity invertibility exists. In the next section we describe the new numerical method in some detail, as well as two other methods that have been popular in recent years: the pseudospectral method (PS) and the semi-Lagrangian method (SL). In section 3 we compare these three by examining in detail the evolution of a complex flow typical of atmospheric and oceanic situations: the nonlinear instability of a zonal jet. A brief discussion concludes the paper in section 4. 2. The algorithm In their simplest form, the SWE may be written in terms of the velocity u [ (u, y ) and surface height h. In planar Cartesian geometry, this gives Du ]h 2 f y 5 2g , Dt ]x
(1)
Dy ]h 1 fu 5 2g , Dt ]y
(2)
]h 1 = · (hu) 5 0, ]t
(3)
where f is the Coriolis parameter (taken to be constant here), g is the gravitational acceleration (or the reducedgravity in the oceanic context), and the material derivative is defined in the usual way, D ] [ 1 u · =. Dt ]t
(4)
Dissipative terms are not written, though they are required in many numerical methods as discussed below. Instead of the two velocity components u and y , it is customary to use the vorticity z and the divergence d, defined by
z5
]y ]u 2 ]x ]y
and d 5
]u ]y 1 , ]x ]y
(5)
as the prognostic variables. It is also useful to separate
VOLUME 127
the height h into a constant mean value h and a deviation hˆ therefrom—that is, letting h [ h 1 hˆ —and to use h9 [ hˆ /h as the third prognostic variable. In terms of z, d, and h9 the SWE take the form ]z 5 2= · [(z 1 f )u], ]t
(6)
]d 1 c 2¹ 2 h9 2 f 2 h9 5 f (z 2 fh9) 1 2J(u, y ) ]t 2 = · (ud),
(7)
]h9 1 d 5 2= · (uh9), ]t
(8)
where c 2 [ gh. We have explicitly segregated on the left-hand side of (7) and (8) the terms that give rise to linear rotating gravity waves, since these terms need to be treated in a special way. It is worth recalling that these equations possess one material invariant of fundamental dynamical importance, namely the potential vorticity q, defined by q[
z1 f . h
(9)
We now describe the three numerical methods we have used for solving the SWE (6)–(8) in a doubly periodic domain: PS, SL, and CASL. To keep the comparison as meaningful as possible, we have used an identical scheme for solving the divergence (7) and continuity (8) equations in all three methods. The simplest and most efficient scheme for this is the semi-implicit pseudospectral method. This scheme consists of employing spectral representations for d and h9, fast Fourier transforms (FFTs), evaluation of the nonlinear products in physical space, semi-implicit leapfrog time stepping, and a Robert–Asselin time filter. The semi-implicit leapfrog time stepping is carried out in a standard way (Ritchie 1988). In (7) and (8), the partial time derivatives of spectral h9 and d are approximated by centered differences, the other terms on the left-hand sides are approximated as averages over the previous and next time levels (t 2 Dt and t 1 Dt), and the terms on the right-hand sides are evaluated at time t. Such time-discretized implicit equations are easily solved for each spectral component of h9 and d at time t 1 Dt. The practical merit of this scheme is that it is numerically stable for large time steps, whereas an explicit scheme would be restricted by the speed of the fastest gravity wave and the grid size. The disadvantage is that small-scale gravity wave motions are numerically inaccurate. In atmosphere and ocean modeling, it is common practice to accept an inaccurate numerical solution of these waves for the sake of being able to use larger time steps. This semi-implicit leapfrog scheme is not stable unless it is coupled with a Robert–Asselin time filter (Robert 1966; Asselin 1972). That filter replaces a field, say
JULY 1999
1553
DRITSCHEL ET AL.
f, at time t by a combination of the fields at t 2 Dt, t, and t 1 Dt just after the latter has been computed; that is, f (x, t) ← f (x, t) 1 A[f (x, t 2 Dt) 2 2f (x, t) 1 f (x, t 1 Dt)].
(10)
This operation in effect damps high-frequency modes, since the term multiplying the filter coefficient A is a finite-difference approximation to (Dt) 2] 2 f /]t 2 . For small A, this filter principally damps small-scale, highfrequency gravity waves (a significant component of which could be artificial). For such waves, ]/]t ; c=, showing that they are subject to an effective viscosity of Ac 2Dt. The filter coefficient A, a dimensionless number, is typically in the range (0.05, 0.3). For the computations presented in the next section, A 5 0.05; we have found that values less than 0.03 lead to numerical instability. Given that the divergence and continuity equations are solved identically for all three methods, it should be clear that the key difference between the PS, SL, and CASL methods rests in the solution of the vorticity equation. We now describe each one in detail. We start by briefly reviewing the PS and SL methods, in order to provide a context for the new CASL method. a. The pseudospectral method In the PS method, (6) is replaced by ]z 1 = · [(z 1 f )u] 5 2n (2¹ 2 ) nz. ]t
(11)
The new term on the right-hand side of (11), usually called ‘‘hyperdiffusion,’’ is necessary for numerical stability. In this paper we have used n 5 3. The value of n is chosen, typically, so that the smallest features (i.e., those comparable to the grid scale) are efficiently dissipated. Here, we have used the expression 2n n 5 C(hQ)/kmax ,
(12)
where C is a dimensionless constant, kmax 5 n g /2 is the highest resolved wavenumber (n g is the grid size), and Q is defined by
)
Q 5 max q 2 x,y
)
f , h
(13)
where the maximum is taken over all points in the computational domain. The idea behind (12) is that hQ is the relevant timescale for the evolution of z. In spite of the definition (13), the actual choice of n remains somewhat ad hoc, in the sense that the constant C can vary substantially. When trying to compute solutions that are as free of dissipation as possible, one picks a value of C as small as possible, without producing too much small-scale noise. For the results presented in the next section, we have used C 5 1.
b. The semi-Lagrangian method Whereas with the PS method only a slightly modified version of (6) is solved, the SL and CASL are constructed on the principle that potential vorticity conservation is a fundamental property of the SWE. Therefore in both the SL and CASL methods, the third prognostic variable z is replaced by the potential vorticity q, and (6) is replaced by Dq 5 0. Dt
(14)
In practice, (14) is solved by trajectory integration; that is, dx 5 u(x, t), dt
(15)
where x is the position of a fluid element; (15) is formally equivalent to (14) since q does not change following x. The same method can be used to advect any conserved tracer. In the SL method, in order to determine q at t 1 Dt, two distinct steps are required: for each grid point x a (the ‘‘arrival’’ point), one first needs to integrate (15) backward in time to determine the location x d (the ‘‘departure’’ point) of that same fluid element at time t. Since x d typically will not fall on a grid point, the second step consists in interpolating q at x d at time t and finally replacing that value at x a at time t 1 Dt. For both steps, we use the simplest and most commonly used schemes [for more details the reader is referred to Staniforth and Coˆte´ (1991) and Gravel (1996)]. The back trajectory computation is done using the midpoint method (Temperton and Staniforth 1987; Bates et al. 1995), x d 5 x a 2 Dtu
1
2
xa 1 xd , t n11/2 , 2
(16)
together with a linear time extrapolation, 3 1 u(x, t n11/2 ) 5 u(x, t n ) 2 u(x, t n21 ), 2 2
(17)
and a bilinear spatial interpolation for the evaluation of the velocity at departure points from (17) at t n11/2 . The second step is carried out using the so-called bicubic Lagrange interpolation, which is commonly used in meteorological modeling (Bates et al. 1995; Ritchie et al. 1995). It is worth noting that no explicit dissipation needs to be incorporated in the SL method. It is implicitly provided, as the results of the next section will demonstrate, by the interpolations of u and q that are performed at each time step (Gravel 1996). c. The contour-advective semi-Lagrangian method The new CASL method for the SWE is also based on the idea that potential vorticity conservation is es-
1554
MONTHLY WEATHER REVIEW
sential, but it carries that idea much farther than the SL method: q is represented in a fully Lagrangian way. Specifically, q is discretized by level sets of uniform value q j separated by contours across which it jumps by Dq, each contour being represented by a set of nodes. This discretization is at the heart of the contour dynamics method, which has been implemented to solve a variety of two-dimensional and quasigeostrophic problems (Dritschel 1989). The original contour dynamics method rested on the existence of a linear inversion relation (Dritschel 1989) giving u directly and solely in terms of q. For q represented as a piecewise-uniform function, this permits one to calculate u from integrals over the q contours. However, for all but the simplest flows and linear inversion relations, this process is computationally expensive, proportional to the square of the number of points representing the q contours. A major improvement in the computation of u for general flows was recently introduced by Dritschel and Ambaum 1997 (hereafter DA), who developed the CASL method for multilayer quasigeostrophic dynamics. Within the CASL method, the computation of u at each time step is carried out by first interpolating q onto a grid and then performing a spectral inversion. The contour-togrid conversion, a very fast operation, not only eliminates the need for the existence of an inversion relation for potential vorticity (hence allowing a full generalization of the contour approach to the primitive equations), but also provides a very substantial improvement in computational performance, typically of several orders of magnitude. The novelty of this paper is the implementation, for the first time, of a contour-based method to a system of equations for which no inversion relation exists. Since the CASL method for the SWE presented in this paper is a direct carryover from the CASL method for quasigeostrophic dynamics, we limit the discussion here to a broad sketch, and we refer the reader to DA for all details. Briefly, given q in terms of contours and the fields d and h9 on a grid of size n g 3 n g at time t, each node x i on the q contours needs to be advected to t 1 Dt. The first step consists in computing the velocity u so that (15) may be used. This is accomplished, as in the original CASL method, by projecting the contoured potential vorticity onto a grid finer than n g (specifically, of size m g n g , where m g is typically equal to 4) and performing an iterative averaging so as to obtain a smooth q field on a grid of size n g . Once q is thus constructed, the vorticity z is readily obtained from (9), since h is also known on the grid. Finally, the gridded velocity field u is computed directly from z and d using, as is customary, the streamfunction c and the velocity potential x defined by
z [ ¹ 2 c and d [ ¹ 2 x, and related to the velocity components via
(18)
VOLUME 127
]x ]c ]x ]c 2 and y 5 1 . (19) ]x ]y ]y ]x These operations are performed with spectral transforms. Once the velocity u is known on the grid, each node on the potential vorticity contours can be advected forward to time t 1 Dt. This is done by solving (15) in a manner identical to the one described above for the SL method, the only difference being that in the CASL method the advection is done forward rather than backward. Hence, together with bilinear spatial interpolation, (16) and (17) are used directly, exchanging x d with x a and letting Dt → 2Dt. Once all the nodes on the q contours are stepped forward, the nodes may be redistributed; this is necessary because, while the area enclosed by each q contour is approximately conserved, its perimeter may increase drastically as the flow becomes complex, and thus nodes need to be added to preserve accuracy (see DA for details). The key difference between the SL method and the CASL method is now apparent: in the CASL method, once the nodes are time-stepped forward no interpolation of q is necessary. In contrast, the SL method requires that, once each grid point has been time-stepped backward, the potential vorticity itself be interpolated (e.g., with the bicubic Lagrange scheme). This interpolation of q results in substantial diffusion, as the results of the next section will show, and degrades the accuracy of the method. Of course, the extremely small scales in q that are inevitably generated by the forward enstrophy cascade in complex rotating, stratified flows pose a problem for any method, whether Eulerian or Lagrangian, and they need to be removed. In the CASL method this is accomplished with contour surgery. This procedure [fully documented in Dritschel (1989) and with some refinements added in DA] effectively acts only on the very smallest scales by topologically reconnecting contours and eliminating very finescale filamentary structures. While contour surgery may rightly be viewed as an ad hoc procedure, it is no more ad hoc than the familiar hyperdiffusion used in the PS method. The key difference is that contour surgery does not diffuse q gradients, a severe drawback of hyperdiffusion (Mariotti et al. 1994; Jime´nez 1994; Macaskill and Bewick 1995; Yao et al. 1995). Moreover, the surgery scale d s—below which q ceases to be conserved—can be chosen to be much smaller than the grid scale on which the d, h9, and u fields are held, typically 10 times as small.1 Hence u5
1 The application of contour surgery at a tenth of the scale of the grid on which the advecting winds are represented was originally motivated by recent contour advection studies (Waugh and Plumb 1994; Norton 1994) using both observed and model winds. These studies show that potential vorticity features down to a tenth of the wind grid scale are negligibly influenced by the subgrid-scale velocity field. Hence very thin potential vorticity filaments behave passively, and can therefore be removed with little effect on the dynamics (see also Methven and Hoskins 1998).
JULY 1999
1555
DRITSCHEL ET AL.
the CASL method is able to capture potential vorticity structures much smaller than the grid scale, and this considerably improves its convergence over both the PS and SL methods. One final CASL procedure needs to be discussed before presenting numerical test results. Assuming that the initial condition (whether from a model or from data) is given on a grid, one needs to generate q contours to carry out the Lagrangian advection. The simplest way is to first determine the minimum and maximum value qmin and qmax in the computational domain. The range (qmin , qmax ) is then divided into n c 1 1 levels. Each level corresponds to a region R j (possibly multiply connected) where q assumes a spatially uniform value q j defined by
1 2
1 q j [ qmin 1 j 2 Dq, 2
j 5 1, . . . , n c 1 1,
(20)
with Dq 5
qmax 2 qmin nc 1 1
yˆ 5 y 1 c m sinmx 1 c n sinnx (21)
representing the potential vorticity jump across each contour. This simple scheme yields a potential vorticity representation consisting of exactly n c 1 1 regions separated by n c contours. 3. Numerical tests To test the new CASL method, and to compare it directly with the PS and SL methods, we have chosen a relatively simple initial flow—a perturbed unstable zonal jet—which rapidly becomes very complex. We believe that complexity is generic to geophysical flows, and is precisely what makes the design of numerical algorithms for the solution of the primitive equations such a challenging task. Moreover, the nonlinear evolution of unstable jets is commonly observed in both the atmosphere and the ocean, and therefore this test is highly relevant. We have considered using simpler test cases, for example, the propagation of a single linear Rossby wave or the advection of a height anomaly. Such flows have been proposed by Williamson et al. (1992) as test cases for the SWE in spherical geometry. We believe, however, that many of those cases lack the complexity necessary to adequately test the performance of numerical algorithms that are being proposed for practical applications. Hence, our initial flow is specified by prescribing the potential vorticity as follows: q(x, y, 0) 5 q 1 Q sgn(yˆ)(a 2 | |yˆ| 2 a|)
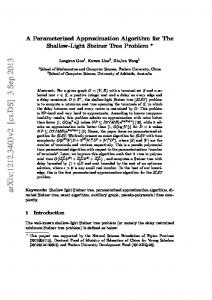
FIG. 1. (a) The unperturbed potential vorticity q, (b) the corresponding u velocity, and (c) perturbation height h9, all used for the test case.
(22)
for |yˆ| , 2a, and q 5 q otherwise; Q is the amplitude of the potential vorticity anomaly, q is the mean potential vorticity determined by the requirement of zero mean relative vorticity, 2a is the distance from the minimum to the maximum potential vorticity, and
(23)
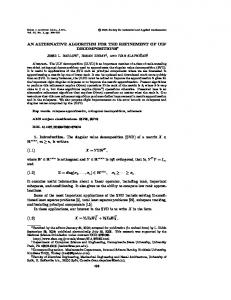
is a displaced y coordinate (which preserves the area of differential elements) used to perturb the jet. For the numerical integrations, we have chosen the scalings h 5 1, L R 5 c/f 5 0.5, a 5 0.5, hQ/f 5 1, and f 5 4p, the latter implying that a unit time interval corresponds to a day. Our doubly periodic domain spans the range (2p, p), and thus covers about 12.5 deformation radii in each direction, the jet itself being about four deformation radii wide. The unperturbed q profile (i.e., with c m 5 c n 5 0), the associated zonal flow u, and the corresponding balanced height field anomaly h9 are show in Fig. 1. Notice that the h deviates by up to 40% from its mean value, while max |u/c| ø 0.45; moreover, max |z /f | ø 0.9 (not shown), demonstrating that this flow is strongly ageostrophic. The q profile in Fig. 1a is perturbed by choosing m 5 2, n 5 3, c 2 5 20.1, and c 3 5 0.1 in (23). With q thus specified, the initial depth h9 and divergence d fields are then initialized using the balance conditions ] 2 h9/]t 2 5 ] 2 d/]t 2 5 0. It is more common to balance a flow by setting ] n d/]t n 5 0 and ] n11 d/]t n11 5 0, for (small) integer n (cf. Norton 1988), but because there is no rigorous definition of balance, our conditions are equally acceptable; moreover, they give results that differ little from those obtained with zero second and third time derivatives of divergence. This will be discussed in a forthcoming article. We start by illustrating the complexity that emerges during the time evolution of such an apparently benign initial condition. In Fig. 2a, the potential vorticity q is shown for the first 10 days of a high-resolution CASL calculation, using a grid size n g 5 256 for d and h9, and with n c 5 20 contours used to discretize q. Notice how steep potential vorticity gradients form very rapidly (cf. the t 5 2 frame). We stress that such high gradients are not peculiar to this initial condition, but are a generic property of geophysical flows. The nonlinear evolution
1556
MONTHLY WEATHER REVIEW
VOLUME 127
FIG. 2. (a) The evolution of the potential vorticity q at 2-day intervals for the perturbed unstable jet of Fig. 1. This CASL solution is obtained with n c 5 20 contours to represent q, and a grid of size n g 5 256 for d and h9. (b) The corresponding h9 field.
leads to the breakup of the initial jet into a number of vortices, each eventually composed of a rather flat core surrounded by a very complicated jumble of filamentary structure (cf. the t 5 10 frame in Fig. 2a). It is important to contrast this very complex q field with the corresponding height field h9, shown in Fig. 2b. The deceptively smooth height field masks all the real complexity of the flow evolution. For this reason we consider this field (and for similar reasons the streamfunction c) to be an inadequately sensitive mea-
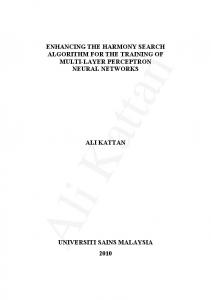
sure with which to test the accuracy of a numerical method. For the reader perplexed as to whether the perhaps surprisingly complex evolution of the above initial condition may be an artifact of the contour representation and surgery in the CASL method, we present in Fig. 3 a direct comparison of the potential vorticity field at day 10 at even higher resolution (n g 5 512) computed with the three methods described in the previous section, and using the same initial condition as for Fig. 2. First notice
JULY 1999
DRITSCHEL ET AL.
1557
FIG. 2. (Continued )
how, at this very high resolution, the CASL method (Fig. 3a), the PS method (Fig. 3b), and the SL method (Fig. 3c) are all in rather good agreement. The complexity of the evolution, therefore, is intrinsic to the flow, not a numerical artifact. Second, the key differences relate, as expected, to the steepness of the potential vorticity gradients and to the small-scale features. The CASL method is able to resolve scales one-tenth the grid size (where surgery is applied) and hence can support much steeper gradients than the other two methods. Moreover, since the CASL method controls the cascade to small scales through surgery, it does not diffuse the potential vorticity field.
This unwanted yet inevitable diffusion in both the PS and SL method is readily apparent in Figs. 3b and 3c. Consider for instance how, in both cases, the complex filamentary structure surrounding most vortices is substantially smoothed out in the PS and SL solutions. In this respect, it would seem that the SL method, in which the numerical diffusion occurs through repeated interpolations and is thus not directly controllable, does worse that the PS method. Contrast the two largest vortices in the flow and notice how the PS solution has captured steeper potential vorticity gradients. This may be related to the fact that the PS method allows a more direct control of the numerical diffusion via the param-
1558
MONTHLY WEATHER REVIEW
VOLUME 127
FIG. 3. (a) The potential vorticity q at t 5 10 days for a CASL computation identical to the one in Fig. 2 but for a finer grid of size n g 5 512. (b) As in (a) but for a PS computation. The grid size is n g 5 512, as for the CASL case. (c) As in (a) but for a SL computation. Again the grid is of size n g 5 512.
eter n, which was chosen according to (12) for the computation in Fig. 3b. Third, and most importantly, it could be objected that the kind of complexity that the computations in Fig. 3 are able to resolve is of little practical interest. In typical geophysical flows the generation of small scales is sufficiently rapid that the resolution of successively finer
scales by grid refinement might start to resemble the quest for the Holy Grail. Moreover, in realistic circumstances (e.g., for general circulation models) a large portion of the computational resources need to be dedicated to physical processes other than the fluid dynamics (e.g., chemical reactions or radiation schemes). In practice, it could be argued, only modest grid resolutions
JULY 1999
1559
DRITSCHEL ET AL.
TABLE 1. A comparison of the accuracy and efficiency of the CASL, PS, and SL methods for integrations of the initial condition (22) to t 5 5 and t 5 10. Method
ng
Dt
e(5)
e(10)
CASL CASL CASL CASL CASL
32 64 128 256 512
0.04 0.04 0.04 0.04 0.04
0.003197 0.001912 0.001230 0.000737 0.000454
PS PS PS PS PS
32 64 128 256 512
0.02 0.01 0.005 0.002 0.001
SL SL SL SL SL
32 64 128 256 512
0.04 0.04 0.04 0.04 0.04
c(5)
c(10)
0.004364 0.003195 0.002119 0.001568 0.001253
13.33 30.94 86.45 266.83 922.24
35.58 89.31 278.66 931.44 3436.82
0.020451 0.011255 0.006502 0.004591 0.002964
0.024265 0.015660 0.010277 0.008347 0.006714
6.34 31.41 234.36 2287.62 18 933.88
12.68 62.81 468.72 4575.25 37 867.75
0.018739 0.013122 0.008060 0.005093 0.003386
0.024377 0.018155 0.012212 0.008476 0.006752
5.66 16.86 61.79 244.21 999.26
11.31 33.72 123.57 488.42 1998.51
are affordable on which to compute the evolution of the flow. If one is willing to subscribe to this point of view, the question then becomes: for a given grid size, which numerical method yields the ‘‘best’’ solution? Or, more interestingly yet: which method converges faster as the resolution is increased? To answer these questions we present, in Figs. 4 and 5, a direct comparison of the numerical solutions of the initial condition (22) computed with the CASL, PS, and SL methods and with grid resolutions n g 5 32, 64, 128, and 256. The potential vorticity field at day 5 is shown in Fig. 4a. At the highest resolution (cf. top row) all three methods are in good agreement, as expected. However, at very low resolution (cf. bottom row) only the CASL method manages to capture all the key features of the flow, that is, the number, size, and location of the vortices that result from the instability. The principal source of error in the CASL method, at low resolution, is the poor estimation of the advecting velocity field, which is interpolated on a coarse grid. This affects the PS and SL solutions as well, but they additionally suffer from excessive diffusion: hyperdiffusion in the PS case, and interpolation errors in the SL case. Such numerical diffusion is the principal cause for the slower convergence with increasing resolution of the PS and SL methods compared with the CASL method. This is quantified below. Moreover, only at the higher resolutions do the PS and SL solutions start to develop tight potential vorticity gradients similar to those in the CASL solution. The SL method appears to be diffusing more than the PS method (contrast the PS and SL solutions at n g 5 32 and 64), though the very small n we are employing for the PS method (to allow it to diffuse as little as possible) is barely marginal for numerical stability (hence the tiny Gibbs phenomena). Of course at the highest resolution (n g 5 256) all three methods yield nearly identical fea-
tures on the large scales, but the point here is that the CASL method can afford a much coarser grid. The corresponding height fields at day 5 are shown in Fig. 4b. Here, except for the lowest resolution (cf. bottom row), the PS and SL solutions appear to do rather well. This is not surprising since h9 is a smooth field and is thus much easier to compute. However, tracers are not smooth fields and thus the comparison of Fig. 4a is more appropriate. Moreover, it is worth noting that at our lowest resolution (n g 5 32) the initial jet spans approximately 10 grid points. For most current atmospheric general circulation models used for climate studies, a resolution of 18 is considered high; at such resolution, key features such as the subtropical jet span only a few grid points (in the oceans, key features such as the gulf stream tend to be an order of magnitude smaller in scale and are immensely difficult to resolve). Therefore, the CASL method, with its ability to capture the basic large-scale features of smooth fields at very low resolution, offers a substantial practical advantage. Figure 5a shows the potential vorticity fields at day 10. Here the results in all cases converge more slowly, but the flow field is in this case extremely complex. Still, the CASL algorithm converges significantly more rapidly than the other two. And here, the effect of numerical diffusion in the PS and SL algorithms is particularly evident. With n g 5 64 (cf. third row) the CASL method has managed to capture the number, size, and location of the key features in the flow, whereas the PS and SL methods have still not converged to the correct number of vortices and their positions. The corresponding height fields (shown in Fig. 5b) confirm the key idea behind these tests, that is, that the CASL method is able to capture accurate solutions with coarse grid resolutions because it does not suffer from numerical diffusion. We now quantify this statement in a precise way. We measure the accuracy of each simulation by its ability to conserve mass between isolevels of potential vorticity
1560
MONTHLY WEATHER REVIEW
VOLUME 127
FIG. 4. (a) The potential vorticity q at t 5 5 days, for four different grid resolutions n g 5 32, 64, 128, and 256 and for the CASL, PS, and SL methods. (b) The corresponding height field h9 at t 5 5 days.
(the mass between any two material contours in shallow water flows is conserved in the absence of dissipation). The degree of mass conservation is important for a proper assessment of transport properties; it is crucial, for example, to ozone chemistry in the stratosphere (Edouard et al. 1996), and it is no doubt equally important in the oceans. The mass error is computed as follows. The initial q field is divided into regions R j , j 5 2N, . . . , N, each corresponding to a potential vorticity level q j as defined in section 2c above. The mass in each region is m j 5 ##R j h dx dy. Ideally m j does not change in time, but in practice the numerical approximations inevitably lead to changes in m j , and these changes are used to measure the numerical error of each simulation.
The error at time t is defined as the rms difference between m j (t) and m j (0), normalized by the product of h and the domain area Adom ; that is,
e (t) 5
5 O
1 1 hA dom 2N
j
6
1/2
[m j (t) 2 m j (0)] 2
,
(24)
where the sum is over all j except j 5 0. The region R 0 includes all of the fluid with zero anomalous potential vorticity and is much larger than the others. Including this region in the sum above approximately doubles the value of e in the PS and SL simulations, but negligibly increases it in the CASL simulations. This difference is due to the diffusion of q in the PS and SL simulations.
JULY 1999
DRITSCHEL ET AL.
1561
FIG. 4. (Continued )
To compute the m j , R j must be known sufficiently accurately. Following Yao et al. (1995), we interpolate q and h to a finer grid, in this case eight times finer in each direction.2 We then determine j at each point on this fine-resolution grid from the nearest integer value of (q 2 q)/Dq and add to m j the value of h at this point, multiplied by the area of a grid square. This procedure is employed, with no variations, for all three simulation methods. In the results presented next, we choose N 5 10, so that each region R j effectively lies between contours in the CASL simulations. Note, however, that we
2 Using a grid only four times finer leads to differences on the order of 1%.
do not take advantage of this fact in computing the m j’s for the CASL method; as in the PS and SL simulations, we compute the set of grid points lying within each region R j and sum the h values. The accuracy of any algorithm, as all would agree, has little practical value per se. It needs to be contrasted with its efficiency, since the best algorithm is not simply the most accurate, but also the fastest. Hence we present, in Table 1, the error e(t) at the two reference times, t 5 5 and t 5 10 (cf. Figs. 4 and 5), plotted versus the cost c(t) (in seconds) needed to integrate the SWE to those times with the three different methods. All the simulations were performed on a vector-processing Cray-J90 supercomputer, with great care taken to vectorize and, generally, to optimize the performance of each algorithm.
1562
MONTHLY WEATHER REVIEW
VOLUME 127
FIG. 5. (a) As in Fig. 4a but for t 5 10 days. (b) As in Fig. 4b but for t 5 10 days.
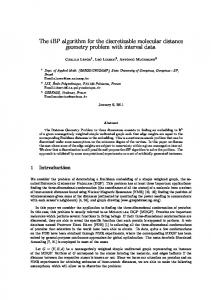
To provide an immediate visual understanding of how the three algorithms compare, we plot in Fig. 6 the error and efficiency data of Table 1, with the cost c(t) on the abscissa and the error e(t) on the ordinate. The three symbols used in that figure represent the three methods: squares for CASL, circles for PS, and triangles for SL. The filled points correspond to the values at the reference time t 5 5 in Table 1, the empty ones at t 5 10. The size of the plotted points indicate the resolution. For each method and each reference time, the data points for the five grid resolutions employed (n g 5 32, 64, 128, 256, 512) are connected together. This makes the effect of increasing resolution immediately clear: for all three methods, increasing n g results in smaller errors and, of course, greater cost. Because of the coordinate choice in Fig. 6, it is readily
apparent that the CASL method outperforms both the PS and SL method. The curves for the CASL solutions (squares) are located closer to the lower-left corner of the plot (where fast and accurate solutions lie) than the curves for the PS and SL solutions. The comparison of the latter two is quite interesting. The SL method is seen to outperform the PS one despite the fact that, at the same grid resolution, the PS method is slightly more accurate (cf. Table 1 and Figs. 4 and 5 where, at the same resolution, the SL method shows more diffusion). The superiority of the SL methods, however, lies in that the PS method is much more costly, due to the CFL constraint on the time step. For a given accuracy, it costs less to use an SL method than a PS one. However, it costs even less to use the CASL method. Consider furthermore that, as can be seen in Fig. 6,
JULY 1999
DRITSCHEL ET AL.
1563
FIG. 5. (Continued )
the CASL curves lie almost entirely below the corresponding PS and SL curves. At t 5 5 (filled curves), one needs to go out to the finest grid n g 5 512 with the PS and SL methods to achieve an accuracy similar to the one that the CASL method achieves with the coarsest grid n g 5 32. With reference to Table 1, this means that for a comparable accuracy (say for an error around 0.003 at t 5 5), the CASL method speeds up the computations by a factor of 75 over the SL method and by a factor of 1450 over the PS method. At t 5 10, the comparison is even better. As can be seen directly in Fig. 6 (empty curves), the error of the coarsest CASL computation is smaller that that of the finest PS and SL computations. Thus, despite the fact that with the coarsest grid (n g 5 32) the advecting velocity field is very crudely represented, the contour dis-
cretization of q in the CASL method still manages to conserve mass between q levels better than the PS and SL simulations with the finest grid (n g 5 512). The lack of mass conservation in the PS and SL simulations is largely a result of numerical diffusion, of using a gridbased scheme for the advection of q. 4. Summary and discussion We have presented a new algorithm for the shallow water equations in which potential vorticity, the fundamental dynamically active tracer, is discretized by level sets separated by contours that are advected in a fully Lagrangian way. This technique allows for numerical dissipation to act only on scales that are much smaller than the scale of the grid on which the divergence and
1564
MONTHLY WEATHER REVIEW
VOLUME 127
barotropic and a multilayer, Boussinesq, primitive-equation algorithm exists (manuscript in preparation), and a spherical version of the present shallow water algorithm is under development. We shall report on these in the near future. Acknowledgments. DGD is supported by the U.K. Natural Environment Research Council, LMP by the U.S. National Science Foundation, and ARM by a scholarship from MCHE of Iran and a U.K. Universities ORS award. REFERENCES
FIG. 6. The mass error, as defined by (24) vs the cost (in seconds) for the solutions shown in Figs. 4 and 5. The symbols indicate the different methods: squares for CASL, circles for PS, and triangles for SL. Empty points correspond to the error-cost values at t 5 5 days, the filled points at t 5 10. The point size increases with resolution, from n g 5 32 (smallest) to n g 5 512 (largest).
height field are represented, and thus yields accurate computations with much coarser grids than semi-Lagrangian or spectral methods. The use of contour advection in the new algorithm furthermore overcomes the numerical diffusion explicitly or implicitly associated with grid-based advection. Numerical diffusion is required in grid-based methods to avoid the buildup of artificial structure at the grid scale; hyperdiffusion is used widely in pseudospectral methods, and implicit diffusion occurs when interpolating tracers in semi-Lagrangian methods. The new CASL method, by contrast, is virtually free of numerical diffusion. For the test case reported here, this results in a speedup of nearly two orders of magnitude over the semi-Lagrangian method, and more than three orders of magnitude over the pseudospectral method, for similar accuracy. The contour representation can be extended directly to any conservative tracer and may be particularly appropriate for those circumstances (e.g., the stratospheric circulation) where the velocity field stretches and folds tracers into extremely fine filaments. Moreover, since the contour-to-grid conversion is a very fast operation, the contour representation can also be extended to reactive tracers. A scheme for incorporating general diabatic terms in the potential vorticity equation has been developed (Ambaum and Dritschel 1998). With further work, contour advection could be implemented in realistic atmospheric and oceanic models for those fields, notably tracers, where finescales are invariably generated and may be important for the chemical, moisture, or energy balances. Already, a spherical
Ambaum, M. H., and D. G. Dritschel, 1998: The inclusion of nonconservative forcing into a conservative, contour advection algorithm. Numerical Methods for Fluid Mechanics VI, M. J. Baines, Ed., ICFD, 99–110. Asselin, R., 1972: Frequency filter for time integrations. Mon. Wea. Rev., 100, 487–490. Bates, J. R., Y. Li, A. Brandt, S. F. McCormick, and J. Ruge, 1995: A global shallow-water numerical model based on the semiLagrangian advection of potential vorticity. Quart. J. Roy. Meteor. Soc., 121, 1981–2005. Dritschel, D. G., 1989: Contour dynamics and contour surgery: Numerical algorithms for extended, high-resolution modelling of vortex dynamics in two-dimensional, inviscid, incompressible flows. Comp. Phys. Rep., 10, 77–146. , and M. H. P. Ambaum, 1997: A contour-advective semi-Lagrangian algorithm for the simulation of fine-scale conservative fields. Quart. J. Roy. Meteor. Soc., 123, 1097–1130. Edouard, S., B. Legras, F. Lefe`vre, and R. Eymard, 1996: The effect of small-scale inhomogeneities on ozone depletion. Nature, 384, 444–447. Gravel, S., 1996: The semi-Lagrangian Method. Proc. Centre de Recherches Mathematiques, Montreal, PQ, Canada, 1–11. Hoskins, B. J., M. E. McIntyre, and A. W. Robertson, 1985: On the use and significance of isentropic potential-vorticity maps. Quart. J. Roy. Meteor. Soc., 111, 877–946. Jime´nez, J., 1994: Hyperviscous vortices. J. Fluid Mech., 279, 169– 176. Macaskill, C., and B. M. Bewick, 1995: The use of hyperviscosity in simulations of geophysical fluid flows. Proc. 12th Australasian Fluid Mechanics Conf., Sydney, Australia, 415–418. Mariotti, A., B. Legras, and D. G. Dritschel, 1994: Vortex stripping and the erosion of coherent structures in two-dimensional flows. Phys. Fluids, 6, 3954–3962. McIntyre, M. E., 1995: The stratospheric polar vortex and sub-vortex: Fluid dynamics and midlatitude ozone loss. Philos. Trans. Roy. Soc. London, 352, 227–240. Methven, J., and B. Hoskins, 1998: Spirals in potential vorticity. Part I: Measures of structure. J. Atmos. Sci., 55, 2053–2066. Norton, W. A., 1988: Balance and potential vorticity inversion in atmospheric dynamics. Ph.D. thesis, University of Cambridge, 167 pp. , 1994: Breaking Rossby waves in a model stratosphere diagnosed by a vortex-following coordinate system and a technique for advecting material contours. J. Atmos. Sci., 51, 654–673. Plumb, R. A., and Coauthors, 1994: Intrusions into the lower stratospheric Arctic vortex during the winter of 1991–1992. J. Geophys. Res., 99, 1089–1106. Ritchie, H., 1988: Application of the semi-Lagrangian method to a spectral model of the shallow water equations. Mon. Wea. Rev., 116, 1687–1598. , C. Temperton, A. Simmons, M. Hortal, T. Davies, D. Dent, and M. Harmud, 1995: Implementation of the semi-Lagrangian meth-
JULY 1999
DRITSCHEL ET AL.
od in a high resolution version of the ECMWF forecast model. Mon. Wea. Rev., 123, 489–514. Robert, A. J., 1966: The integration of a low order spectral form of the primitive meteorological equations. J. Meteor. Soc. Japan, 44, 237–245. Staniforth, A., and J. Coˆte´, 1991: Semi-Lagrangian integration schemes for atmospheric models—A review. Mon. Wea. Rev., 119, 2206–2223. Tan, D. G. H., P. H. Haynes, A. R. MacKenzie, and J. A. Pyle, 1997: Effects of fluid-dynamical stirring and mixing on the deactivation of stratospheric chlorine. J. Geophys. Res., 103 (D1), 1585– 1605. Temperton, C., and A. Staniforth, 1987: An efficient two-time-level semi-Lagrangian semi-implicit integrating scheme. Quart. J. Roy. Meteor. Soc., 113, 1025–1040.
1565
Waugh, D. W., and R. A. Plumb, 1994: Contour advection with surgery: A technique for investigating finescale structure in tracer transport. J. Atmos. Sci., 51, 530–540. , and Coauthors, 1994: Transport of material out of the stratospheric Arctic vortex by Rossby wave breaking. J. Geophys. Res., 99, 1071–1088. Williamson, D. L., J. B. Drake, J. J. Hack, R. Jakob, and P. N. Swarztrauber, 1992: A standard test set for numerical approximations to the shallow water equations in spherical geometry. J. Comput. Phys., 102, 211–224. Wunsch, C., and D. Stammer, 1995: The global frequency-wavenumber spectrum of oceanic variability estimated from TOPEX/ Poseidon altimetric measurements. J. Geophys. Res., 100 (C12), 24 895–24 910. Yao, H. B., D. G. Dritschel, and N. J. Zabusky, 1995: High-gradient phenomena in 2D vortex interactions. Phys. Fluids, 7, 539–548.