The design and implementation of a notional machine for teaching introductory programming Michael Berry
Michael Kölling
School of Computing University of Kent Canterbury, Kent, UK
School of Computing University of Kent Canterbury, Kent, UK
[email protected]
[email protected]
ABSTRACT
1.1
Comprehension of programming and programs is known to be a difficult task for many beginning students, with many computing courses showing significant drop out and failure rates. In this paper, we present a new notional machine design and implementation to help with understanding of programming and its dynamics for beginning learners. The notional machine offers an abstraction of the physical machine designed for comprehension and learning purposes. We introduce the notional machine and describe an implementation in BlueJ.
The difficulties involved in learning to program are well documented; Kim & Lerch provide a summary[5]. Many students fail or drop out of introductory courses, Bennedsen and Caspersen[1] report average failure rate of 33%. A popular hypothesis presented by Boulay[2] states that students find the concepts of programming too hard to grasp, do not understand the key properties of their program, and do not know how to control them by writing code. Boulay took this as a starting point and motivation to formalise the concept of a notional machine; an abstraction designed to provide a model to aid in understanding of a particular language construct or program execution. Some teachers, when presented with the idea of a notional machine, are initially skeptical, holding the view that students need to understand what “really happens”. It should be noted that all models held by almost all programmers are notional, in that they represent simplifications of the real machine. Even discussions about assembly language or machine code are almost necessarily abstractions, since hardware optimisations of modern processors are so complex that they cannot fully be taken into account when reasoning about program execution. Thus a meaningful discussion about notional machines does not centre around the question whether or not to use one, but around the most useful level of abstraction to aim for. Whatever the preferred abstraction level, it is important that the notional machine is able to explain all observable behaviour of the real machine in the targeted application domain, and reasoning about the notional machine must allow accurate predictions to be made about behaviour of the real machine.
Categories and Subject Descriptors K.3.2 [Computer and Information Science Education]: Computer science education
General Terms Human Factors
Keywords Program visualization, novice programming
1.
INTRODUCTION
The teaching of introductory programming within computer science is essential, and mastery of this skill necessary for students to progress. To be successful in programming, students have to be able to form a valid and consistent mental model of the machine executing their instructions. Forming such a model is not easy, and the computing education community has no agreed model in widespread use. Often, ad-hoc models are formed by instructors or students, but these are not guaranteed to be consistent or correct. A shared, accepted and valid mental model – a notional machine – would benefit both instructors and students in their attempts to teach and learn programming.
Permission to make digital or hard copies of all or part of this work for personal or classroom use is granted without fee provided that copies are not made or distributed for profit or commercial advantage and that copies bear this notice and the full citation on the first page. To copy otherwise, to republish, to post on servers or to redistribute to lists, requires prior specific permission and/or a fee. WiPSCE ’13, November 11–13, 2013, Aarhus, Denmark Copyright 2013 ACM 978-1-4503-2455-7/11/13 ...$15.00.
1.2
Notional Machines
The status quo
At present, one of the most common techniques for teachers to explain the dynamic elements of object orientation is through the drawing of diagrams of objects and classes, often by hand on a whiteboard. No consistent, complete and widely accepted shared notation exists across classrooms, and it is left to the student to form a mental model based on often ad-hoc diagrams the teacher may use. One contribution of this work is to provide a shared model and notation that can be used by teachers and lecturers, in textbooks and in discussions. Such a model is commonly expressed in diagrammatic form, and the diagram notation is presented in this paper. The second contribution is an implementation of this notional machine in a software system. This software tool, implemented as an extension of the BlueJ en-
vironment[6], uses the notation to visualise the execution of a Java program in real time. In this paper, the diagrams produced by the software tool will serve to also introduce the general diagrammatic notation.
Aim 2 : To provide a valid mental model for learning and reasoning about object-oriented programming.
2.
These aims further lead us to the two principle research questions:
RELATED WORK
Several educational software systems are in use in classrooms that offer presentations and animations of notional machines. UUhistle[10] is a software tool that provides animated, live visualisations of the execution of Python programs. The model employed operates at a fairly low level, animating single statements to illustrate the functionality of single constructs, such as assignment or parameter passing. A related tool, Jeliot[8], operates at a similar conceptual level to UUhistle. Also of interest is JGrasp[3]; an integrated environment providing several separate visualisations of parts of the system. The use and effectiveness of these systems for learning is still under debate. Although literature regarding algorithm visualisation effectiveness is readily available, literature on program visualisation is more scarce. For algorithm visualisations, one meta-study[4] found a high correlation of effectiveness in those studies that actively involved the students. Similar results have not yet been shown for program visualisations. Where literature does exist, it is far from conclusive, with different studies even on the same tool claiming different results. In one study evaluating Jeliot’s effectiveness, Moreno and Joy found that on average, the transfer of knowledge from the tool to the student was not successful[7]. However, a different study (also using Jeliot) claims “a significant percentage of students had achieved better results when they were using a software visualisation tool”[9]. For our own work this means that demonstrating the effectiveness of the tool has yet to be demonstrated in future work. No convincing prior work exists that allows reliable conclusions to be drawn about the efficacy of such systems.
3.
RESEARCH QUESTIONS
This work supports two distinct and separate use cases: the comprehension of programming and the comprehension of programs. The first is most relevant for beginning programmers: the goal here is to understand how a computing system executes program code, the mechanics and details of a programming language and the concepts of the underlying paradigm. Typical questions that the system helps to answer in this case are What does an assignment statement do? or How does a method call work? For experts who have mastered the language this aspect is no longer relevant. The second use case is to understand and investigate a given program. The goal is to become familiar with a given software system, or to debug a program. Typical questions in this case are Why does my program behave like this? or How many objects are being created when I invoke this method? This part of the functionality remains relevant even for seasoned programmers. These use cases lead us to the main aims of the model: Aim 1 : To provide a shared notation for representing the execution of an object-oriented program within the proposed model.
Aim 3 : To provide a basis for an implementation in software that can be used to provide a visualisation of the model alongside a running object-oriented program.
Research question 1 : Can a consistent, correct and complete (in the context of the defined problem space) model be developed which explains the observed behaviour of the execution of object oriented programs? Research question 2 : Can this model be implemented in animated form, in software, to provide a visualisation for the execution of object oriented programs? For the purpose of RQ1, we define consistent to mean that valid reasoning within that model must correctly predict the behaviour of the underlying system; we define complete to mean that all observed behaviour within the problem space should have a representation within the model. Thus, completeness is defined against a given problem space. Our targeted problem space covers Java programs of a complexity up to first year university programming problems. Thus, we can explicitly exclude some constructs from our model, if we postulate that they are outside our targeted problem space. From these research questions, a hypothesis is formed for the expected outcome of this work: Hypothesis : The formation and use of the model is useful for the learning of object-oriented programming and the comprehension of the behaviour of given programs. Our model works at the level of visualising objects, classes, methods and the call chains between them. It also shows state of objects, but does not work at the level of simple statements.
4.
NOTATION
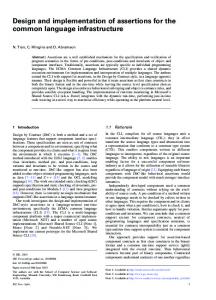
Figure 1 shows the default diagram for a simple program. Classes are represented as peach coloured rectangles and objects are shown using dark red rectangles with rounded corners. This notation has been maintained from the original BlueJ representations. The arrows in this diagram represent references – a single “ClockDisplay” object with references to two separate “NumberDisplay” objects. One significant difference in representation of objects in this diagram and those in the previous versions of BlueJ on the object bench is the naming scheme. On the object bench, the objects were given unique identifiers (names). This is a conceptual misrepresentation, conflating variables (which have names) with objects (which have not). The new notional machine notation avoids this misconception by not naming the objects themselves; instead, names are attached to references. These names are not initially shown, but clicking on any object reveals its expanded view, showing the state of all its fields and references.
4.1
Expanded object view
Figure 2 shows a similar program state with all objects expanded. The references previously anchored to the middle
Figure 1: The clock display project.
of the “ClockDisplay” in the collapsed view are now anchored to a particular field. Fields which contain references to other objects are shown as reference arrows; primitive fields are shown by displaying the corresponding literal directly in the field.
4.2
Methods
Methods can be invoked interactively on any object in the diagram by right-clicking an object and selecting the method from the object’s pop-up menu. When an execution is being performed, currently active methods are shown in the diagram. Active methods are displayed as rectangles with rounded corners at the bottom right of the object on which they were called. Static methods are represented in the same way, but attached to the class rather than the object. Arguments, if any are passed, are displayed in the parentheses consistent with the representation of fields on objects.
4.3
Figure 2: An object diagram with overlaid call sequence showing a chain of method invocations.
Call Sequences
Most commonly, a call sequence is represented by a stack diagram separate from object diagrams as, for example, in the UUhistle and Jeliot systems. The overall state of the system is then presented in separate views, and users must expend some mental effort to amalgamate these different representations while the program is executing. Our notional machine notation avoids this separation and dual representation by combining this information in a single diagram. The call sequence is overlaid on the objects in the main display. Figure 2 shows an example of a call chain during execution. The “timetick()” method was interactively invoked and then called the “updateDisplay()” method, which in turn called “append(“01”)”. When drawing on a whiteboard, these arrows can be overlaid over the object diagram and are typically drawn and wiped out to illustrate the dynamic nature of calls. In the software implementation of the notional machine, this sequence is animated, with method boxes fading in and out as their execution begins and ends, and the call chain arrow extending and contracting as the calls are made. Users can control the speed of this animation. The last called (currently active) method is displayed with a highlight colour, allowing users to visually follow the locus of execution as the call animation is executing. Simple execution chains, such as the one presented here, are easily and clearly represented in the diagram. For longer and more complex chains of calls, a good layout algorithm
is important to maintain readability of the notation. Improving the layout algorithms currently used is an area of ongoing work in our system. The visualisation of recursion is also an interesting use case, since the arrow will point back to the current method an arbitrary number of times. This is implemented by visualising the arrow looping back on itself, with a number attached showing the count of recursive invocations along this path.
4.4
Software Visualisation
So far the notation was relevant to both hand drawn and programmatically generated diagrams. The following details some controls present in the software visualisation of the diagram.
4.4.1
Speed and stepping granularity
The speed slider (Figure 3) controls the pace at which the visualisation unfolds, which therefore determines how fast the program executes. If the slider is all the way to the right then no pauses are added. With the slider at the other extreme, on the far left, a pause of 2 seconds is added between each step of the program. The interim levels have pauses that scale linearly between these two values. A “step” of the program in our context is a method call or a method return (in traditional terms, a push or pop operation on the stack) – single statement executions are not visualised.
4.4.2
Level of Detail
The notation allows for a range of detail to be included or excluded, depending on intended focus of the user. The detail slider controls this level in the generated diagram. Supporting different levels of detail allows a range of use cases to be supported in a practical, readable notation. In the first weeks of learning, for example, a student may depict the execution of a small program consisting only of a few lines of code, and very few objects and method calls. She may be interested in understanding how objects can interact and how method calls operate.
be released to students and teachers. It is thus not yet published, but freely available on request. Work in the near future will concentrate on two main areas: First, the implementation of a better layout algorithm, and second, testing usability with first year students.
6.
SUMMARY
Notional machines exist to provide way for learners to better understand how a particular program is executing, and thus provide students with a valid way to model the execution of a program. This paper describes a model and notation for a notional machine and the implementation of a dynamic program visualiser using this notation.
7.
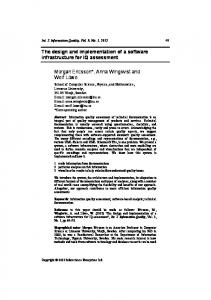
Figure 3: The heatmap view while the program is executing. Note the differing colours on the objects showing different levels of activity.
Later examples will include programs with dozens or hundreds of objects and the execution of thousands of lines of code. In this case, attention may be on the number of objects being created and their overall interactions, but denoting every single parameter value as it is being passed is no longer of interest. Our software implementation therefore allows control over the display by offering seven different levels of detail. In the full detail view, objects are shown in their expanded state when created, displaying the value of their fields. Methods are shown as they are invoked, with a call chain arrow animated to show method invocation and method return. When parameters are passed, this is animated; the value is shown moving from the calling method, along the call chain, to the parameter slot in the invoked method. This level of detail is gradually reduced across these levels until the heatmap view is reached (section 4.4.3).
4.4.3
Heatmap
The heatmap view provides the least level of detail of execution and is optimised for large programs which may create many hundreds or thousands of objects. Three main changes can be seen when switching to heatmap view (Figure 3): The objects are shown in a more compact notation using just enough space to display their type, they fade to a very dark purple colour, and a colour key is displayed in the top right of the screen. In this view, as the execution unfolds, the objects “warm up” as more methods are invoked, first turning a lighter purple, then red, then yellow. All objects cool down gradually while not being active, so that the notation always highlights the objects performing most of the recent activity. This notation allows to easily perceive object creation and destruction, as well as hotspots of activity.
5.
FUTURE WORK
At present the implementation is in a usable state for research purposes; further refinement is needed before it can
ACKNOWLEDGEMENTS
We wish to thank Michael Caspersen for many discussions about notional machines and their potential uses in programming education. His thoughts and ideas were instrumental in shaping this project.
8.
REFERENCES
[1] Jens Bennedsen and Michael E. Caspersen. Failure rates in introductory programming. SIGCSE Bull., 39(2):32–36, June 2007. [2] Du Boulay. Some difficulties of learning to program. Journal of Educational Computing Research, 2:57–73, 1986. [3] T. Dean Hendrix and James H. Cross II. jGRASP: an integrated development environment with visualizations for teaching java in CS1, CS2, and beyond. J. Comput. Sci. Coll., 23(2):170–172, December 2007. [4] Christopher Hundhausen, Sarah A. Douglas, and John T Stasko. A meta-study of algorithm visualization effectiveness. Journal of Visual Languages & Computing, 13(3):259–290, June 2002. [5] Jinwoo Kim and F. Javier Lerch. Why is programming (sometimes) so difficult? programming as scientific discovery in multiple problem spaces. Information Systems Research, 8(1):25 –50, March 1997. [6] Michael K¨ olling, Bruce Quig, Andrew Patterson, and John Rosenberg. The BlueJ system and its pedagogy. Computer Science Education, 13:249–268, December 2003. [7] Andr´es Moreno and Mike S. Joy. Jeliot 3 in a demanding educational setting. Electronic Notes in Theoretical Computer Science, 178(0):51–59, July 2007. [8] Andr´es Moreno, Niko Myller, Erkki Sutinen, and Mordechai Ben-Ari. Visualizing programs with jeliot 3. page 373. ACM Press, 2004. [9] Sanja Maravic Cisar, Dragica Radosav, Robert Pinter, and Petar Cisar. Effectiveness of program visualization in learning java: a case study with jeliot 3. International Journal of Computers Communications & Control, 6, 2011. [10] Juha Sorva and Teemu Sirki¨ a. UUhistle. pages 49–54. ACM Press, 2010.