there are now several 3D graphics software API's on the ... Explorer [8], which exhibit object-oriented features such .... downstream of the graph traversal. Also ...
Submitted to Visualization ‘96
The Design and Implementation of an Object-Oriented Toolkit for 3D Graphics and Visualization William J. Schroeder Kenneth M. Martin William E. Lorensen GE Corporate Research & Development
Abstract The Visualization Toolkit (vtk) is a freely available C++ class library for 3D graphics and visualization. In this paper we describe core characteristics of this toolkit. This includes a description of object-oriented models for graphics and visualization; methods for synchronizing system execution; a summary of data representation schemes; the role of C++; issues in portability across PC and Unix systems; and how we automatically wrap the C++ class library with interpreted languages such as Java and Tcl. We also demonstrate the capabilities of the system for scalar, vector, tensor, and other visualization techniques.
1.0
Introduction
Two important trends are emerging in the computer industry. These are the development of object-oriented systems, and the use of more complex user interface methods, especially the use of 3D computer graphics and visualization. Object-oriented systems offer the possibility to create better, more maintainable systems with reusable software components. Computer graphics offers a window into the computer and the virtual worlds created there; and when coupled with visualization, enables users to rapidly explore and understand complex systems. Taken together, these two trends will be major forces as the computer industry moves into the 21st century. It is clear that 3D graphics and visualization are entering mainstream use. As evidence of this we cite the widespread use of 3D graphics in the entertainment and gaming industries, and its support on the PC. For example, there are now several 3D graphics software API’s on the PC, including OpenGL [1], and hardware boards ranging in cost from hundreds to thousands of US dollars. Object-oriented methods are now widely recognized as effective software design and implementation tools. Design methodologies due to such researchers as Rumbaugh [2] and Booch [3] are receiving widespread attention, while C++ [4], SmallTalk [5], and other objectoriented languages have become widely successful software implementation tools. Also, a variety of class libraries are available, ranging from standard data structures to mathematics and numerical equation solvers. These trends have only recently converged (in the last half-decade) into object-oriented tools for 3D graphics and visualization. They have influenced commercial sys-
Application Level Toolkits Low Level a) Building applications with toolkits
Tcl/Tk (or Java) Interpreted Interface C++ Class Library (compiled) b) Toolkit architecture
Figure 1 System architecture
tems such as AVS [6], IBM Data Explorer [7], and Iris Explorer [8], which exhibit object-oriented features such as modular and extensible components. However, despite such features, not all systems are implemented using OO techniques and languages, and are often difficult to use independent of their graphical user environment. In this paper we describe our efforts towards building a object-oriented (OO) toolkit, vtk, for 3D graphics and visualization [9]. We begin by listing our design goals and follow with an overview of our object design. In the implementation section we discuss many important issues such as graphics portability; design for an interpreted language; and our method for updating the visualization network. We conclude with examples to demonstrate central features of our design.
2.0
Design Goals
From the inception of the toolkit, we had a series of highlevel design goals. These goals were based on our previous work with a proprietary system we referred to as LYMB/VISAGE [10][11], as well as our experience dealing with user’s of visualization systems. These goals are described in the subsections that follow. 2.1
Toolkit Philosophy
One important lesson we learned from prior experience is that building large, monolithic systems is detrimental to software flexibility. As a result, we wanted to create a sharply focused object library that we could easily embed and distribute into our applications. Figure 1(a) illustrates the basic idea. Toolkits enable complex applications to be built from small pieces. The key here is that the pieces must be well defined with simple interfaces. In this way they can be readily assembled into larger systems.
2.2
Interpreted Language Interface
2.5
Freely Available
Computer languages are usually one of two types: compiled or interpreted. Compiled languages are usually higher performing than interpreted languages, but interpreted languages offer greater flexibility. Our experience has shown that interpreted applications can be built significantly faster than compiled applications, mainly through the elimination of the compile/link cycle. (Shared libraries and incremental compilation techniques are improving the interactivity of compiled systems, but a gap remains.) Also, interpreted languages are written at a higher level than compiled languages. This results in simpler, more compact code that is faster to write and debug. Compiled systems, however, are absolutely necessary when creating high-performing visualization applications. Compiled systems also offer low-level access to computer system resources. We wanted our system to have the best of both the compiled and interpreted approaches (Figure 1(b)). As a result, we decided to build the core computational objects using a compiled language, and the higher level applications using an interpreted language. We also wanted to make sure that there was a crisp boundary between the compiled core and the interpreted language. This requirement insured that the compiled core could be easily separated from the interpreted language and easily imbedded into applications.
A pragmatic lesson of the computer industry is that for software to succeed, it must be widely used and supported. As researchers we decided that the best way to accomplish this was to make the source code freely available. Anticipated benefits of this approach include the ability to better disseminate our algorithms, collaborate with other researchers, develop credibility in the graphics and visualization fields, and offer tools for educational and research purposes. We also knew that outside users would offer bug fixes and valuable suggestions to improve the system.
2.3
3.0
Standards Based
In our prior work with the LYMB/VISAGE system, we used our own special methodology and the C programming language to build an object-oriented system. This system also featured our own interpreted scripting language. While this system served us well for over a dozen years, we soon found that it was an uphill battle to encourage others to adopt our methodology. We also found that the software support and maintenance burden increased dramatically as the system grew in complexity. As a result, we decided that the new system must use standard components and languages. 2.4
Portable
Years of experience with computer graphics has made us skeptical that any single graphics library will become a standard. Even OpenGL, which is a widely accepted 3D standard, may be supplemented or even superceded by the recent flurry of interest in 3D games, multi-media, and internet access. Consequently, we wanted a high-level abstraction for 3D graphics that would be independent of new incarnations of graphics libraries. In this way applications written in the system could be easily ported as new standards become available. Compatibility issues also arise due to differing windowing systems on Unix, PC, and other platforms. Another important design goal was to keep the core system independent of windowing systems.
2.6
Simple
We often find that concepts that we take for granted in computer science and graphics are not always easily transferrable to users of our visualization tools.These users are typically overwhelmed with their own work load (e.g., design, analysis, etc.), and cannot afford the time to learn and maintain a working knowledge base of computer graphics and visualization. Hence we have adopted the following quote from Albert Einstein as our credo. “Everything should be as simple as possible, but not simpler.” By keeping the system simple, we expect to encourage wider use of visualization and 3D graphics. Other benefits of this philosophy include reduced effort to maintain, extend and interface to the toolkit.
Object Models
There are two distinct parts to our object design. The first is the graphics model, which is an abstract model for 3D graphics. The second is the visualization model, which is a data-flow model of the visualization process. 3.1
The Graphics Model
The graphics model captures the essential features of a 3D graphics system in a form that is easy to understand and use. The abstraction is based on the movie-making industry, with some influence from current graphical user interface (GUI) windowing systems.There are nine basic objects in the model. 1. Render Master - coordinates device-independent meth-
ods and creates rendering windows. 2. Render Window - manages a window on the display
device. One or more renderers draw into a render window to generate a scene (i.e., final image). 3. Renderer - coordinates the rendering of lights, cam-
eras, and actors. 4. Light - illuminates the actors in a scene. 5. Camera - defines the view position, focal point, and
other camera characteristics. 6. Actor - an object drawn by a renderer in the scene.
Actors are defined in terms of mapper, property, and a transform objects.
Render master creates rendering windows
Instances of render window Renderer instances
Actor instances Property Transform Mapper (geometry)
Figure 2 Graphics model 7. Property - represents the rendered attributes of an actor
including object color, lighting (e.g., specular, ambient, diffuse), texture map, drawing style (e.g., wireframe or shaded); and shading style. 8. Mapper - represents the geometric definition of an
actor and maps the object through a lookup table. More than one actor may refer to the same mapper. 9. Transform - an object that consists of a 4x4 transfor-
mation matrix and methods to modify the matrix. It specifies the position and orientation of actors, cameras, and lights. Figure 2 illustrates these concepts in concrete form. Note that derived objects of these base classes are available to extend the functionality of the toolkit. For example, the assembly object is a type of actor that enables hierarchical grouping of objects for purposes of property specification or collective transformation. Other objects, such as color lookup tables, also play an important role in the visualization system, but are not described here for brevity. To achieve portability of this design we developed the concept of device objects. These objects are derived classes of abstract superclasses, or extend the functionality of graphics classes in a device dependent way. An example of a derived device class is the OpenGL renderer. The OpenGL renderer is a subclass of the abstract superclass renderer. When the user constructs a generic renderer and rendering window in the system using the render master class, the render master instantiates the appropriate device-specific renderer. For example, on a Sun Unix system, the following code vtkRenderMaster rm; renderWindow = rm.MakeRenderWindow(); aRen = renderWindow->MakeRenderer();
creates a device-dependent render window appropriate to the system’s windowing system (i.e., X Windows), and a device-dependent renderer appropriate to the graphic library (i.e., Sun’s XGL). The same code run on a PC, however, would create a Windows rendering window, and an OpenGL renderer. Lights, cameras, properties, and actors are examples of generic objects that have device-dependent counterparts
C
B output
dataset A
Camera defines view
Lights illuminate scene
input
A
dataset B
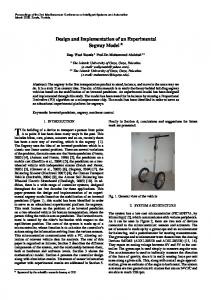
Figure 3 Visualization model. Process objects A, B, C input and/or output one or more data objects. Data objects represent and provide access to data; process objects operate on the data. Objects A, B, and C are source, filter, and mapper objects, respectively.
(e.g., OpenGL actor, OpenGL light, etc.). When these generic objects are created, device dependent objects are created automatically that interface to the appropriate graphics library. This is generally transparent to the user, and insures that all applications are completely independent of the particular graphics library. In fact, to port an application to a new graphics library, only the device dependent objects need be coded. The application itself remains unchanged. Our graphics design compares favorably to Open Inventor [12], which is a commercial toolkit available from SGI. In the Inventor model, the abstract model is based on a scene graph. A scene graph is an acyclic, directed graph of nodes, where nodes correspond to such objects as actors, lights, cameras, properties, and transforms. The major difference is that the Inventor model closely follows the state-machine based, graphics engine that is implemented in OpenGL. The rendering process is a traversal of the graph, where each node affects the current state of the rendering process. Thus, the order of the nodes in the graph has significant impact on the final image. Although the state-based traversal is powerful and efficient, it does violate a fundamental tenet of object-oriented design. That is, the behavior of every object is completely determined from its inputs and local instance variables. In a scene graph, changes to a node in the graph can affect objects downstream of the graph traversal. Also, the scene graph model is not intuitive to casual graphics programmers. 3.2
The Visualization Model
The vtk model is based on the data-flow paradigm adapted by many commercial systems. In this paradigm, modules are connected together into a network. The modules perform algorithmic operations on data as it flows through the network. The execution of this visualization network is controlled in response to demands for data (demand-driven) or in response to user input (eventdriven). The appeal of this model is that it is flexible, and can be quickly adapted to different data types or new algorithmic implementations. Our visualization model consists of two basic types of objects: process objects and data objects (see Figure 3). Process objects are the modules, or algorithmic portions of the visualization network. Data objects, also referred to as datasets, represent and enable operations on the data that flows through the network.
a)
b)
c)
e)
d)
vtkDataSet
vtkStructuredPoints
vtkPointSet
vtkStructuredGrid
vtkPolyData
vtkUnstructuredGrid
f) Figure 4 Dataset types. a) polygonal data, b) structured points, c) structured grid, d) unstructured grid, e) unstructured points, f) object diagram using OMT [2] notation.
Process objects may be further classified into one of three types: sources, filters, and mappers. Source objects initiate the network and generate one or more output datasets. Filters require one or more inputs and generate one or more outputs. Mappers, which require one or more inputs, terminate the network. In our toolkit we initially selected five types of data as shown in Figure 4. As indicated by this figure, an abstract interface to data is specified by the dataset object. Subclasses of dataset include polygonal data (corresponding to the graphics data vertices, lines, polygons, and triangle strips), structured points (representing both 2D images and 3D volumes), and structured and unstructured grids (e.g., finite difference grids and finite element meshes). In addition, it was convenient to define another abstract object, point set, which is a superclass of objects with explicit point coordinate representation. The fifth data type, unstructured points, was not implemented because it could be represented by one or more of the other types. (Unstructured points are point locations without an topological relationship to one another.) An important feature of our data model is the concept of cells. A dataset consists of one or more cells. Each cell is considered to be atomic visualization primitive. Cells represent topological relationships between the points that compose the dataset. The primary function of cells is to locally interpolate data or compute derivatives of data. In vtk, twelve cell types ranging from the 0D vertex to the
3D hexahedron are recognized. Each is a subclass of the abstract cell class, and additional cell types may be easily derived. Note that cells are not necessarily explicitly represented by datasets. For example, the voxel cells in a volume (i.e., structured points dataset) are not explicitly represented since this would incur a severe storage penalty. Instead, when the system requests a particular voxel, the voxel is built on the fly from the dimensions, origin, and aspect ratio of the volume, and the cell id of the voxel. One nice feature of our object-oriented design is that we can take advantage of the dataset inheritance hierarchy to construct generic or specific process objects. Generic process objects operate on datasets - the particular type of dataset is immaterial to the operation of the filter. On the other hand, process objects can be specially constructed for a particular dataset type. For example, the contour filter operates on any dataset type, generating point, line, and surface primitives depending upon the input type. The decimation filter, however, has been specifically constructed to operate on polygonal data, allowing the implementor to make performance enhancing assumptions about the nature of the data. This allows the implementor of process objects to make a trade-off between generality and efficiency. 3.3
Object-Oriented Design Issues
To the OO purist, the design of our visualization system poses some problems. In usual OO design, data structures and methods are encapsulated into objects. In our design, algorithms (i.e., methods) and datasets (i.e., data structures) are encapsulated separately. Our departure from what might be considered a purer OO design is based on three factors. First, combining complex algorithms and datasets into a single object would result in excessively large objects. The simplicity and modularity of the resulting design would be compromised. Second, combining algorithms and datasets into objects would result in repeating code, since the implementation of an algorithm for different data types often differs only in regions of data access. Third, users naturally view algorithms as objects that operate on data objects. Thus the design is comfortable to users, which is a key element of good system design. Other researchers differ from our view. In particular Favre [13] has presented a design that encapsulates data objects and algorithms into single objects. We expect that this will remain an open research issue as visualization systems becomes more widely used.
4.0
Implementation Issues
While a high-level object design goes a long way towards creating useful systems, the implementation details often make or break the user acceptance of a system. In this section we describe some key issues we addressed to make our system easier to use.
4.1
Programming Languages
Our choice of compiled language was predicated on the need for an efficient, object-oriented core. C++ fulfills these requirements [4]. In addition, C++ offers other important features. It is widely used with a large choice of development tools and compilers. C++ is also a strongly typed system. This feature is used in our toolkit to enforce (at compile time) correct connectivity between process and data objects in the visualization network. We constrained our use of C++ to conservative features. Multiple inheritance was abandoned early due to the resulting complexity and problems with compilers. Advanced features like templates and exception handling were also ignored, mainly due to the fact that the compilers we used at the time we started implementation were unreliable. We found the language easy to work with when used this way. Because we architected our toolkit to include an interpreted language completely independent of the core compiled language, we had a number of possible interpreted languages to choose from. Our initial choices were Tcl, Python, and Perl, languages used by many software developers. For our initial interpreted language we decided to use Tcl [14]. Our choice was based on the relative popularity of Tcl, and because of the Tcl-based Tk widget set. Tcl/Tk is a powerful development environment offering portable GUI development on Unix and Windows systems. Because we choose Tcl/Tk, we are able to build complex user interfaces on top of our toolkit, as well as interface to the many Tcl/Tk packages. The size of our compiled toolkit (100,000+ LOC) made it infeasible to manually “wrap” it with Tcl. Instead, we built a simplified C++ parser to automatically generate Tcl wrapper code [15]. Because the parser recognized certain coding conventions we had adopted, it was easier to create than a formal C++ parser. Well over 90% of the public methods are automatically wrapped in this way. (A small hints file was created to help the parser correctly interpret ambiguous or more complex statements.) Approximately 70,000 lines of wrapper code were generated using this approach. Since the implementation of our Tcl/Tk interpreted layer, Java [16] has emerged as arguably the best known interpreted language. Using our simple parser, we were able to wrap our library with Java over the course of two months. (Most of the time was spent learning the internals of Java.) Our ability to wrap the core with Java validated our toolkit architecture, and indicates that using other interpreted languages is an open possibility. 4.2
Conventions
We adopted a number of conventions that accelerated our implementation efforts, including documentation efforts. Some simpler conventions include using a standard, long, and descriptive naming scheme for objects, methods, and variables; adopting standard templates and styles for coding; and applying a vtk prefix to object names to avoid namespace collision with other C++ class libraries. How-
ever, the two most important conventions we used were embedding of documentation directly in the source code, and the use of standard Set/Get methodology to read and write object instance variables. Embedding the documentation directly in the code served two important functions. First, it allows developers to directly pursue on-line source and header files for information about particular objects. Second, it allows us to automatically generate manual pages and HTML web documents. The benefit is that the chore of documentation is distributed into the implementation of the object. Thus documentation is just part of coding an object. When updated documents are required, a simple procedure is initiated that can generate the documents automatically. For reading and setting the value of object instance variables, we used a standard array of Set/Get macros. These macros provide a uniform interface to objects, as well as enforcing uniform object behavior. For example, one important feature of our system is that every object maintains an internal modification time. (This will become important when we discuss network execution shortly.) The Set macros insure that the modification time is correctly maintained. When setting an instance variable, these macros compare old values with new ones, only updating the modification time of the object if the value of the instance variable has changed. In addition, the macros can be enabled to print out debugging information, if desired. 4.3
Network Topology and Execution
Building visualization networks is a process of connecting process and data objects (Figure 5(a)). The major issue here is to make sure that the input(s) to a process object are of the correct type, and that non-terminating loops in the network are correctly managed. Once a proper network is constructed, a mechanism is required to update the network as input data or object parameters change. The strong type checking of C++ plays an important role here. The SetInput() method of a filter only accepts the specified dataset class or its subclasses. To connect the output of filter A to the input of filter B, a construct of the following form is used: B->SetInput( A->GetOutput() );
Thus A’s output type must be the same as B’s input type, or a subclass of B’s input type. Looping in a network occurs when the input to an object B is the output of an object D, where D depends on the output of B (Figure 5(b)). Although such situations are not common, in some cases they can be used to advantage. For example, numerical integration of a set of points through a vector field can be simulated by the network of Figure 5(b). Here, the motion of the point set P is controlled by the vector values at P, and as P moves, vector values are resampled at P’s new positions. The process repeats, moving P through the dataset. In vtk, infinite looping is prevented by setting an internal flag. Process objects set this flag when they begin to
A
B
points (shared)
C
(ref. count=3)
A
D
local data
a) Update: C to B to (A and D) Execute (If A modified): A then B then C probe velocity
A
B
move point
C select points
B
C local data
local data
(ref. count=1)
Favor Computation: A executes B executes C executes D executes
D C
b) Network with loop
Favor Memory A executes B executes B releases memory C executes D executes B releases memory
A B D
Figure 5 Network execution
execute. This flag prevents infinite recursion from occurring if the execution of the network happens to return to the object. Thus, loops are allowed but only executed once per network execution. The execution of the network is based on an implicit scheme. In this scheme each process object maintains an internal modification time and execution time. Then, when output from a process object A is requested, A compares its internal modified time and the modified time of its inputs against its last execution time. If A has been modified, or its inputs modified more recently than its last recorded compute time, then A will re-execute. There are two parts to updating the network using this implicit scheme: an update pass that compares modified and execution times, and an execution pass in which process objects may be re-executed to bring them up to date. Most commercial systems use a graphical interface to select, connect, and execute visualization networks. While extremely powerful, the graphical interface is often an obstacle to creating networks with branching or conditional execution, or complicates embedding visualization networks into an application. Although solutions have been proposed for this problem [17], the implementation of our toolkit using procedural languages makes selective network execution easy to program and control. It also simplifies embedding our toolkit into applications. 4.4
Memory Management
A major concern when implementing visualization in data-flow form is the amount of memory consumed. The toolkit addresses this issue by implementing a referencecounting scheme, and allowing the user to tailor the network to favor computation or memory. Reference counting allows process objects to share data objects, or portions of data objects. As the top half of Figure 6 illustrates, if portions of data are passed through the network unchanged, the data can be referenced by other objects without duplication. The key to this approach is to keep track of the number of objects referring to a refer-
Figure 6 Memory management. (top) reference counting, (bottom) memory/computation trade-off
ence counted object. When the reference count goes to zero, the referenced object automatically deletes itself. In some applications memory resources are scarce, while in others the cost to compute the output of a filter or network is high. The toolkit provides facilities to accommodate these needs. Networks can be tailored to favor memory preservation at the expense of additional computation, or computation can be favored at the expense of additional memory requirements, or a combination of both. These capabilities are implemented by providing flags to control the automatic deletion of output data as the network executes. For example, as the bottom half of Figure 6 illustrates, if the flag is enabled and memory resources are favored, after the process object B finishes execution, it signals its input process object A to delete its output data. Favoring memory means that A will always re-execute if any part of the network that depends on A needs to re-execute. On the other hand, if computation is favored, A will not re-execute unless it or its input data is modified. Instead, A maintains its output in memory, and can provide it without computation to B when necessary. 4.5
Issues in Object-Oriented Implementation
A major criticism of object-oriented systems is that often they are slower performing than equivalent systems implemented in conventional procedural languages. This is due to the requirement to copy data between objects to preserve object encapsulation, the access of object instance variables through formal methods, and the overhead of constructing and deleting objects. While we have found this performance penalty to be real, its effect can be minimized in three ways. First, the system must not create and destroy large numbers of objects. For example, in vtk there is a points object that represents an array of x-y-z coordinates. An inefficient implementation would represent each point with a separate object, requiring excessive constructor/destructor
overhead and data access. Second, the amount of data copying must be minimized. Instead, large pieces of data (i.e., datasets), are encapsulated as an object, and then a references to this object are exchanged as the data moves through the system. Finally, C++ offers an inline capability. This can greatly improve system performance by eliminating function call overhead. However, the inline capability has no effect if the methods are dynamically bound, or if the compiler chooses to ignore the inline directive, so the capability is often limited.
5.0
Examples
The following examples illustrate the use of the toolkit in practical application. 5.1
construct the visualization pipeline. 5.2
Hello Cone - Tcl/Tk version
In this example, the previous example is repeated except that it is implemented using the Tcl interpreter. Note that a special Tk interface is included (i.e., vtkInt.tcl). This is an interpreter widget and allows interactive modification to the application. source vtkInt.tcl # create a rendering window and renderer vtkRenderMaster rm; set win [rm MakeRenderWindow]; set ren [$win MakeRenderer]; set iren [$win MakeRenderWindowInteractor];
Hello Cone - C++ version
In this example we create and render a cone represented with a polygonal mesh. (The original idea for this example is adapted from Wernecke’s Inventor Mentor [12].) The example is implemented in C++ and shows a simple pipeline with no intermediate filters. #include "vtk.hh" main () { vtkRenderMaster rm; vtkRenderWindow *win=rm.MakeRenderWindow(); vtkRenderer *ren=win->MakeRenderer(); vtkRenderWindowInteractor *iren= win->MakeRenderWindowInteractor(); //create an actor and give it cone geometry vtkConeSource *cone = new vtkConeSource; cone->SetResolution(8); vtkPolyMapper *mapper = new vtkPolyMapper; mapper->SetInput(cone->GetOutput()); vtkActor coneActor = new vtkActor; coneActor->SetMapper(mapper); // assign our actor to the renderer ren->AddActors(coneActor); // draw the resulting scene win->Render(); //start event loop iren->Start(); }
There are some important features of this example. First, the vtkRenderWindowInteractor is a 3D widget. It captures mouse and keystroke events in the rendering window. Typical functions include wireframe/surface display, picking, and a toggle into 3D stereo viewing. Second, because lights and a camera are not created, the system automatically creates them. Finally, this source code will compile and run on any Unix (using OpenGL, GL, Sun’s XGLR, or HP’s Starbase renderer), or Windows 95 or NT system (using OpenGL). The system automatically selects the correct renderer based on what’s available on the system. Also notice the use of the SetInput()/GetOutput() methods to
# create an actor and give it cone geometry vtkConeSource cone; cone SetResolution 8; vtkPolyMapper mapper; mapper SetInput [cone GetOutput]; vtkActor coneActor; coneActor SetMapper mapper; # assign our actor to the renderer $ren AddActors coneActor; # enable user interface interactor $iren SetUserMethod \ {wm deiconify .vtkInteract}; $iren Initialize; # suppress tk window; start the event loop wm withdraw .
Color Plate 1 shows the output of this example including the Tcl/Tk interpreter. 5.3
Generate An Isosurface
In the next example we show a portion of a network used to read 16-bit medical data and generate isosurfaces [18] for skin and bone. The example is implemented in C++ and the results are shown in Color Plate 2. // read the volume vtkVolume16Reader *v16=new vtkVolume16Reader; v16->SetDataDimensions(64,64); v16->SwapBytesOn(); v16->SetFilePrefix ("../../../data/headsq/quarter"); v16->SetImageRange(1, 93); v16->SetDataAspectRatio (3.2, 3.2, 1.5); // extract the skin vtkMarchingCubes *skin=new vtkMarchingCubes; skin->SetInput(v16->GetOutput()); skin->SetValue(0, 500);
5.4
Decimate and Smooth Polygonal Mesh
In this example we read a Cyberware laser digitizer file, decimate (i.e., reduce polygon count) [19], and Laplacian smooth [20] the polygonal mesh. (Surface normals are also
calculated.) A portion of the network implemented in Tcl is shown. The resulting image is shown in Color Plate 3. vtkCyberReader cyber; cyber SetFilename “../../data/fran_cut” vtkDecimate deci; deci SetInput [cyber GetOutput]; deci SetTargetReduction 0.9; deci SetAspectRatio 20; deci SetInitialError 0.0002; deci SetErrorIncrement 0.0005; deci SetMaximumIterations 6; vtkSmoothPolyFilter smooth; smooth SetInput [deci GetOutput]; smooth SetNumberOfIterations 20;
found the toolkit easy to use, extend, and maintain, and found that applications are portable across Unix and PC’s. The software is freely available and can be found at http://www.cs.rpi.edu/~martink . We welcome all comments, suggestions, bug reports, and contributions.
References [1] [2]
[3] [4] [5]
vtkPolyNormals normals; normals SetInput [smooth GetOutput];
[6]
vtkPolyMapper cyberMapper; cyberMapper SetInput [normals GetOutput]; [7]
vtkActor cyberActor; cyberActor SetMapper cyberMapper; eval [cyberActor GetProperty] SetColor 1.0 0.49 0.25;
5.5
Other Examples
The Visualization Toolkit is comprised of over 300 classes. Visualization techniques for scalar, vector, and tensor visualization are available. Modelling algorithms such as decimation, implicit modelling, extrusion, texture cutting, Delaunay triangulation, splatting, and glyphing can also be used to create complex visual displays. Color Plates 4 through 10 demonstrate capabilities of vtk. Plate 4 shows a cut plane through a structured grid. Plate 5 shows streamtubes in a vector flowfield. Plate 6 is the visualization of a quadric function showing 2D and 3D contours and cut planes. Plate 7 shows four hyperstreamlines [21] in a tensor field. The tensor field is generated from a point load in a semi-infinite domain. In Plate 8 is an example of multidimensional, unstructured data visualization for financial loan data. The axes are monthly payment, interest rate, and loan amount. The grayish wireframe surface shows the total data population, and the red surface show accounts that are delinquent on loan payment. Plate 9 shows the application of transparent textures [22] to cut-away and reveal the inner structure of a mechanical assembly.
6.0
[8] [9]
[10]
[11]
[12] [13]
[14] [15] [16] [17]
[18]
[19]
Conclusion [20]
We have developed a toolkit for 3D graphics and visualization. The toolkit core is implemented as a compiled C++ class library, and an interpreted application layer has been implemented in Tcl/Tk. We have successfully built applications in both C++ and Tcl, and have been able to embed the C++ toolkit into other systems. As anticipated, we have
[21]
[22]
J. Neider, T. Davis, Mason Woo. OpenGL Programming Guide. Addison-Wesley, 1993. J. Rumbaugh, M. Blaha, W. Premerlani, F. Eddy, and W. Lorensen. Object-Oriented Modeling and Design. Prentice-Hall, Englewood Cliffs, New Jersey, 1991. G. Booch. Object-Oriented Design with Applications. Benjamin/ Cummings Publishing Co., Redwood City, CA, 1991. B. Stroustrup. The C++ Programming Language. Addison-Wesley, Reading, MA, 1986. A. Goldberg. “Smalltalk-80: The Interactive Programming Environment.” Addison-Wesley, Reading, MA, 1984. C. Upson, T. Faulhaber Jr., D. Kamins and others. “The Application Visualization System: A Computational Environment for Scientific Visualization.” IEEE Computer Graphics and Applications. 9(4):30-42, July, 1989. Data Explorer Reference Manual, IBM Corp, Armonk, NY., 1991. IRIS Explorer User’s Guide, Silicon Graphics Inc., Mountain View, CA, 1991. W. Schroeder. K. Martin, W. Lorensen. The Visualization Toolkit An Object-Oriented Approach to 3D Graphics. Prentice Hall, Upper Saddle River, NJ, 1996. W. J. Schroeder, W. E. Lorensen, G. D. Montanaro and B. Yamrom. “A Run-Time Interpreted Environment for Rapid Application Development.” GE Corporate R&D Report No. 91CRD266. January, 1991. W. J. Schroeder, W. E. Lorensen, G.D. Montanaro, and C. R. Volpe. “VISAGE: An Object-Oriented Visualization System.” Proc. of Visualization ‘92, pp. 219-226, IEEE Computer Society Press, Los Alamitos, CA, 1992. J. Wernecke. The Inventor Mentor. Addison-Wesley, 1994. J. M. Favre and J. Hahn. “An Object Oriented Design for the Visualization of Multi-Variate Data Objects.” Proc. of Visualization ‘94, pp. 319-325, IEEE Computer Society Press, Los Alamitos, CA, 1994. J. K.Ousterhout. Tcl and the Tk Toolkit. Addison-Wesley Publishing Company, Reading, MA, 1984. K. Martin. “An Approach to the Automatic Wrapping of a C++ Class Library into Tcl.” Submitted to Tcl/Tk Workshop ‘96. T. Ritchey. Java! New Riders Publishing, Indianapolis, IN., 1995. G. Abram and L. Treinish. “An Extended Data-Flow Architecture for Data Analysis and Visualization.” In Proceedings of Visualization ‘95, pp. 363-370, IEEE Computer Society Press, Los Alamitos, CA, 1995. W. E. Lorensen and H. Cline. “Marching Cubes: A High Resolution 3D Surface Construction Algorithm.” Computer Graphics, 21(4):163-169, July, 1987. W. Schroeder, J. Zarge, and W. Lorensen. “Decimation of Triangle Meshes.” Computer Graphics, 25(3), (Proc. SIGGRAPH `92), July, 1992. G. Taubin. “A Signal Processing Approach to Fair Surface Design.” Proc. SIGGRAPH ‘95. pp. 351-358, August 1995. T. Delmarcelle and L. Hesselink. “Visualizing Second-Order Tensor Fields with Hyperstreamlines.” IEEE Computer Graphics and Applications, 13(4):25-33, 1993. W. Lorensen. “Geometric Clipping with Boolean Textures.” Proc. of Visualization ‘93, pp. 268-274, IEEE Computer Society Press, Los Alamitos, CA, Press, October 1993.
Plate 1 - “Hello Cone” example showing rendering window and Tcl/Tk interpreter.
Plates 2-4 - Isosurfaces from medical dataset; decimated and smoothed mesh; cut plane in structured grid.
Plates 5 & 6 - Streamtubes in flow around post; visualization of quadric function.
Plates 7-9 - Hyperstreamlines around point load; splatted multi-dimensional data; texture cutting to reveal inner structure of assembly.