The Design and Implementation of FIT: a Flexible Instrumentation Toolkit De Bus, Bruno
[email protected]
Chanet, Dominique De Sutter, Bjorn
[email protected] [email protected] Van Put, Ludo De Bosschere, Koen
[email protected] [email protected] Electronics and Information Systems (ELIS) Department Ghent University, Sint-Pietersnieuwstraat 41 9000 Gent, Belgium
ABSTRACT
While in theory a program can be instrumented at any point in a compiler tool chain, in practice it is simplest and most useful to add instrumentation code in a postcompilation executable code rewriting step. Most importantly, this ensures that the instrumentation does not influence the compiler code generation. Moreover, it enables the instrumentation of precompiled library code. Several link-time or post-link-time executable code rewriting systems have been developed in the past [7], but they all fail with respect to at least one usability criterium. Our new binary code instrumentation toolkit FIT combines the following usability properties:
This paper presents FIT, a Flexible open-source binary code Instrumentation Toolkit. Unlike existing tools, FIT is truly portable, with existing backends for the Alpha, x86 and ARM architectures and the Tru64Unix, Linux and ARM Firmware execution environments. This paper focuses on some of the problems that needed to be addressed for providing this degree of portability. It also discusses the trade-off between instrumentation precision and low overhead.
Categories and Subject Descriptors C.4 [Computer Systems Organization]: Performance of Systems—Measurement techniques; D.2.5 [Software Engineering]: Testing and Debugging—tracing;diagnostics; D.3.4 [Programming Languages]: Processors—code generation;compilers
• Portability FIT at the moment has back-ends for the Alpha, x86 and ARM architectures, and for the Tru64Unix, Linux and ARM Firmware Suite execution environments. Support for the IA64 and MIPS32 architectures is under construction.
General Terms
• Extensibility FIT’s user interface is implemented as a collection of wrappers on top of the open-source executable code editing framework Diablo. To extend FIT, it suffices to add more wrappers around the existing analyses and transformations.
Experimentation, Performance
Keywords performance, code abstraction, code compaction
• Precision FIT can guarantee that all addresses occurring in the original program remain unchanged.
1.
• Tunability When full precision is not needed, FIT can disable it to minimize the instrumentation overhead.
INTRODUCTION
Compiler and computer architecture research depends on the analysis of run-time program information, and during the last decades many tools for collecting run-time information have been developed: emulators [1], static instrumentation tools [8, 9], run-time instrumentation tools [3, 5] and hardware monitoring tools [11]. This paper presents FIT, a Flexible Instrumentation Toolkit for static instrumentation.
In the remainder of this paper, Section 2 first discusses the shortcomings of existing related work. Section 3 then presents FIT, focusing on how FIT overcomes the previously mentioned shortcomings. In Section 4, the performances of different precisions of instrumentation are compared, and conclusions are drawn in Section 5.
2. RELATED WORK Before presenting FIT in more detail in the Section 3, this section briefly discusses existing work in the field of binary code instrumentation and the shortcomings thereof. Given the very large number of existing run-time information collection tools, we limit ourselves to one example for each of three classes of instrumentors: Diota [3] for dynamic instrumentation, Simics [4] for emulation and ATOM [9] for static
Permission to make digital or hard copies of all or part of this work for personal or classroom use is granted without fee provided that copies are not made or distributed for profit or commercial advantage and that copies bear this notice and the full citation on the first page. To copy otherwise, to republish, to post on servers or to redistribute to lists, requires prior specific permission and/or a fee. PASTE’04, June 7–8, 2004, Washington, DC, USA. Copyright 2004 ACM 1-58113-910-1/04/0006 ...$5.00.
29
(a) instrumentation code file: void InstrumentInit(int p1, char **p2) { AddCallProto("ProgEnd()"); AddCallProto("ProgBegin(int)"); AddCallProto("RecordBlock(int)"); AddCallProto("PrintBlock(long,int)"); } void Instrument(int argc, char **argv, Obj *obj){ int nblocks=0; Proc *p; Block *b; for (p=GetFirstObjProc(obj);p!=NULL;p=GetNextProc(p)) for (b=GetFirstBlock(p); b!=NULL;b=GetNextBlock(b)){ AddCallBlock(b,BlockBefore,"RecordBlock",nblocks); AddCallProgram(ProgramAfter,"PrintBlock",BlockPC(b), nblocks++); } AddCallProgram(ProgramBefore,"ProgBegin",nblocks); AddCallProgram(ProgramAfter,"ProgEnd");
Figure 1: The ATOM instrumentation process }
(b) analysis code file:
instrumentation. To the best of our knowledge, they have at least one of their shortcomings in common with all other existing tools, for which we refer to [7].
extern int block_info[]; FILE* fp; void ProgBegin(int nblocks){ fp = fopen("counts.output","w"); block_info = calloc(nblocks,sizeof(int)); }
2.1 Dynamic Code Instrumentation Dynamic code instrumentation works by intercepting the normal program execution and by inserting instrumentation code in the code to be executed. This enables the instrumentation of self-modifying code and dynamically generated code. For example, Diota [3] is able to instrument code generated by the JIT compiler in the Sun Java Virtual Machine. We believe the existing dynamic instrumentors suffer from three shortcomings, of which the first two are fundamental:
void RecordBlock(int x){ block_info[x]++; } void PrintBlock(long x, int y){ fprintf(fp,"%lx %d\n",x,block_info[y]); } void ProgEnd(){ fclose(fp); }
• The program entities about which compilers need runtime information, such as basic blocks and procedures, are unknown or at best approximated at run-time. • Implementing run-time instrumentation in an OS-less run-time environment, as on some embedded systems, is practically not viable, if not impossible.
Figure 2: Two files specify a basic block execution counter in ATOM’s C-language user interface.
• No existing dynamic instrumentor uses whole-program analyses to minimize the instrumentation overhead.
registers 4 analysis routines. The Instrument procedure describes where calls to the analysis routines should be added, what arguments need to be passed to them, and when they should be executed. For example, the last line states that the procedure ProgEnd should be called after the instrumented program has finished executing. For each basic block, PrintBlock should also be called after the program has executed, with as arguments the address (PC) of the block, and the index in the array that stores the execution counts. Every time a block is executed, RecordBlock will be called with the appropriate index. The four analysis routines are written in C in the analysis code file depicted in Figure 2(b). From these two files, which are first compiled into object code, ATOM creates a custom executable code rewriter whose input will be an executable program, and whose output will be the instrumented program. The main advantage of ATOM is its user-friendly and flexible interface, allowing to specify very simple or very complex analysis routines, ranging from basic block counters to cache simulators. ATOM has several important drawbacks however. Most importantly, instrumentation with ATOM may change the program behavior in at least three ways. First, ATOM’s C-library code shares its data with the program’s C-library code. Obviously, the basic blocks executed
2.2 Simulation Simulation can be seen as a special form of dynamic instrumentation. Besides being orders of magnitude slower than true instrumentation, most simulators, such as Simics [4], suffer from the fact that they simulate whole-systems, including kernel code. As a result, they cannot differentiate between code from different applications and kernel code.
2.3 Static Binary Code Instrumentation ATOM [9] is the most commonly used binary instrumentation tool. Like FIT, ATOM is developed on top of a more general-purpose binary code editing framework that can also be used to optimize programs [10]. ATOM’s instrumentation process is depicted in Figure 1. In a first step, the user runs ATOM on two files that describe how the program should be instrumented. The instrumentation file describes at what program points the program should be instrumented, and the analysis file describes what analysis code should be called at those program points. A simple example of such files to collect basic block counts is depicted in Figure 2. Without going into too many details, the InstrumentInit procedure in the instrumentation code file in Figure 1(a)
30
in the fopen procedure called in the analysis code in Figure 2 should not be counted. ATOM guarantees this by linking uninstrumented copies of C-library procedures into the instrumented program. These uninstrumented copies are then called from the analysis code. However, these copies share their data with their instrumented duplicates. As a result, the behavior of the instrumented code may be disturbed. For example, all handlers of open files are collected in a linked list in the C-library. By opening a file in the analysis code, an additional element is inserted in the shared linked list, thus disturbing all original (now instrumented) program code that traverses the list. Secondly, although the output of the ATOM basic block execution counter will contain the correct, original basic block addresses, the instrumented program itself operates on the code addresses of the instrumented code. These are different because instrumentation code was inserted in between the original code. When program behavior depends on such addresses, instrumentation will again disturb the program. A trivial example of this is a program that outputs the address of its main procedure: the output will differ in ATOM-instrumented program. A more subtle example was detected by Moseley et al [6]: in the program gcc from the SPECint95 benchmark suite, addresses are used as keys for a hashtable. Obviously, when the keys change, the distribution of the hashtable’s contents over its buckets also changes. To measure this distribution to optimize performance, ATOM cannot be used. Finally, we reject the claim by the authors of ATOM [9] that ATOM is easily portable, because ATOM heavily relies on the fact that there is a huge gap in the memory address space between the data segment of a program, and the code segment. On Tru64Unix, this gap in the address space is not used by regular applications, and ATOM exploits it by letting the instrumentation code store its own data there, and by storing parts of the instrumented code and the uninstrumented versions of the C-library routines. As a result, all data in the original programs is located at exactly the same addresses in the instrumented program. Whenever the analysis code needs an address of some data, it can use its address in the instrumented program. This is definitely not possible on platforms that lack such an unused gap between two program segments. Hence we claim that ATOM is not at all portable to such systems.
and (2) compiled analysis code. In concreto, the instrumentation file is compiled with the host compiler and linked to the FIT instrumentation libraries to produce the instrumentor depicted on the right of Figure 3. The analysis code is compiled using the target compiler and linked with the FIT support libraries that provide the standard C-functionality required on the target platform by the analysis code. The thus generated instrumentor depicted on the right of Figure 3 is then run on a binary program to instrument it: it links the analysis code into the binary, and rewrites the binary to call the analysis code with the desired parameters. The internal organization of FIT’s instrumentation libraries is depicted in the instrumentor in Figure 3. Basically these libraries form a software stack on top of Diablo [2], a binary code editor framework that is designed from the ground up to be portable and retargetable. It can be downloaded from http://www.elis.ugent.be/diablo. Diablo consists of a core framework, extended with different object file format and architecture back-ends. Together the core and back-ends provide functionality to read and write object files, to disassemble and assemble code, and to create, manipulate and layout interprocedural control flow graphs (ICFG). Datastructures in Diablo have both an architecturedependent and an architecture-independent part, which enables the implementation of both architecture-independent and architecture-dependent analyses and transformations. FIT’s architecture-dependent instrumentation routines (ADIRs) extend Diablo and add additional functions that are commonly used when instrumenting a binary. The ADIR module for each architecture describes for example how registers should be spilled to the stack, how a function call to the analysis routines should be implemented and how parameters should be passed. The architecture-independent instrumentation routines (AIRs) provide the high-level interface that is used to describe instrumentors in the instrumentation C-files. Parts of this interface are used in the instrumentation file in Figure 2. Furthermore, the AIR take care of a lot of bookkeeping that is used to guarantee precise execution of the instrumented program (see Section 3.4). The FIT support libraries provide procedures that are normally provided by the standard C-library. The reasons for duplicating this functionality are discussed in 3.4.1.
3.2 Portability 3.
THE DESIGN OF FIT
When designing FIT, we tried to impose as few restrictions on the target architecture as possible. The portable binary code framework allows us to do so. In addition, FIT was designed to enable the implementation of a new architecture backend with only basic knowledge of FIT’s infrastructure. Porting FIT to a new architecture consists of two tasks that can easily be split into separate subtasks: creating a new backend for Diablo and adding the necessary ADIRs. FIT’s modular design allows a developer to implement and test these different tasks separately. As opposed to many other instrumentors, FIT does not rely on special operating system support or architecturespecific features. Instead all necessary functionality can be provided by the support libraries.
Because a lot of compiler and computer architecture researchers are familiar with ATOM, we decided to make FIT’s interface backwards compatible with ATOM’s interface.
3.1 Overall Design From the ground up, the overall design of FIT was chosen to overcome the problems with instrumentors described in the previous section, and to meet the portability, extensibility, precision and tunability requirements set forth in the introductory section. Therefore FIT consists of three parts, as depicted in Figure 3: the FIT front-end, the FIT instrumentation libraries and the FIT support libraries. Just like the ATOM-frontend, FIT depends on an instrumentation file to guide the instrumentation process and on an analysis file to specify the code that must be executed at run-time. FIT’s frontend consists of a script that creates (1) an instrumentor
3.3 Extensibility A run-time information collection tool that generates insufficient information is of course of no use to the user.
31
Figure 3: The design of FIT FIT can also revert to using the standard C-libraries of the target architecture. This allows to use FIT without needing to write a target-specific library, but this will obviously cause disruptions in the execution of the instrumented program. Moreover, using a standard C-library for instrumentation with FIT will usually result in slower instrumented programs: since typical program analysis code only uses a small subset of the full C-library functionality, the custom libraries (we have written so far) are much more lightweight, and thus faster, than the standard libraries. For example, some procedures have become so small that Diablo can inline them in the instrumented code. Please note that some intrusion may still be noticeable with separate support libraries. For example, if we return to our example of opening a file in the instrumentation code, it’s easy to see that using a direct open() system call instead of the C library’s fopen() routine does no longer alter the list of open files in the original program. Still the file handle numbers returned by the operating system for any files subsequently opened by the original programs will have changed, because one file handle is now in use by the instrumentation code. It should also be noted that special care needs to be taken when the analysis code dynamically allocates memory, as this changes the layout of the heap, and thus interferes with the data structures of the original program. The solution to the latter problem, as proposed by [9], is to split the heap in two, and let the instrumentation code allocate memory from the far end of the free memory range.
A tool that generates excessive information makes postprocessing of the information obligatory to sift out the useful information and introduces more overhead than necessary. Most instrumentation tools are tailored toward one specific type of information gathering. They are hard to extend and it is hard to turn off unnecessary functionality. ATOM is one of the few existing tools that solve this problem, by allowing the user to specify both the instrumentation and the analysis code. It is for this reason that ATOM has become so popular, and it is for this reason that we decided to be backwards compatible with ATOM. Still, ATOM’s interface is fixed and cannot be extended. This sometimes severely complicates the analysis code, resulting in unnecessary run-time overhead. Moreover, the architectural properties for which the ATOM interface allows to query are specifically tailored for the Alpha architecture. To be useful on other architectures, e.g., with predicated instructions or EPIC architectures, an interface extension is needed that can query their specific instruction properties. FIT is perfectly well suited for such extensions, as the whole user interface of FIT consists of nothing more than wrappers around Diablo’s internal interfaces. As a consequence of this design, every query in Diablo can easily be exported as a FIT query. For example, FIT allows to check whether or not predicated instructions are executed. This feature has proven useful to guide the profile-based optimization of ARM binaries with Diablo.
3.4 Precision This section discusses how FIT solves the problems that were pinpointed in section 2.3. These problems were related to the disturbance of the original program execution and ATOM’s assumption that data sections are not moved.
3.4.2 Allowing Changed Data Addresses As mentioned before, ATOM relies on the fact that code instrumentation on the Tru64Unix platform does not require moving the data of a program in memory. This is not true in other execution environments. Hence, the instrumentation code in FIT needs to take into account that data addresses may have changed. The easiest way to do so is to translate each address occurring in the instrumented program. Suppose we are instrumenting a program to simulate a data cache. Before each load and store, a call is inserted to the Cache() procedure with one argument: the original address at which data is accessed. A straightforward solution is illustrated in pseudo-code in Figure 4(b). Before Cache() is called, its argument is translated from its new to its original value.
3.4.1 Avoiding shared C-library data structures The disturbance of the run-time data structures of the program caused by C-library calls in the analysis code can be avoided to a large extent by not using the simple approach of duplicating C library code. Instead, the added instrumentation code should use its own (limited) support library, or even direct system calls, to open and write files and request services from the operating system. For the Tru64Unix, Linux and ARM Firmware environments, FIT comes with such support libraries. Adding additional ones is straightforward.
32
original code:
(a) original code:
jmp *%eax
add r2,r3,r4 ; r2 := r3+r4 load r1,10(r2) ; load the value at r2+10 into r1
instrumentation code:
(b) instrumentation code (ordinary translation) sub $4, %esp pusha push %eax call translateToNewAddress mov %eax, 36(%esp) add $4, %esp popa ret
add r2,r3,r4 r1 = translateToOriginal(r2+10) call Cache(r1) load r1,10(r2)
(c) instrumentation code (reverse translation) add r2,r3,r4 call Cache(r2+10) r2 = translateToNewAddress(r2) load r1,10(r2)
Figure 5: Translating the jump destination for an indirect jump on the i386
Figure 4: An ordinary and reverse address translation example.
translated, and after the call the original address should be restored, as well as all registers that were overwritten during the translation. It goes without saying that some rather complex code is required to implement this. A nice example of this can be found on the i386 platform, in the case of an indirect jump where all register values are live, and so there is no scratch register available to temporarily store the new destination address. Figure 5 shows the actual code involved. First, a slot is allocated on the stack. Next, all registers are pushed on the stack, followed by the argument to the translate function. After the call, %eax contains the translated address, which is stored in the stack slot we reserved in the beginning. Then, the stack and all registers are restored to their original state, leaving only the translated address on the stack. The ret instruction, which implements a procedure return, pops the new address off of the stack and finally performs the jump. System calls are problematic because they often have pointers as arguments. The kernel can then do anything it likes with the memory pointed to by the system call arguments, including reading other pointers in this memory and dereferencing those as well. This implies that not only the pointer passed to the system call, but also all pointers that are reachable through it, should be translated before the system call, and restored after it. This is impossible, but there is a practical solution to the problem: we patch the operating system kernel to perform the translations itself prior to actually dereferencing any pointer coming from user space. While this sounds rather intimidating, it is in fact pretty easy, as the kernel typically uses only a limited set of macros and functions to interface with user space memory, so only these need to be adapted. For the Linux 2.4.24 kernel, this patch amounts to 377 changed lines of source code, and it results in no measurable slowdown for the execution of noninstrumented programs. So far, we have only patched the Linux kernel for the i386 architecture, and on that platform, FIT gives the user the option to choose between ordinary and reverse translation, or in other words, between faster and more accurate instrumentation. The precision of our reverse translation implementation was validated by comparing the resulting traces to traces collected with Diota.
This simple translation is only a partial solution however. Both FIT’s and ATOM’s interfaces include an EffAddrValue primitive that passes the effective address of a memory operation to an analysis routine. When a user uses this primitive in the code instrumentation file, FIT will insert the address translation in the instrumented program, as it knows by definition that the requested value is an address. The latter is not always the case however. Suppose we want to trace the contents of register r3 in the program fragment in Figure 4(a). Do we need to translate r3’s value? In general, it is undecidable whether a register will hold an address or another value at some program point. Sometimes a register at some point can even hold both addresses and other values, as when the hashtable mentioned in Section 2.3 is used with both addresses and other values as keys. In such cases, it is undecidable whether or not translation is needed.
3.4.3 Reverse Translation Fortunately, an alternative solution exists for the problem of changing code and data addresses. Instead of using the new addresses of all code and data throughout the instrumented program, we can revert the translation process: the program keeps working with the old addresses, and only where necessary, the old addresses are translated to new addresses. This guarantees that at every point in the execution of the instrumented program, all values in memory and registers are identical to those at the corresponding point in the execution of the original program. Whenever the program actually uses an address, for accessing memory or jumping to another location, compensating code is inserted that translates the old address to the correct new value and uses this one instead. This is depicted in Figure 4(c). In the instrumented program, r2 would still contain the original address of the data it will load, and after translation, it will load the correct (old) data from its new address. Note that it is not trivial to rewrite the program in this way. The easy part is making sure all addresses stored in the data sections remain unchanged: it suffices to relocate them with their original values. The hard part is making sure all indirect control flow transfers and system calls remain correct. For indirect control flow transfers, such as procedure calls through function pointers, the potential targets are often unknown at instrumentation time. Yet immediately prior to the call, the target address should be
4. EVALUATION We have measured the slowdowns caused by the added instrumentation code for two common applications: generating a trace of the executed basic blocks and generating a
33
6. ACKNOWLEDGEMENTS Bjorn De Sutter, as a Postdoctoral Research Fellow, and Dominique Chanet, as a PhD. student, are supported by the Fund for Scientific Research - Flanders (FWO). Bruno De Bus and Ludo Van Put are supported by the Institute for the Promotion of Innovation by Science and Technology in Flanders (IWT). This research is also partially supported by Ghent University.
7. REFERENCES [1] R. Cmelik and D. Keppel. Shade: A fast instruction-set simulator for execution profiling. ACM SIGMETRICS Performance Evaluation Review, 22(1):128–137, May 1994. [2] B. De Bus, B. De Sutter, L. Van Put, D. Chanet, and K. De Bosschere. Link-time optimization of ARM binaries. In Proc. of the 2004 ACM SIGPLAN/SIGBED Conference on Languages, Compilers, and Tools for Embedded Systems (LCTES), 2004. [3] J. Maebe, M. Ronsse, and K. De Bosschere. Diota: Dynamic instrumentation, optimization and transformation of applications. In Compendium of Workshops and Tutorials Held in conjunction with PACT‘02: International Conference on Parallel Architectures and Compilation Techniques, 2002. [4] P. Magnusson, M. Christensson, J. Eskilson, D. Forsgren, G. Hallberg, J. H¨ ogberg, F. Larsson, A. Moestedt, and B. Werner. Simics: A full system simulation platform. IEEE Computer, 2002. [5] B. P. Miller, M. D. Callaghan, J. M. Cargille, J. K. Hollingsworth, R. B. Irvin, K. L. Karavanic, K. Kunchithapadam, and T. Newhall. The paradyn parallel performance measurement tool. IEEE Computer, 28(11):37–46, 1995. [6] P. Moseley, S. Debray, and G. Andrews. Checking program profiles. In Third IEEE International Workshop on Source Code Analysis and Manipulation, pages 193–202, 2003. [7] J. Pierce, M. D. Smith, and T. Mudge. Instrumentation tools. In T. M. Conte and C. E. Gimarc, editors, Fast Simulation of Computer Architectures. Kluwer Academic Publishers, 1995. [8] T. Romer, G. Voelker, D. Lee, A. Wolman, W. Wong, H. Levy, and B. Bershad. Instrumentation and Optimization of Win32/Intel Executables Using Etch. In Proc. of the First USENIX Windows NT Workshop, Seattle, WA, 8 1997. [9] A. Srivastava and A. Eustace. ATOM: A System for Building Customized Program Analysis Tools. In Proc. Conference on Programming Languages Design and Implementation (PLDI), pages 196–205, 1994. [10] A. Srivastava and D. Wall. Link-time optimization of address calculation on a 64-bit architecture. In Proc. of the 1994 ACM SIGPLAN Conference on Programming Language Design and Implementation (PLDI), pages 49–60, 1994. [11] E. H. Welbon, C. C. Chan-Nui, D. J. Shippy, and D. A. Hicks. Power2 performance monitor. IBM Journal of Research and Development, 38(5).
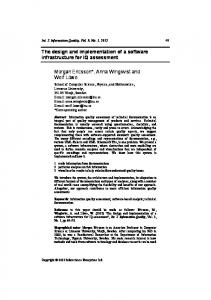
Figure 6: Program slowdowns combined trace of basic blocks and memory accesses on the ARM and i386 architectures, for nine benchmarks from the SPECint2000, MiBench and MediaBench suites. Figure 6 shows the slowdowns for the ARM Linux platform, using ordinary address translation and for the i386 Linux platform, using both ordinary and reverse address translation. On the ARM, basic block tracing, which only involves writing an address to a buffer at the start of every basic block, slows down the execution 2.9 times on average. Memory access tracing slows down the execution by a factor of 21.53 on average. This much bigger slowdown results from the higher number of memory accesses, each requiring the translation of an address as explained in Section 3.4.2. On the i386 the slowdowns for the ordinary address translation are about the same as for the ARM, with basic block tracing increasing the execution time by a factor of 3.36 on average, and combined basic block and memory access tracing increasing execution time by a factor of 20.64 on average. The overhead increases significantly with reverse address translation: the average slowdown for basic block tracing rises to 8.11, that of combined block and memory tracing rises to 29.15. The overhead incurred by reverse address translation consists of two parts: (a) translation of destination addresses for memory accesses, and (b) translation of the destination of all indirect control flow transfers (this includes function returns). In the case of combined block and memory tracing, part (a) is compensated by the fact that it is no longer necessary to translate memory addresses before they are passed on to the instrumentation routines. In the encode benchmark, there are no indirect control flow transfers in hot code, so the overhead of reverse translation disappears. On the other hand, crc performs a number of function calls in hot code, which causes part (b) of the overhead to dominate. This shows clearly in the results.
5.
CONCLUSIONS
With FIT, our ATOM-compatible Flexible Instrumentation Toolkit, and its backends for the x86, ARM and Alpha architectures, we have proven that the implementation of a truly portable, extensible binary code instrumentor is possible. Using reverse address translation we have also shown how less intrusive instrumentation can be implemented.
34