Inter-technician and between-laboratory differences,. Therefore the value .... this information via the communication line to Tygerberg Hospital,. The study forms ...
Human Reproduction vol.15 no.3 pp.667–671, 2000
The development of a continuous quality control programme for strict sperm morphology among sub-Saharan African laboratories
D.R.Franken1,4, M.Smith1, R.Menkveld1, T.F.Kruger1, C.Sekadde-Kigondu2, M.Mbizvo3 and E.O.Akande3 1Reproductive
Biology Research Laboratory, Department of Obstetrics & Gynaecology, University of Stellenbosch, PO Box 19058, Tygerberg 7505, South Africa, 2Kenyatta National Hospital, College of Health, Department of Obstetrics & Gynaecology, Nairobi, Kenya and 3WHO Special Programme of Research, Development and Research Training in Human Reproduction, Geneva, Switzerland 4To
whom correspondence should be addressed
Inter-technician and between-laboratory differences, especially during the evaluation of sperm morphology, have been a major cause of concern. The study aimed to develop an intensive training programme with intervals of continuous quality control assessments for sperm morphology. Twenty andrology laboratories from sub-Saharan Africa were invited to participate in a World Health Organization Special Programme of Research, Development and Research Training in Human Reproduction semenology workshop. Following intensive training in strict sperm morphololgy evaluation, a continuous quality control programme was introduced on a quarterly basis. At baseline, the mean (⍨ SD) percentage difference reported between the participants and the reference laboratory reading was 33.50 ⍨ 11%. After training, the mean percentage difference had decreased to 14.32 ⍨ 5% at 3 months and to 5.00 ⍨ 5% at 6 months. Pairwise comparison of the differences at each evaluation time revealed the following: Baseline differences (pre-training) differed significantly from the differences at 3 months (P ⍧ 0.0002) as well as at 6 months after training (P ⍧ 0.007). The differences at 6 months did not differ significantly from those at 3 months (P ⍧ 0.27). Training of andrology technicians as well as continuous proficiency testing can be conducted on a national and international level with the support of a referring laboratory. Global quality control measurements in andrology laboratories should become mandatory, since these results indicate that continuous quality control for laboratory technicians can be highly successful. Key words: andrology/quality control/strict sperm-morphology/training
Introduction The andrological investigation still relies on a thorough history and physical examination of the male partner and the ‘basic’ © European Society of Human Reproduction and Embryology
semen analysis. The ‘basic’ semen analysis performed by the andrology laboratory should include the assessment of physical semen characteristics (volume, pH, agglutination, viscosity), evaluation of sperm concentration, progressive motility, normal morphology (strict criteria) (Menkveld et al., 1990) and viability, presence of leukospermia and immature sperm cells, detection of antisperm antibodies and a bacteriological investigation (Oehninger, 1995). Numerous studies have reported significant variation in the percentage of normal spermatozoa when specimens are analysed by different observers and laboratories (Baker and Clarke, 1987; Dunphy et al., 1989; Menkveld et al., 1990, 1991; Morgenthaler et al., 1995). Therefore the value of sperm morphology assessments as a predictor of a man’s fertilizing potential has often been challenged due to different classification systems. Several factors are responsible for this technical variation, including differences in the methods used to prepare and stain specimens (Katz et al., 1986; Davis and Gravance, 1993), differences in proficiency among technicians (Zaini et al., 1985; Baker and Clarke, 1987; Dunphy et al., 1989; Menkveld et al., 1990) and inherent differences in classification criteria and methods (Davis and Gravance, 1994; Ombelet et al., 1995, 1998). These differences in methodologies between laboratories are well known, but since the publication of the World Health Organization manual (WHO, 1999) the between-laboratory variation can be negated. Intra- and inter-individual variability should decrease to non-significant levels of difference. An everremaining problem would be the comparison of the predictive power of semen parameters of one setting with another and the attempt to transfer the specific values to fit their patient population. A recent comprehensive study of so-called normal couples attempting to achieve conception showed that the probability of conception increased with increasing sperm concentration up to 40⫻106/ml and that the proportion of spermatozoa with normal morphology was strongly related to the likelihood of pregnancy, independently of sperm concentration (Bonde et al., 1998). These findings should be interpreted with caution, since these completely different populations of patients differ from those referred to assisted reproductive programmes. A meta-analysis has confirmed the importance of sperm morphology as a predictor of male fertility (Coetzee et al., 1998). There was a pregnancy rate of 15.2% among the couples in the morphology group with ⬍4% normal forms compared to 26% among the ⬎4% group. Sperm morphology therefore is possibly the most consistent sperm variable which appears to be related to in-vitro fertilization (IVF) success (Enginsu et al., 1991; Kobayashi et al., 1991; Liu and Baker, 1992; Ombelet et al., 1995). A logistic regression model, including DNA status and morphology of spermatozoa revealed 667
D.R.Franken et al.
sperm morphology (strict criteria) and concentration of progressive motile spermatozoa to be the principle predictors for IVF (Duran et al., 1998). Based on the reported clinical importance of sperm morphology (Oehninger et al., 1991; Ombelet et al., 1994, 1997a; Coetzee et al., 1999), the Tygerberg Reproductive Biology Research Laboratory developed a strict criteria sperm morphology training course for sub-Saharan African scientists, which aimed to record and evaluate the efficiency of continuous sperm morphology training.
Materials and methods Pre-training evaluation The study forms part of the World Health Organization’s Special Programme of Research, Development and Research Training in Human Reproduction (HRP, Geneva, Switzerland) in sub-Saharan Africa and was jointly organized and presented by the Reproductive Biology Research Laboratory (Department of Obstetrics and Gynecology) at Tygerberg Hospital, South Africa. Laboratories from sub-Saharan African countries, i.e. Uganda, Zimbabwe, Zambia, Cameroon, Kenya, Nigeria, South Africa and Tanzania were requested during April 1997 (n ⫽ 10) and September 1998 (n ⫽ 10), to participate in semenology workshops at Tygerberg Hospital with the objective to establish a continuous quality control system for sperm morphology evaluation. In addition to basic semen analysis training, an intensive sperm morphology teaching course was presented during a 5 day hands-on workshop at the Reproductive Biology Research Laboratory at Tygerberg Hospital. Prior to the training, participants performed a morphology evaluation (percentage normal cells) on pre-stained Papanicolaou slides. These results were compared with an evaluation by a highly experienced panel of morphology experts, and the data used as a reference set to evaluate improvement in participants’ skills. Training Following the pre-training evaluation, delegates were provided with a take-home reference set of five pre-stained Papanicolaou slides which consisted of the following: slide 1 contained spermatozoa from a donor with ⬎14% normal forms (this slide was also used during pre-training evaluation), slide 2 contained spermatozoa with ⬍4% normal forms. Slides 1 and 2 were repeatedly used until each participant was familiar with the shape and microscopic appearance of the so-called normal spermatozoa according to strict criteria. Slides 3, 4 and 5, used during the teaching course, contained sperm samples with ⬎14%, 5–14% and 艋4% normal forms, respectively. The latter slides served as a control to evaluate the participant’s knowledge of normal sperm cells. For a spermatozoon to be considered normal, the sperm head, neck midpiece and the tail must be normal. The head should be oval in shape. Allowing for the slight shrinkage that fixation and staining induce, the length of the head should be 4.0–5.0 µm and the width 2.5–3.5 µm. The length-to-width ratio should be 1.50–1.75. These ranges are the 95% confidence intervals (CI) for Papanicolaoustained sperm heads (Katz et al., 1986). Estimation of the length and width of the spermatozoa were made with an ocular micrometer. There should be a well-defined acrosomal region comprising 40–70% of the head area. The midpiece should be slender, ⬍1 µm in width, about one-and-a-half times the length of the head, and attached axially to the head. The tail should be straight, uniform, thinner than the midpiece, uncoiled and ~45 µm long (WHO, 1999). This classification scheme requires that all ‘borderline’ forms be considered abnormal
668
(Kruger et al., 1986; Menkveld et al., 1990). It is also the method most widely used in andrology laboratories and is the method recommended by WHO (1999). Continuous quality control (CQC) system Participants were requested to enroll in the CQC system that entailed the following: (i) A communication line via a fax/e-mail facility, through which each enrolled laboratory obtained direct access to advice and slide information, in order to ensure the continuous educational value of the CQC system. (ii) On a quarterly basis participants received a single Papanicolaou pre-stained sperm slide of e.g. spermatozoa from normo-, terato- or severe teratozoospermic sperm samples, evaluated for percentage normal cells by a panel of highly experienced morphology experts prior to shipment. Participants had to record the percentage normal cells for this slide and forward this information via the communication line to Tygerberg Hospital, where all the information were recorded in a data base. The ‘correct’ results according to the reference laboratory, i.e. the percentage normal forms present on each of the slides, were subsequently supplied to the participating laboratory. Evaluation of the system The results of the participants’ morphology evaluation at each stage of the training programme were compared with the evaluation of the reference laboratory, and the difference in score was calculated. This change in agreement with the reference laboratory, measured over time, was the outcome parameter of interest, which would be indicative of the participants’ change in skill in evaluating sperm morphology on a slide. The ability of participants to correctly classify spermatozoa was further assessed by the group classification described for strict criteria at each stage of the programme, namely, p-pattern (艋4% normal forms), g-pattern (5–14% normal forms) and normal pattern (⬎14% normal forms). A group classification was regarded as incorrect when the mean percentage normal forms reported surpassed the 95% CI (⬎2⫻SD) of the mean score assessed by the reference laboratory. Statistical analysis Statistical evaluation was performed with Statistica for Windows Release 5.1 (Statsoft Southern Africa Ltd, Private Bag X131, South Africa; 1997) and consisted of evaluation of individual scatterplots for each participant’s data and pairwise comparisons of differences at and between evaluation times with the Wilcoxon matched pairs test.
Results Data are shown in Table I, with mean (SD), median and range of the differences between participants and the reference laboratory. The mean percentage difference (⫾ SD) reported between the participants and the reference laboratory reading was 33.50 ⫾ 11% (Table I, difference 1). The mean (⫾ SD) percentage normal forms reported during the pre-training evaluation by the participants was 52.75 ⫾ 13% compared to the 19.25 ⫾ 3% recorded by the reference laboratory. Three months after training, the mean percentage difference between the participants and the score reported by the reference laboratory was 14.32 ⫾ 5% (Table I, difference 2). The mean percentage normal forms reported by the participants were 29.05 ⫾ 20%, compared to the 22.47 ⫾ 3% by the reference laboratory. Progressive improvement in morphology scoring observed 6 months after the onset of training, namely the
Strict sperm morphology training
Table I. The sperm morphology evaluations of 20 andrology laboratories from sub-Saharan Africa participating in a continuous quality control system Morphology scores Pre-training Pre-training score
3 months post-training Reference laboratory
Difference 1
Mean normal forms (%) 52.75 ⫾ 13 19.25 ⫾ 3 33.50 ⫾ 11 95% CI 46.64–58.85 17.89–20.60 27.97–39.02 Median 54.00 18.00 32.00
Trainee’s scores
Reference laboratory
29.05 ⫾ 20 22.47 ⫾ 3 19.27–38.82 21.11–23.83 20.00 25.00
6 months post-training Difference 2
Trainee’s scores
Reference laboratory
Difference 3
14.32 ⫾ 5 7.58–21.04 10.00
14.16 ⫾ 8 8.73–19.59 18.50
12.66 ⫾ 6 8.59–16.73 17.00
5.00 ⫾ 5 1.46–8.53 4.00
CI ⫽ confidence interval.
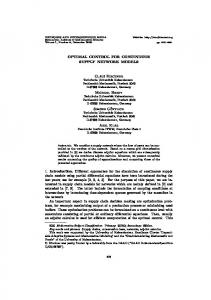
Figure 1. Individual progress for each of the 20 participants analysed by categorized scatterplots. The percentage difference is that recorded between the participant and the reference laboratory.
mean percentage difference between the participants and the score reported by the reference laboratory, decreased to 5.00 ⫾ 5% (Table I, difference 3). The mean percentage normal forms reported by the participants was 14.16 ⫾ 8%, compared to the 12.66 ⫾ 6% by the reference laboratory (Table I). Pairwise comparison of the differences at each evaluation time revealed the following: Baseline differences (pre-training) differed significantly from the differences at 3 months (P ⫽ 0.0002) as well as at 6 months after training (P ⫽ 0.007). The differences at 6 months did not differ significantly from those at 3 months (P ⫽ 0.27). Individual progress for each of the 20 participants were analysed using categorized scatterplots (Figure 1A–T). The learning curve for each participant is shown in the scatterplots by the curve between individual points. The initial difference recorded between participant and the reference laboratory shown in Figure 1A for example, was 51% and further decreased to 2%. The dramatic improvement is illustrated by the steep slope of the regression line. Similar findings were recorded for all but Figure 1C, D, Q and R. The slope of the regression line indicates that these individuals had a better understanding of the morphological configurations of a normal sperm cell. The participant represented in Figure 1R did not enter the CQC programme, since this individual gained
morphology experience at Tygerberg Hospital prior to the semenology workshop. Strict sperm morphology group classification, i.e. p-pattern (艋4% normal forms), g-pattern (5–14% normal forms) and normal pattern (⬎14% normal forms) were recorded for each individual laboratory participating in the programme. The initial group classification of the results obtained at the pretraining evaluation revealed only one correct classification (Figure 1R). Three months post- training showed eight out of 19 laboratories with correct group classifications, whereas 10 out of 12 laboratories, where results were available, classified the spermatozoa correctly. Discussion Evaluation of the percentage of normal sperm morphology features with light microscopy is subjective, and therefore difficult to compare between laboratories, even within laboratories. Different means of assessing sperm morphology have been described (MacLeod and Gold, 1951, Eliasson, 1971; Freund, 1966; WHO, 1980, 1987, 1992, 1999; Kruger et al., 1986; Ombelet et al., 1997b, 1998). Cooper et al. (1999) described the results from an external quality control (EQC) programme for semen analyses during which formalin-fixed 669
D.R.Franken et al.
semen samples and video tapes of motile spermatozoa were distributed every 3 months to participating laboratories over a period of 3–4 years (Cooper et al., 1999). The initial underscoring of the percentage normal forms was later abolished to reach a closer agreement. Despite the efforts to standardize, sperm morphology remains one of the most controversial semen parameters in terms of its role in male fertility potential (Ombelet et al., 1994, 1995, 1997a). A cross-sectional study (Chia et al., 1998) of semen parameters in Singapore recorded a ‘low’ mean percentage of normal sperm morphology (20%) among proven fertile men. Although Chia et al. (1998) concluded that WHO criteria for normal sperm morphology were too stringent, their findings are in close agreement with those originally described for strict criteria (Kruger et al., 1986; Menkveld et al., 1991). The most prominent problem in morphology classification and morphology scoring is the large coefficient of variation (CV) that exists between and among different technicians in different laboratories. During a multi-centre trial, Ombelet et al. (1998) evaluated intra- and inter-individual variability and between-laboratory variation using the same or different criteria of sperm morphology assessment. Semen samples were obtained from 20 males and 32 smears were made of all the samples. Eighty coded smears were sent to eight laboratories for morphology assessment. The centres applied different classification systems and participants were requested to analyse the smears twice, with a 1 week interval. Interclass correlation between repeats showed that sperm morphology could be assessed with acceptable withinobserver reproducibility. They observed an increase in imprecision up to CV of ⬎30% with decreasing morphology scores, regardless of the classification system (Ombelet et al., 1998). Despite the problems associated with the preparation of slides and staining methods, the use of different classification systems and the subjective nature of visual sperm morphology assessment, we still believe in the power of this important parameter in the routine semen analysis. This is especially true for laboratories in developing countries which lack sophisticated diagnostic laboratories. Individual scatterplots of the participants (Figure 1) demonstrate the difference in the initial knowledge between the trainee and trainer, which represents the trainee’s inability to identify the normal sperm cell. The scatterplots may also be very useful in presenting such a technician training project on a national basis, because the referring laboratory will be able to monitor the technical quality and performance of each participating laboratory. Changes in individual standard can immediately be identified from such a scatterplot and steps taken to rectify the problem. The correct group classification may be a stronger indicator of the success of training in andrology; the initial classification revealed only one laboratory (5%) that had a correct morphology classification, while 3 months later 42% (8/19) of the laboratories were correct. After 6 months of continuous quality control, 83% (10/12) of the participating laboratories classified spermatozoa correctly according to the groups outlined by strict criteria. Equally important is the identification of laboratories that do not improve during the 6 months period. These laboratories should be alerted about the technical quality of the evaluation and 670
brought back to the reference laboratory for advanced training sessions. The results of the present study are encouraging since the 20 participants, once trained, maintained for a period of at least 6 months a high level of accuracy in their morphology assessments. Training of technicians as well as regular proficiency testing will ensure continuous communication with the referring laboratory. Proficiency testing of technicians’ skills is of the utmost importance if andrology laboratories want to secure a professional code of conduct. The authors firmly believe that global quality control measurements in andrology laboratories will eventually become mandatory. A high quality semen analysis still represents the cornerstone in the investigation of the infertile couple. In order to maintain low intraand inter-technician variation and high quality proficiency testing among laboratory technicians, continuous teaching programmes should be available to all. The authors feel satisfied with the results of this ongoing study, since the initial training and continuous quality control of the andrology laboratories in Africa provides a standard of sperm morphology evaluation that will eventually be beneficial to the clinician and patient. Sperm morphology training programmes are of the utmost importance in all andrology laboratories, especially since the literature clearly indicates that improper technical skills can leave clinicians without a proper diagnosis. Acknowledgements The authors wish to extend their deepest gratitude towards the following institutions and individuals for their assistance during the project; Ernst Schering Research Foundation, Schering SA, Hadley Bastiaan, Riana Bornman, Kevin Coetzee, Mari-Lena Windt-de Beer, Aldo Esterhuizen, Ursula Habenicht, Sandra Josias, Jannie Lourens, Hantie Nel, Elmarie Prinsloo and Mina Zaal.
References Baker, H.W.G. and Clarke, G.N. (1987) Sperm morphology consistency of assessment of the same sperm by different observers. Clin. Reprod. Fertil., 5, 37–43. Bonde, J.P., Ernst, E., Jensen, T.K. et al. (1998) Relation between semen quality and fertility: a population based study of 430 first-pregancy planners. Lancet, 352, 1171–1177. Chia, S.E., Tay, S.K. and Lim, S.T. (1998) What constitutes a normal seminal analysis? Semen parameters of 243 fertile men. Hum. Reprod., 12, 3394–3398. Coetzee, K., Kruger, T.F. and Lombaard, C.J. (1998) Predictive value of normal sperm morphology: a structured literature review. Hum. Reprod. Update, 4, 73–84. Cooper, T.G., Atkinson, A.D. and Nieschlag, E. (1999) Experience with external quality control in spermatology. Hum. Reprod., 14, 765–769. Davis, R.O. and Gravance, C.G. (1993) Standardization of specimen preparation, staining and sampling methods improves automated sperm head morphometry analysis. Fertil. Steril., 59, 412–417. Davis, R.O. and Gravance, C.G. (1994) Consistency of sperm classification methods. J. Androl., 15, 83–91. Dunphy, B.C., Kay, R., Barratt, C.L.R. and Cooke, I.D. (1989) Quality control during the conventional analyses of semen, an essential exercise. J. Androl., 10, 378–385. Duran, E.H., Gurgan, T., Gunalp, S. et al. (1998) A Logistic regression model including DNA status and morphology of spermatozoa for prediction of fertilization in vitro. Hum. Reprod., 13, 1235–1239. Eliasson, R. (1971). Standards for investigation of human semen. Andrologie, 3, 49–64.
Strict sperm morphology training Enginsu, M,E., Dumoulin, C.J.M., Pieters, M.H.E.C. et al. (1991) Evaluation of human sperm morphology using strict criteria after Diff-Quik staining: correlation of morphology with fertilization in vitro. Hum. Reprod., 6, 854–58. Freund, M. (1966) Standards for rating human sperm morphology. Int. J. Fertil., 11, 97–118. Katz, D.F., Overstreet, J.W., Samuals, S.J. et al. (1986) Morphometric analysis of spermatozoa in the assessment of human male fertility. J. Androl., 7, 203–210. Kobayashi, T., Jinno, M., Sugimura, K. et al. (1991) Sperm morphological assessment based on strict criiteria and in-vitro fertilization outcome. Hum. Reprod., 6, 983–986. Kruger, T.F., Menkveld, R., Stander, F.S.H. et al. (1986) Sperm morphologic features as a prognostic factor in in vitro fertilization. Fertil. Steril., 46, 1118–1123. Liu, D.Y. and Baker, H.W.G. (1992) Tests of sperm function and fertilization in vitro. Fertil. Steril., 58, 465–483. MacLeod, J. and Gold, R.Z. (1951) The male factor in fertility and infertility. IV. Sperm morphology in fertile and infertile marriage. Fertil. Steril., 23, 394–414. Menkveld, R., Franken, D.R., Kruger, T.F. et al. (1991) Sperm selection capacity of human zona pellucida. Mol. Reprod. Dev., 15, 346–352. Menkveld, R., Stander, F.S.H., Kotze, T.J. et al. (1990) The evaluation of morphological characteristics of human spermatozoa according to stricter criteria. Hum. Reprod., 5, 586–592. Morgenthaler, A., Fung, M.Y., Harris, D.H. et al. (1995) Sperm morphology and in vitro fertilization outcome: a direct comparison of World Health Organization and strict criteria methodologies. Fertil. Steril., 64, 1177–1182. Oehninger, S.C. (1995) An update on the laboratory assessment of male fertility. Hum. Reprod., 10 (Suppl. 1), 38–45. Oehninger, S., Acosta, A., Veeck, L. et al. (1991) Recurrent failure of in vitro fertilization: role of the hemizona assay in the sequential diagnosis of specific sperm–oocyte defects. Am. J. Obstet. Gynecol., 164, 1210–1215. Ombelet, W., Fourie, leR.R., Vandeput, H. et al. (1994) Teratozoospermia and in-vitro fertilization: a randomized prospective study. Hum. Reprod., 9, 1479–1484. Ombelet, W., Menkveld, R., Kruger, T.F. and Steeno, O. (1995) Sperm morphology assessment: historical review in relation to fertility. Hum. Reprod., 1, 543–557. Ombelet, W., Bosmans, E., Janssen, M. et al. (1997a) Semen parameters in a fertile versus subfertile population: a need for change in the interpretation of semen testing. Hum. Reprod., 12, 987–993. Ombelet, W., Pollet, H., Bosmans, E. and Vereecken, A. (1997b) Results of a questionnaire on sperm morphology assessment. Hum. Reprod., 12, 1015–1020. Ombelet, W., Bosmans, E., Janssen, M. et al. (1998) Multicenter study on reproducibility of sperm morphology assessments. Arch. Androl., 4, 103–114. World Heath Organization (1980) Laboratory Manual for the Examination of Human Semen and Sperm–Cervical Mucus Interaction, 1st edn. Press Concern, Singapore. World Heath Organization (1987) Laboratory Manual for the Examination of Human Semen and Semen–Cervical Mucus Interaction, 2nd edn. Cambridge University Press, Cambridge. World Heath Organization (1992) Laboratory Manual for the Examination of Human Semen and Sperm–Cervical Mucus Interaction, 3rd edn. Cambridge University Press, Cambridge. World Heath Organization (1999) Laboratory Manual for the Examination of Human Semen and Sperm–Cervical Mucus Interaction, 4th edn. Cambridge University Press, Cambridge. Zaini, A., Jennings, M.G. and Baker, H.W.G. (1985) Are conventional sperm morphology and motility assessments of predictive value in subfertile men? Int. J. Androl., 8, 427–435. Received on August 2, 1999; accepted on November 19, 1999
671