The Dynamic Network Notation: Harnessing Network Effects in PaaS-Ecosystems Ulrich Scholten
Robin Fischer
Christian Zirpins
Karlsruhe Institute of Technology Karlsruhe, Germany
Karlsruhe Institute of Technology Karlsruhe, Germany
Karlsruhe Institute of Technology Karlsruhe, Germany
[email protected]
[email protected]
[email protected]
ABSTRACT Web applications complement the Platform-as-a-Service (PaaS) value by satisfying widespread and rapidly changing consumer requirements within limited time and budget. Successful PaaS providers excel in governing their market performance by leveraging complex network effects, which implicitly control PaaS-ecosystems. There is currently no methodically sound and easy to use tool available to business analysts and software engineers of PaaS-offerings that addresses challenges and opportunities in launching and governing such highly dynamic networks. In this paper, we capture network behavior through elements of complex system and control theory. Our dynamic network notation (DYNO) builds upon these theories. In more detail, DYNO models PaaS offerings with a focus on identifying and shaping network effects towards a sufficient user-base and an optimized portfolio of Web applications, all while maintaining a high quality of service.
Categories and Subject Descriptors H.1.1 [Models and Principles]: Systems and Information Theory – general systems theory.
General Terms Network Science, Network Effect, Dynamics, Design,
Keywords PaaS, Web application, software ecosystem, network effects, causal loops, base value, control, notation.
1. INTRODUCTION Successful platform operators have leveraged external development resources and creativity to extend their service portfolio by opening up to third party providers. New entrants, however, face difficulties in starting off an interconnected network of application providers and consumers (‘PaaSecosystem’) [17, 20]. Those networks are highly responsive and dynamic, while network players are fully self-organized. It is challenging to initiate and govern high quality Web application offerings in such a context. Future platform providers need to find the right network design, where the own value contribution can leverage network dynamics [19]. State-of-the-art in the domain of network science and software Permission to make digital or hard copies of all or part of this work for personal or classroom use is granted without fee provided that copies are not made or distributed for profit or commercial advantage and that copies bear this notice and the full citation on the first page. To copy otherwise, or republish, to post on servers or to redistribute to lists, requires prior specific permission and/or a fee. SIMPLEX '12, April 17 2012, Lyon, France Copyright 2012 ACM 978-1-4503-1238-7/12/04…$10.00.
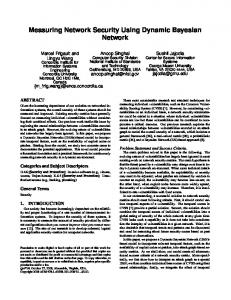
design falls short in providing tools that support business analysts and service engineers in modeling PaaS ecosystems and their immanent network dynamics. Tools used in the field of network dynamics (e.g. VenSimTM, cp. fig. 1) lack a procedural dimension and remain rather explanatory. Harnessing dynamic networks around PaaS implies the need to incorporate system or complex network effects. In the dynamic context of Cloud Computing, those effects are originating in rather indirect (i.e., implicit) patterns and relationships. These cannot be directly modeled through service choreographies or process orchestration and require a tailored approach. We therefore introduce a notation for dynamic network effects, empowering business analysts and service engineers to govern network effects in PaaS-ecosystems. We ground our research on dynamic network optimization theory [4, 5], system theory [14], control theory [3] and dynamic markets [7, 15, 21] in pursuit of creating a bridge between network science and application oriented modeling. We gained understanding on dynamic processes and base value through explorative analysis of several successful platform providers in [16, 17]. Second, we compiled the technical requirements through market analysis in conjunction with laboratory experiments [2, 8]. Third, we captured the relevance of protagonists’ control on quality of service and the respective designs of distributed control settings have been gathered through a longitudinal analysis of service intermediaries [20]. DYNO aims to address the following design challenges of PaaSecosystems: DC1: Where are dynamic processes around the protagonist’s value proposition located? DC2: What are the ignition factors (base value) for these dynamic processes? DC3: Where are service-providing IT-systems exposed to network effects and, thus, required to scale quickly to maintain high quality of service? DC4: How can quality of service be controlled in the PaaS ecosystem? The remainder of the paper is structured as follows: We start with an analysis of network effects in PaaS in section 2. Building on that, we shed light on the design challenges formulated above, leading to a set of governance tasks (section 3). These tasks set the frame for a subsequent derivation of a meta-model and a notation (section 4). In section 5, we experimentally evaluate DYNO, followed by brief summary of related work and close with a conclusion and outlook.
2. NETWORK EFFECTS IN PAAS Platforms-as-a-Service with their consumers on the one side and Web applications on the other side can be described as two-sided markets. Two-sided markets are subject to various network effects (same side, cross side and two-sided network effects) [7, 15, 21]. Those network effects are - from a system theoretic perspective feedback loops, where the magnitude of a stock amplifies the
Figure 1: PaaS ecosystem simulation with VenSimTM, derived from [21]’s models on network and on complementarity effects flow, which in reciprocity increases the stock again. Imagine the inscription base of a platform as the stock. The higher it is, the more it attracts potential customers to subscribe. This subscription rate would be the flow. And it also is plausible that this resulting increased subscription base (stock) further amplifies the flow (i.e. additional subscriptions of new platform users). In complex system theory, this effect is described as the exponential function (
)
,
(1)
where B describes the subscription base, B0 denominates the subscription base at the time t0, the fractional growth and t the time. In reality, the exponential behavior is limited to: • •
s-shaped behavior defined in the logistic curve due to saturation effects and non-linear behavior due to interactions with other players, e.g. competitors.
In pursuit of designing a tool for practitioners and in search of applicable results, we chose causal loop diagrams as a first iteration (see fig. 1) to model complexity and non-linear behavior of platform ecosystems. A challenge is that the holistic data on competitors and consumers, required to qualitatively model such a complex environment is highly volatile and hardly attainable. For us, a simplifying factor is that we only want to identify and trigger network effects. We therefore need to qualitatively identify the causal loops within a PaaS environment, responsible for exponential growth behavior, or those which make market success unrealistic in the first place. Fig. 1 shows a fraction of a causal loop diagram around a PaaS. It builds on models for network and complementarity effects [21], which we integrated and applied on the PaaS ecosystem. It shows a same-side network effect on the left, where new customers are increasingly motivated to subscribe as function of the quantity of existing customers (causal loop R1). We will now provide a mathematical model to understand network effects. Based on [21], we can describe total attractiveness of a PaaS as the product of various variables of attractiveness Aj, e.g. price, reliability, but also attractiveness resulting from network effects, e.g. on the number of subscribed users. AP1 = ∏
(2)
The market share of a platform can be described as (3), where stands for platform P1’s attractiveness and aggregation of all other platforms’ attractiveness.
for the
The attractiveness resulting from the discussed network effect can be described as [21]: ( ) (4), where is the sensitivity to the subscription base and the normed subscription base (which is the subscription base relative to the threshold). The threshold is the critical mass of subscribed customers above the subscription base which has impact on attractiveness. Fig.1 illustrates a major advantage of network effect related attractiveness: Through the subscription base, it scales up with the causal loop of the network effect. In our simulation, the effects of other Factors on Attractiveness on Platform 1 are kept constant (‘c’). The relative subscription base (meaning: relative to the total subscriptions in the market) of platform 1 can be defined as (5), Substituting attractiveness in (3) with (4) and (5) leads to (6), (
(
))
which displays the market share of platform 1 as a phase-plot of relative subscription, with the aggregated non-network related attractiveness ‘c’ as amplifier. Fig. 2 shows this phase plot. In a first step we focus on the network impact and set c=1. On the 45° line, the system is in equilibrium, as the current market share is equal to the relative subscription base. In cases where the slope is >1, small changes in the relative subscription might cause significant changes in market share (instable equilibrium). On the other side, areas where the slope is strongly