Method Note Received 25 January 2012,
Revised 3 July 2012,
Accepted 28 August 2012
Published online 12 October 2012 in Wiley Online Library
(wileyonlinelibrary.com) DOI: 10.1002/jrsm.1060
The effect direction plot: visual display of non-standardised effects across multiple outcome domains Hilary J Thomson*† and Sian Thomas Visual display of reported impacts is a valuable aid to both reviewers and readers of systematic reviews. Forest plots are routinely prepared to report standardised effect sizes, but where standardised effect sizes are not available for all included studies a forest plot may misrepresent the available evidence. Tabulated data summaries to accompany the narrative synthesis can be lengthy and inaccessible. Moreover, the link between the data and the synthesis conclusions may be opaque. This paper details the preparation of visual summaries of effect direction for multiple outcomes across 29 quantitative studies of the health impacts of housing improvement. A one page summary of reported health outcomes was prepared to accompany a 10 000-word narrative synthesis. The one page summary included details of study design, internal validity, sample size, time of follow-up, as well as changes in intermediate outcomes, for example, housing condition. This approach to visually summarising complex data can aid the reviewer in cross-study analysis and improve accessibility and transparency of the narrative synthesis where standardised effect sizes are not available. Copyright © 2012 John Wiley & Sons, Ltd. Keywords:
data tabulation; multiple outcomes; narrative synthesis; non-statistical heterogeneity
1. Introduction Policy relevant systematic reviews of complex interventions often address broad questions and are not without their challenges (Jackson et al., 2004). The data for synthesis are typically highly heterogeneous both statistically and also with respect to included study methods, interventions, contexts, populations and outcomes (Doyle et al., 2008) (Shepperd et al., 2009). One challenge is managing the complex dataset of multiple outcomes and diverse study characteristics, while preparing a synthesis which is both accessible to potential evidence users and maintains the integrity of the systematic review approach. That is, to present a synthesis that is transparent and reflects the quality of the evidence. Careful tabulation of reported results is an essential component of synthesis and careful visual display can aid interpretation and access to complex data for both the reviewer and the reader. Tufte (1983) proposes that visual representations should facilitate understanding of large datasets, different levels of detail, comparison of the data, and be closely integrated with accompanying descriptions of the data (Tufte, 1983). The forest plot meets these criteria and is a valuable visual tool regardless of whether the data are to be meta-analysed or synthesised narratively. However, in reviews where standardised effect sizes are not available across the included studies, the use of a forest plot will under-represent the available evidence. Despite advocacy of careful data tabulation to accompany narrative synthesis, there is little guidance and few examples to help reviewers present accessible digests of complex data (Popay et al., 2006). Consequently, narrative synthesis can result in a lengthy textual synthesis, and tables that are inaccessible to anyone but the most committed reader. We recently conducted a systematic review of the health impacts of housing improvements (Thomson et al., 2010) (Thomson et al., 2011 (submitted)). The review included 29 quantitative intervention studies that had assessed changes in any health or well-being outcome following housing improvement. Study designs included in the review were randomised controlled trials (RCTs), controlled before and after (CBA) studies and uncontrolled studies. The included studies varied in further ways, including intervention components, implementation, context,
Copyright © 2012 John Wiley & Sons, Ltd.
Res. Syn. Meth. 2013, 4 95–101
95
MRC Social and Public Health Sciences Unit, Glasgow, Scotland, G12 8RZ, UK *Correspondence to: Hilary J Thomson, MRC Social and Public Health Sciences Unit, Glasgow, Scotland, G12 8RZ, UK. † E-mail:
[email protected]
H. J. THOMSON AND S. THOMAS
population, study quality, sample size, outcomes reported and timescale of follow-up. Few studies reported data amenable to calculation of standardised effect sizes limiting the use of a forest plot. This paper details our methods for preparing a visual summary of complex quantitative data to accompany more detailed tables and narrative synthesis.
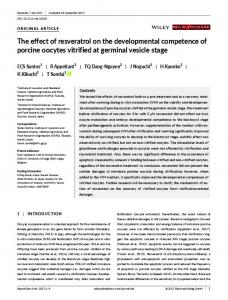
2. Methods Studies were grouped into four broad intervention categories reflecting the various types of housing improvements included in the review, as well as the timescale and context of the intervention. Outcomes were also grouped into four broad categories: respiratory, mental, general health and other symptoms/illness. Full details of the review inclusion criteria and critical appraisal methods are reported elsewhere (Thomson et al., 2010). Following detailed data extraction, the data were tabulated in different ways representing increasing levels of summary. The studies were ordered by intervention category, overall study quality (incorporating an assessment of potential sources of bias from study design, sample selection, control for confounding and attrition at follow-up), date of publication and study design (RCT, CBA, uncontrolled before and after, cross-sectional CBA, cross-sectional uncontrolled before and after and retrospective uncontrolled study) prioritising experimental and controlled studies and those studies that followed a cohort over time rather than rely on cross-sectional data. In addition to tables reporting conventional textual descriptions of the data, two further tables were prepared that used visual representations, arrows, to indicate reported effect direction (improvement , deterioration , or no change/conflicting findings ). An indication of study size and statistical significance was incorporated in the arrow using size and colour, and superscript was added to indicate the type of statistical test being represented (controlled studies: difference between control and intervention group at follow-up (unless stated); a difference in change between control and intervention group; b change within intervention group only. Uncontrolled studies: change since baseline). One of these tables detailed the individual outcomes reported. A second table using arrows presented a single arrow for each outcome domain per study. Where more than one outcome was reported within an outcome domain, the arrow represented a synthesis of reported impacts directions and statistical significance and subscript was used to indicate the number of outcomes being synthesised in the single arrow. The criteria for developing the “synthesised” arrows of effect direction were developed as follows: • Where multiple outcomes all report effects in the same direction and with the same level of statistical significance: • report effect direction and indicate overall level of statistical significance. • Where direction of effect varies across multiple outcomes: • report effect directions and statistical significance where 70% of outcomes report similar direction and similar statistical significance. • if 60% outcomes statistically significant, report as statistically significant (black arrow). • if effect directions similar AND 300; medium arrow 50–300; small arrow 0.05; empty arrow = no statistics/data reported. Statistical tests: controlled studies (including RCTs)—difference between control and intervention group at follow-up (unless stated); a difference in change between control and intervention group; b change within intervention group only; uncontrolled studies: Change since baseline (unless stated).
and study design, placing those studies judged to represent the best available and most recent evidence at the top of each intervention category.
4. Discussion
Copyright © 2012 John Wiley & Sons, Ltd.
Res. Syn. Meth. 2013, 4 95–101
97
We have developed visual displays of complex data to accompany a textual narrative synthesis that was over 10 000 words in length. The conventional tables reporting data (web tables 1 and 2) were over 50 and 12 pages long, respectively (Thomson et al., 2010). The data summarised in the visual display or graphical tables described in this paper are highly heterogeneous, yet the tables incorporate a considerable number of key study characteristics, and all tables include an indication of overall study quality. In addition to the display of the wide range of primary health outcomes, the tables incorporate an indication of intermediate outcomes, changes in housing outcomes, which may shed light on why effects were or were not observed. The intermediate outcomes can be selected to reflect pre-specified steps in the logic model or theory used to shape the review (Anderson et al., 2011). The longer table (Table 1) includes sub-group analysis reflecting data reported in the text of the synthesis. Sub-group analysis may also be included in the “within-study” synthesis table (Table 2). The table allows for flexibility in what is included and the order of the studies. Re-ordering of the studies may be useful when performing preliminary synthesis, and the content and order of the table may vary depending on the purpose of the table. In addition to presenting a clear visual summary of the effect directions, the table also facilitates identification of where there is a lack or absence of evidence; the gaps in the table allow immediate identification of outcome domains with few or no data.
98
Copyright © 2012 John Wiley & Sons, Ltd.
A A A A B B B B C C C C
CBA RCT RCT
CBA CBA CBA UBA CBA UBA UBA R
CBA
Kearns et al., 2008 ** Thomson et al., 2007 Critchley et al., 2004 Thomas et al., 2005 Barnes et al., 2003 Evans et al., 2002 Blackman et al., 2001 * Wells 2000 Ambrose 1999 Halpern 1995
CBA CBA CBA CBA CBA CBA UBA UBA UBA XUBA
106/535
1281/1084 9/27 46/54 72 55/77 16 24 102
~210/165 193/254 1689/1623
45/51 175/174
3–6 months
1–2 years 1–2.5 years 1–3.5 years 3 months 5–11 months