Electroacoustics, 225-246, 1969. [10] Kleiner, M., D. Brainard, and D. Pelli. "What's new in Psychtoolbox-3?" 30th European Conference on. Visual Perception ...
THE EFFECT OF AUDITORY AND VISUAL SIGNAL AVAILABILITY ON SPEECH PERCEPTION Jeesun Kim, Vincent Aubanel and Chris Davis
University of Western Sydney, The MARCS Institute ABSTRACT We used Auditory/visual masks to investigate how the availability of speech signals governs speech perception. Stimuli were videos of a talker uttering sentences. The auditory mask consisted of speech shaped noise; the visual mask, a circular patch obscuring talker’s mouth region. Auditory signals were quantified by the glimpse proportion (GP); visual signals by visual entropy (VE), a measure based on visual change. Auditory stimuli mixed with the noise at -3 dB SNR were presented paired with the talker’s static or moving face (full vs. masked face) for speech identification. Speech identification was more accurate with the moving face (visual benefit); with greater benefit for the full than masked face. The GP correlation with speech identification scores was highest in the static face condition. The visual benefit was correlated with the VE but only when the latter correlated highly with mid-frequency speech energy of the auditory signal. Keywords: visual speech, auditory and visual speech processing, visual form and timing cues. 1. INTRODUCTION Speech communication often occurs while other competing auditory and/or visual events (i.e., noise) take place. The perception of speech corrupted by noise is likely based on those fragments of the speech signals whose energy exceeds the masker by some amount [1] plus the available visual speech (i.e., talker’s face/head motion) information. A great many studies have examined how auditory masking affects speech perception, while other studies have examined the influence of visual speech. The goal of the current study is to examine how masking the auditory and visual speech signals affects speech perception, with a particular interest in how perception may be affected by the relationship between these signals. When visual speech is available, particularly when the mouth region is clearly visible, speech perception is robust to auditory noise [2]. Part of this facilitative effect has been explained in terms of the complementary nature of auditory-visual (AV) cues for speech [3]. Thus, even though the auditory signal has been degraded by noise, the impact of this on speech perception is minimized because visual
speech provides cues for missing information. Two factors have been proposed that may condition any visual speech facilitation effect. The first concerns the nature of visual speech cues and whether these are generated from a particular face region. Here, a relevant distinction is between oral movements and including perioral and head movements [4, 5]. It has been argued that mouth motion provides both speech form and timing cues whereas the other movements provide only speech timing cues [5]. Given this, the basis for visual speech facilitation would change depending on whether the mouth region was masked or not. The other factor is the redundancy between the AV signals. For example, it has been shown that in the speech detection task, AV facilitation only occurred where there was a high correlation between the AV signals [e.g., 6]. Here, the degree to which the auditory and visual signals are correlated provides a proxy measure of redundancy at the signal level. In [6], the visual signal was quantified by change in lip-height and the auditory signal by acoustic energy fluctuations in the F2 spectral region. Whether the degree of AV correlation has an impact on speech identification has not been tested. Further, it should be noted that the visual quantifications made in [6] involved both visual speech form and timing information. To date, little research has been conducted on how to quantify timing information or the degree to which visual signals that provide only timing information are correlated with auditory signals. In the current study, then, we investigated how speech perception is affected by the availability of auditory and visual signals by examining (1) speech perception in noise using three conditions that varied the degree of the availability of visual speech (i.e., the nature of visual speech cues); (2) the correlation between an index of auditory and visual information and speech identification; and (3) the relationship between the degree of AV correlation and speech identification. The three conditions consisted of an Auditory Only (AO) baseline condition in which auditory speech mixed with noise was accompanied by a static face; an AV condition by a moving fullface; and an AV with a mask (AVm) condition by moving face in which the mouth region had been masked. Three specific predictions were made. First, speech perception performance in the AO baseline
condition should be principally determined by the availability of the auditory signal. Here, we used the glimpse proportion (GP) index to examine the extent to which this measure of signal availability was correlated with correct speech identification scores. Second, speech perception for the two moving face conditions will be influenced by the type [5] and the amount of visual information [6]. With regards to the type, we examined the extent to which visual form and timing information contribute to speech perception in noise by comparing performance across the three conditions. That is, by investigating the contributions that oral and perioral regions make to speech perception in noise, we aimed to pin-down the relative importance of different “types” of speech-related motion for speech perception. With regards to quantifying the amount of visual information, we used the VE (see below for details) based on a view of information outlined by Shannon [7] in which information content is inversely proportional to the probability of occurrence (i.e., less predictable elements carry more information). Third, it has been suggested that articulatory movements and other closely related movements such as chin and cheek motion are well correlated with acoustic properties such as intensity varying over time [8]. Given this, it is expected that changes in GP and in VE over time be correlated. In order to examine how the correlation between AV signals relates to visual benefit in speech perception, we first calculated AV correlations between the VE values and acoustic energy fluctuations in the F2 spectral region from [non-degraded] auditory signal. Then we determined the degree to which these were correlated with the identification performance. 2. METHOD 2.1. Participants
Twenty-seven undergraduates of the University of Western Sydney participated in the experiment for course credit. All were native speakers of English and none reported any hearing loss and reported normal or corrected-to-normal vision.
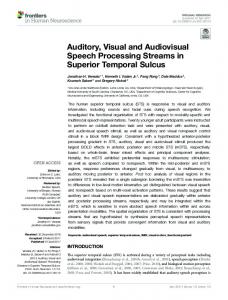
booth 130cm from the camera and recorded against a light blue background. Illumination and the talker’s distance from camera were held constant across items. Sentences were spoken with a neutral expression. Auditory stimuli: The auditory portion of each video was processed separately to normalize acrosstoken. The talker specific speech shaped noise was created from the long term spectrum of all of the recorded tokens, and added to the speech at -3dB. The average duration of the spoken utterance was 2107 ms (SD = 242 ms) and the RMS level of each mixture was set to a fixed value of 0.04. The surrounding silent portion preceding and following the sentence were retained (500 ms on each side). Visual stimuli: The video portion of the recordings was trimmed so that only the lower region of the face (from the bottom of the eyes down) was presented (as in [5]). On the monitor, the video stimuli subtended a height of 12.10 of visual arc and a width of 15.70. The files were played at a screen resolution of 640 x 480 with 32-bit in colour (for the moving face) or grayscale (for static face) at 50 fps. To match the audio signal, approximately 500 ms of the video signal was retained before and after the sentence. Three types of visual stimuli were constructed (See Figure 1): Static-face, baseline; Full-face video; and Masked-face video, where the moving face with the oral region was obscured by superimposing a gray circular patch (radius 20 of visual arc) to cover the mouth movements . The noise mixed auditory stimuli were paired with each of the three types of visual stimuli (N = 60 x 3). Three versions of stimulus list were constructed each consisting of three item blocks (Static-face, Full-face, Masked-face; each consisting of 60 items) so that across versions, each sentence target appeared with each visual (experimental) condition without being repeated within a version. Figure 1: A depiction of how the movements of the talker’s face (in colour) were presented in the experiment. In the Baseline, a grey-scale picture of the talker with the mouth closed was shown (greyscale was used so the viewer would learn not to expect the face to move).
2.2. Materials
The stimuli consisted of AV recordings of a female native Australian English talker (in her early twenties) uttering 200 IEEE sentences [9]. The recordings were made using a Sony PMW-EX1 video camera capturing MPEG4-AVC/H.264, (1280 × 720/50i) and audio captured at 48,000 Hz from an external microphone (Røde NTG-3). For the recording session, the talker was seated in an IAC
Static face: Baseline Stimulus Presentation Conditions
Moving full-face (AV) Moving masked face (AVm)
Participants were randomly allocated to one of the 3 versions; care was exercised to keep the total
number of participants equal across versions. For each version, a Latin square design was used so that the presentation order of the three conditions was counterbalanced across the three participant groups. The presentation order of the items within the block was randomized. 2.3. Procedure
Participants were tested individually in a sound attenuated IAC booth. The stimuli presentation and typed response data collection were controlled using Psychtoolbox [10]. The audio was presented through a Sennheiser HD-555 headset at a comfortable level, which was held constant for every participant. Participants were informed that they would see a talker’s face (either static or moving) while at the same time hearing speech in noise. They were told that their task was to type out as many of the words that they had heard. Participants were informed about the catch trials and that they should not make a response to these. For practice, 3 stimuli including 1 catch trial were presented before each experimental condition (9 in total). The experiment lasted for approximately 60 minutes. 3. RESULTS & DISCUSSION 3.1. Speech Identification
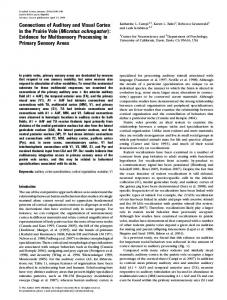
In scoring the identification data, all keywords (5 in each sentence) were scored by parsing the typed response and using a dictionary of common spelling mistakes. Percentage correct word identification was calculated as the measure of speech recognition for each condition. Figure 2 presents the mean proportion response accuracy for each of the experimental conditions Figure 2: Mean proportion accuracy for speech identification as a function of visual speech type: A = Static face; AVm = moving Masked face; AV = moving Full-face. Error bars show 95% confidence intervals.
The response accuracy data were analysed by an ANOVA on the participant data (collapsed over the different items). There was a main effect of presentation condition, F(2,52) = 70.50, p < 0.05.
The Full-face stimuli were responded more accurately than the Masked face stimuli, F(1,26) = 58.47, p < 0.05. The latter was more accurate than then baseline Static face stimuli, F(1,26) = 16.32, p < 0.05. 3.2. Speech Identification & Signal Availability 3.2.1. Auditory Signal: Glimpse Proportion
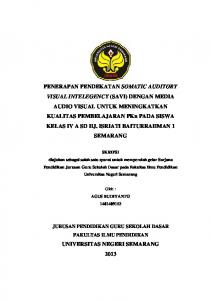
A correlation test was conducted between the GP (proportion of a frame in which the speech energy was greater than 0 dB about the masker) and identification scores for each sentence in each presentation condition. Figure 3 shows the data distributions. As expected the correlations for the auditory only (static face) was significant, r = 0.44; likewise was the correlation with the AVm condition, r = 0.36. The correlation for the Full-face condition was smaller, but was still significant, r = 0.20. This pattern of correlations fits with the straightforward assumption that GP will predict speech intelligibility when the perceiver can only use the bottom-up auditory signal [11]. Here, the performance is better and the correlation is reduced when the listener has access to other non-auditory speech related information. Figure 3: Mean proportion correct as a function of glimpse proportion (GP) across the three presentation conditions (A, AVm and AV). Pearson correlation coefficients and p-values are shown.
3.2.2. Visual Signal: Visual Entropy
To determine whether speech identification performance varied as a function of visual availability, we calculated VE, based on the running sum of colour differences (in CIELab colour space) between successive video frames (50 fps). The VE score was low when there were few changes across frames and high when there were many. Figure 4 provides a graphical example of the measures used for one of the IEEE sentences. The bottom panel shows three VE curves, which were derived from the full face (VE_AV); the masked face (VE_AVm) and the mouth region (VE_m,
calculated by subtracting the VE_AVm from the VE_AV) respectively. As can be seen, the curves share some morphological features but the VE from the masked face is generally flatter. Figure 4: Shown are Energy in the 1.5-2.5 KHz region, mid-frequency energy (MFE), Glimpse proportion (GP) and VE scores for the sentence “He ran half way to the hardware store”.
The VE measure has a similar motivation to that recently used in speech identification studies where a metric of information is derived based on signal change (see the cochlear scaled entropy measure of [12]). It is nonetheless novel as applied to visual speech. Given this, we first aimed to determine whether it would capture the basic relationship between changes in the level of mid–frequency (1.52.5 KHz) speech energy (MFE) and changes in the front part of the vocal tract [13]. The correlation of MFE with VE_AV, VE_AVm and a measure more likely to capture mouth motion, VE_m was significant (P < 0.05) with r values of 0.33, 0.24 and 0.31, respectively. The lower correlation for the MFE and VE_AVm relationship makes sense in that here mouth motion per se does not make a direct contribution to the VE. How was the VE measure related to identification performance? Figure 5 shows the proportion of correct recognition of each word of the sentences across participants, as a function of the mean VE of that word.
There was a small but significant correlation between performance and VE in both conditions [Pearson's product-moment correlation: df=781, r=0.12, p