The Effect of Connected Vehicle Environment on Global Travel ...
Recommend Documents
Aug 1, 2011 - Research and Innovative Technology Administration .... Transportation (U.S. DOT) to leverage the capabilit
Aug 1, 2011 - to evaluating and developing a governance structure or model; and 3) .... Connected Vehicle Mobility Appli
Jan 27, 2016 - Destination: Connected Travel. 5 Big Ideas to Master Digital in Hospitality ... business models are vying
development of connected vehicle technology provided the essential data to study high-risk maneuvers in the entire traffic stream. In this study, two near-crash ...
crash events on safety with the use of naturalistic driving data, driving simulators, and test ... near-crash data are (a) the 100-car naturalistic driving study funded.
2017 Cloud Security Alliance â All Rights Reserved All rights reserved. All rights ..... demand vehicular clouds that
2017 Cloud Security Alliance â All Rights Reserved All rights reserved. All rights ... Mobile Application Security ...
Driver Assistance Systems(ADAS), over in- vehicle data networks. ⢠Connection to smartphones and other mobile devices
to secure, remote, over-the-air provisioning and management of SIMs in ..... Atos, AT&T, Verizon and SiriusXM have e
... travel forecasting and scenar- ios, which found a reduction of approximately five to six per- .... Most counties were planning to upgrade highway systems and ...
Oct 15, 2016 - Tool Development Leader, Virginia Tech ..... the internet. The application uses the âServerSocketâ class in the Android SDK, which implements.
Oct 12, 2015 - route guidance, connected vehicle technology, flash crowd effect. 1. Introduction. Traffic Informations Systems (TISs) enable better utilisation of ...
Sep 29, 2009 - spray-painting graffiti on a local building,â and (3) âchildren were showing ... combination of distance to school, household auto access, ...
0.2, it is found that the CS approach can recover the original speed data with the ... However, the collection of detailed CV data would likely overburden current ...
Oct 31, 2016 - Work Unit No. (TRAIS). 11. Contract or Grant No. DTFH6115C00038. 12. Sponsoring ... Connected Vehicle Technology, I-80 Corridor, Road ...... Figure 3-3: Elk Mountain Seasonal Variation of Crash Frequency 2001-2012. Source: ...... Sourc
[email protected], [email protected], [email protected]. Abstract ... Our previous study took place in a recreational area at an office. In this study, we extend ... gaze pattern, at least in Europe and in Northern America, is that the
Mar 24, 2016 - Table 4-1 â ASIL Determination (Adapted from ISO 26262 Part 3: Concept Phase) . ..... http://www.usfa.fema.gov/downloads/pdf/publications/ ...
support from the Global Challenges Foundation and Mistra through a core grant to the ... working to identify possible solutions and models as to how the United ...
and bad-faith participants. Compromising sensor input or control protocols can lead to incorrect decisions being made by autonomous vehicles, leading to ...
Jun 20, 2016 - cited herein and any trade name that may appear in the work has been included ... Connected Vehicle Pilot Deployment Program Phase 1, Application ... The ICF/Wyoming team thanks U.S DOT and FHWA and their support ...... Of the 400 vehi
Mar 22, 2016 - addressing equipping light vehicles with V2V technology capable of transmitting BSM which ... each trip in order to protect the end user privacy. ..... All cryptographic software and firmware shall be developed and installed in a form
Apr 24, 2018 - In this paper, we present results regarding the experimental validation of connected automated vehicle design. In order for a connected ...
School of Environment Vehicle Guide. Hilux 4×4 (FAH690). Warnings! • This
vehicle ... Lights & eet Card s are allocat keys) from r folder (on the vehicle also
contain ... o Toyota dea mmediately o Toyota de uel filter wa ar utility he dash,. A
ale
The Effect of Connected Vehicle Environment on Global Travel ...
May 30, 2017 - excessive informed drivers. An optimal penetration rate of the connected vehicles is found to characterize the best performance of the system.
Hindawi Journal of Advanced Transportation Volume 2017, Article ID 2697678, 10 pages https://doi.org/10.1155/2017/2697678
1. Introduction Traffic congestion imposes a high cost on individuals and communities with the rapid growth of vehicle ownership. In addition, the resulting problems, such as vehicle emissions and environmental contamination, have become common. Two approaches have been generally applied to deal with the increasing travel demand: (1) increasing capacity by road transportation infrastructure construction and (2) reasonable traffic allocation by demand management [1]. Facts proved that the second method is more sustainable and efficient without large investments compared with the first method; therefore it has attracted widely attention. For instance, Ding et al. [2, 3] attempted to understand travel behavior and its relationship to urban forms aiming to realize property management of the supply and demand condition and provide better policy recommendations. Besides, Ma et al. [4, 5] modeled the travel patterns of transit riders in Beijing through the data-mining technology for
better marketing strategies contributed to alleviating traffic congestion. However, in recent years, researchers find that traffic information can influence the traffic assignment more directly and efficiently. Majority of studies have concluded that information is expected to be beneficial in improving the traffic efficiency [6–8]. Traffic information has been typically conveyed to drivers through broadcast media and variable message signs. Recent traditional patterns have experienced reformation. Connected vehicles compile information from various sources and convey this information to drivers, which have been aided by the rapidly developing technologies, such as computers, communication, big data, and the Internet. The connected vehicle technology is rapidly developing as a substantial technology for monitoring and collecting data; traffic information collected from connected vehicles includes detailed spatial, temporal, and operational characteristics contrasting with the information provided by the traditional resources and traffic sensors [9]. In the connected vehicle environment, each network vehicle acts as
2 a formidable traffic information collector. Meanwhile, the information collected by the vehicles will be transmitted to the connected vehicles, which can obtain accurate, realtime, and comprehensive traffic information by processing the multisource information. The information feedback to each vehicle provides changes in driving modes [10–13] and improves safety significantly meanwhile [14]. Evidently, connected vehicles serve as a feedback loop between traffic supply and demand based on the traffic information. Therefore, connected vehicles can properly realize the timevariant traffic distributed to the traffic network [15]. This condition contributes to smooth traffic oscillation and reducing environmental impacts [16], which can lessen the costs of individuals and the entire system; as a major development direction, connected vehicles have attracted increasing attention [17, 18]. Hence, the effect of the connected vehicle environment on the transportation system is the focus of this study. The fact that substantial resources are devoted to connected vehicles indicates that the connected vehicles are valuable for individual travelers. However, individual travelers fail to internalize the costs of congestion delay and other external costs they impose on other travelers, in which the private cost of a trip that they face is less than the social cost [19]. In fact, the responses of drivers to information and its dynamic influence on the transportation network are not a priori knowledge. A precise understanding of the effects of information is essential to the policy determination and management of connected vehicles. Numerous studies on the effects of information have been conducted. Ben-Elia et al. [20], Popoviˇc and Habjan [21], and Litescu et al. [22] explored the influence of information considering information quality. Besides, Ben-Elia and Shiftan [23] and Levinson [24] investigated the route choice problems. Recently, Lindsey et al. [19] conducted a detailed investigation of the effects of pretrip information on route choice decisions and system efficiency; and the authors then presented and discussed an experiment to test the model [25]. However, most of these studies do not consider deficient information. One recurring finding is that the performance of traffic reaches the optimal result when some drivers are informed. Emmerink et al. [26] found that information has negative effects due to the concentration and overreaction when the penetration exceeds 20%. Litescu et al. [27] discovered that the system performance is influenced by the number of participants that access real-time information; furthermore, the system performance with seamless information is not different from and perhaps even worse than that with zero-information. The focus of the present study is on the effects of information penetration at different levels. Most of the previous studies have failed to embody the characteristics of the connected vehicle environment which cannot take the traffic system performance as a dynamic evolution process. The environment of connected vehicles is a dynamic feedback process between the driver route choice behavior and the traffic system performance. The drivers with travel information provided by connected vehicles can adjust their travel patterns according to this information.
Journal of Advanced Transportation Then, the operation performance of the traffic network will change according to the behavior of the motorists. In this study, a transportation system is simulated by an agent-based simulation method. The system consists of agents (i.e., vehicle driver units) who operate and interact in a shared environment (i.e., road network), where the behavior of the entire system is the emergent of all its elements [27]. The multiagent technology can research the operating conditions of the traffic network developing over time, resulting from route choices of the drivers under the connected vehicle environment. This study focuses on the effects of information on the transportation system and the effects of the various penetration rates of connected vehicles on concentration. Hence, the performance of the traffic system is analyzed when the coverage of connected vehicles is at different levels (i.e., zeroinformation, full-information, and partial-information). The simulation environment with the features of connected vehicles is also developed. Finally, the relationship between the penetration rates of the connected vehicles and the traffic system performance is analyzed through simulation results. The remainder of this paper is organized as follows. Section 2 lays out the model to analyze the advantages and disadvantages of connected vehicles and the effect of the penetration rate of connected vehicles on the transportation system. Section 3 develops the simulation environment by the agent-based simulation framework, namely, NetLogo; based on this, the simulation experiments are carried out in different scenarios and then the experiment results are analyzed. Section 4 concludes with a summary and points out the future research directions.
2. Effect of Connected Vehicle Environment on Global Travel Efficiency Generally, drivers make their route choice according to their perception of the transportation system attributes, such as conditions in travel time, travel speed, travel cost, and road usage; it is a reasonable assumption that travel time is the most important one among these factors. For simplicity, this study focuses only on travel time. The perception about the transportation system attributes originates from the acquired traffic information, which influences the route choice behavior. Therefore, this information affects the performance of the entire system. Drivers obtain traffic information based on their dayto-day travel experience and surrounding traffic environment within their range of vision under a traditional traffic condition. Thus, their acquired traffic information is limited and seriously time lagging. However the basic value which maximizes the travel interests is adhered to the process of travel decision-making. The interests of drivers can barely realize the maximum because the information they obtain misrepresents the real-time performance of the transportation system. Meanwhile, drivers who receive high-quality information services can obtain the comprehensive and realtime traffic information in the connected vehicle environment. Apparently, these drivers can make a better route choice in pursuit of self-interest maximization. However,
Journal of Advanced Transportation
3
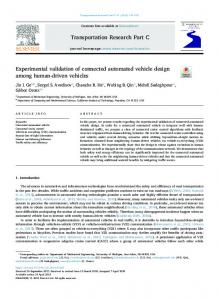
Travel experience
than the system finally relative steady state (i.e., UE), we focus on the dynamic process itself. The variations of the transportation system performance are continuous, and the changes in the transportation system are caused by the cumulative process of driver route choices. Therefore, the operating condition is assumed to be constant in a relatively short time 𝜏, and the dynamic and continuous process is discretized by this time interval. During each cycle time 𝜏, 𝑁 agents enter the network, which are assigned to the two routes, 𝑟1 and 𝑟2 .
Traditional environment
Driver route choice
Transportation system performance
Connected vehicle environment Real-time traffic information
Figure 1: Dynamic feedback process.
although in this case, whether the performance of the entire transportation system can reach the optimum under the circumstance is uncertain. User equilibrium (UE) rarely coincides with the system optimum (SO) according to Wardrop’s principles. The transportation system performance achieves the optimal state when the total travel time is minimized. In the connected vehicle environment, drivers dynamically select the optimal routes for themselves according to real-time operating conditions of the traffic system, where the operation state of the traffic system changes accordingly. Therefore, the transportation system condition continuously adjusts if the differences between the travel times of different routes exist (i.e., some routes have relatively less travel times than others). Finally, the traffic assignment will be consistent with UE within an acceptable range in a relatively stable situation after a period of time adjustment. Through the above analysis, the transportation system performance with all the drivers receiving the service of connected vehicles is not system optimal. 2.1. Advantages and Disadvantages of Connected Vehicles. The benefit of receiving information to improve traffic efficiency has been widely proven. Meanwhile, as mentioned, some studies found that information can adversely affect the system efficiency in some ways, such as concentration, overreaction, and oversaturation, where there are too many informed drivers. The classical two-route network is used in this study to facilitate the analysis. Drivers start from a single origin according to a certain come-rate 𝜆 to a single destination. In contrast to the existing literature [19, 26], this study considers the characteristics of connected vehicles, in which it is a dynamic feedback process between the driver route choices and the transportation system performance, as shown in Figure 1. The transportation system performance depends on driver route choices and sequentially influences driver route choices in turn by the aid of real-time traffic information. Since the real-time travel time of each route is known by drivers before they choose a route, they usually would choose the better route for themselves; the operation condition of the transportation system is then influenced by their choices and further influences the drivers who come later, and so on. Therefore, although in the connected vehicle environment, it is a dynamic process with continuous adjustment. Rather
𝑁=𝜆⋅𝜏
(1)
𝑁 = 𝑁1 + 𝑁2
(2)
𝑁1 and 𝑁2 represent the numbers of agents who enter 𝑟1 and 𝑟2 , respectively. In the connected vehicle environment (i.e., full-information, F), the numbers of agents 𝑁1 and 𝑁2 are determined by the real-time travel times of these two routes, 𝑇1 and 𝑇2 . Although in the connected vehicle environment, it is the drivers that make the route choices for themselves according to their perception about the attributes of the transportation system which are inevitably influenced by their travel experience. Besides, the drivers may not believe the real-time traffic information completely because this information provided by connected vehicles is not always entirely accurate. Therefore, the actual operation condition of the transportation system cannot be entirely known by the drivers. Thereby we assume that the drivers make the route choice that confirms the Discrete Choice Model in the connected vehicle environment as well as the traditional environment. But unlike the traditional environment, in the connected vehicle environment, the perception of drivers about the attributes of the transportation system is based on the real-time traffic information. The travel time determines the proportion of each route; thus, 𝑃1 𝐹 and 𝑃2 𝐹 establish the agent distribution on the network. 𝑃1 𝐹 ∝
In (5) and (6), 𝐸[𝑁𝑖 ] is the expected number of operators, 𝑖 = 1, 2, which expresses the number of drivers entering each route within circle time 𝜏. 2.1.1. Benefits of Information. In the traditional traffic environment (i.e., zero-information, Z), drivers only know the unconditional probability distribution of states. They select the optimal routes to their preference according to the expected travel times of routes, which originate from their previous travel experience. Therefore, the probability of each route is constant over a relatively long period, as well as
4
Journal of Advanced Transportation
Qm
Qm Q First case
Q Second case
No congestion
Congestion Km
0
Last cycle P1F ·
Q Second case
Next cycle
𝐸 [𝑇2 ] ; 𝐸 [𝑇1 ]
𝐸 [𝑇1 ] ∝ 𝐸 [𝑇2 ]
Congestion Km
0
Kj
Traffic density (veh/km)
Figure 3: Decrease of expected number of agents entering route per unit time.
the number of drivers entering each route within circle time 𝜏.
The feedback loop between the driver route choice and the transportation system performance is relatively long to adjust the assignment of traffic demand based on the realtime running state of the system. Given that the network capacity can satisfy the traffic demand, the expected running state of 𝑟1 stays at point 𝐴. However, under a certain probability, several drivers entering 𝑟1 (𝑟2 ) will lead to congestion. In this situation, the traffic flow of this route may have two cases with the traffic flow shown in Figure 2. In the last cycle, the number of agents exiting 𝑟1 (i.e., arriving at the destination) in unit time equals the traffic flow 𝑄 (𝑄 ), which changes over the next cycle. Meanwhile, substitute (1) into (8) for the expected number of agents entering 𝑟1 per unit time to get 𝐸[𝑁1 ]/𝜏 = 𝑃1 𝑍 ⋅ 𝜆, which is without any change compared with that in the last cycle. Thus, the number of agents entering may be larger (𝑄, first case) or smaller (𝑄 , second case) than that exiting in unit time at the beginning of the next cycle. In the zero-information regime, drivers cannot adjust along the real-time system performance because they cannot acquire real-time traffic information. Therefore, the expected number of agents entering 𝑟1 in unit time in the first case is as good as the second case. In the first case, the queue can be released finally within a certain time because the number of agents entering 𝑟1 is smaller than that exiting the route over the next period of time. In the second case, the situation may become worse if the queue extends beyond the capacity of congestion evacuation, which is characterized by a greater variability of the travel time. Although the evacuation process is within the capacity of congestion evacuation, it will require a relatively long period of time.
In the full-information regime, drivers adjust their route choices according to the real-time information about the network performance (𝑇1 and 𝑇2 ). Substitute (1) into (5) for the expected number of agents entering 𝑟1 per unit time to get 𝐸[𝑁1 ]/𝜏 = 𝑃1 𝐹 ⋅ 𝜆. As mentioned above, given that network capacity can satisfy the traffic demand, one route becomes congested, whereas the other route must be free. Thus, 𝑇2 becomes smaller as 𝑇1 becomes larger. Therefore, the expected number of agents entering 𝑟1 per unit time will become smaller in the next cycle compared with the last cycle according to (3), as shown in Figure 3. In the first case, the running state moves from point 𝐴 to point 𝐵 at the starting point. The execution process is shortened because of the decrease in the number of agents entering 𝑟1 per unit time. In the second case, congestion is more serious than that of the first case; thus, the relationship between two cases can be written as 𝑇1First < 𝑇1Second , 𝑇2First > 𝑇2Second
(10)
𝑇2First 𝑇2Second > . 𝑇1First 𝑇1Second According to (3), the expected number of agents entering 𝑟1 per unit time in the second case is smaller than that of the first case over the next cycle. The running state moves from point 𝐴 to point 𝐶 or 𝐷 at the starting point. In this condition, even when the expected number of agents entering 𝑟1 per unit time is larger than the agents exiting, the evacuation is made easier by diminishing the gap between the values of 𝑃1 𝐹 ⋅ 𝜆 and 𝑄 . 2.1.2. Concentration Analysis. From the analysis above, the information is beneficial for the system operation efficiency. However, in the full-information regime, travel behavior is adjusted by every driver, similarly according to the real-time system performance; however, the drivers are unaware of the behavior of others, which may lead to concentration. In the full-information regime, drivers intend to select the route with better performance that can maximize their own
Journal of Advanced Transportation
5
interests, which causes several drivers to select the same route, which ultimately will lead to an unstable and inefficient traffic system. Therefore, concentration may lead to an excessive response to the changes of operation conditions when a slight adjustment will suffice or the self-adjustment of the system is sufficient, such as in the first case. Moreover, the less agents selecting 𝑟1 means the more agents selecting 𝑟2 according to (6). Thus, in the second case, the usage of 𝑟1 significantly decreases due to concentration that leads to the sharp increase of the usage of 𝑟2 . Finally, the operation condition of 𝑟2 is expected to become congested as well. All these conditions contribute to an unstable traffic system. 2.2. Effect of the Penetration Rate of the Connected Vehicles. From the above analysis, the concentration phenomenon is thus related to excessive route choice adjustment after obtaining the traffic information. The tendency of overshooting arises from many drivers making similar adjustments at the same time. Apparently, only a fraction of drivers can acquire real-time traffic information provided by connected vehicles and make route choice according to the real-time system performance that can mitigate or even avoid the concentration. Suppose the penetration rate of connected vehicles is 𝑃 (0 < 𝑃 < 1). In other words, the proportion of drivers who can obtain real-time traffic information is 𝑃. The system comprises two types of drivers, namely, informed and uninformed. The informed drivers can select the appropriate routes according to the current situation in the next cycle; thus, the probability of the informed drivers selecting 𝑟1 is 𝑃1 𝐹 . Conversely, the uninformed drivers make route choice only according to the expected operation condition of the system rather than the current situation; thus, the probability of using 𝑟1 is a constant value of 𝑃1 𝑍 . The number of informed drivers entering 𝑟1 per unit time equals 𝑃 ⋅ 𝑃1 𝐹 ⋅ 𝜆 according to (1) and (5). Meanwhile, the number of uninformed drivers is (1 − 𝑃) ⋅ 𝑃1 𝑍 ⋅ 𝜆. The total number of drivers entering 𝑟1 per unit time 𝑞1 is obtained as follows: 𝑞1 = 𝑃 ⋅ 𝑃1 𝐹 ⋅ 𝜆 + (1 − 𝑃) ⋅ 𝑃1 𝑍 ⋅ 𝜆.
(11)
Based on the assumptions above, when congestion occurs in 𝑟1 , 𝑇1 > 𝐸[𝑇1 ] and 𝑇2 < 𝐸[𝑇2 ]. Thus, 𝑃1 𝐹 < 𝑃1 𝑍 .
This ranking is consistent with the above analysis; that is, with the proportion of informed drivers 𝑃, the incomplete connected vehicles can not only ease congestion quickly by reducing the usage of 𝑟1 compared with the situation in the zero-information regime but also contribute to system stability by avoiding excessive adjustment compared with the situation in the full-information regime. A larger value of the penetration rate of connected vehicles means that the system is nearly in a full-information regime. Otherwise, the system is nearly in a zero-information regime. Therefore, between the polar regimes of zeroinformation and full-information, an optimal value exists under certain conditions for the penetration rate of the connected vehicles which can make the connected vehicles be able not only to exert its advantages but also to overcome its drawbacks so as to play its excellent performance. The optimal value may be influenced by several factors, such as traffic demand condition (𝜆) and congestion status (𝑃1 𝑍 − 𝑃1 𝐹 ).
3. Simulation Experiment Based on Multiagent Technology The transportation system is simulated using an agent-based simulation environment (i.e., NetLogo). Network performance is defined by transportation engineers, combining the analysis of individual traffic elements. The system consists of agents (i.e., vehicle driver units) who operate and interact in a shared environment (i.e., limited-capacity road network). The performance of the entire system is the emergence of behavior of all its interacting elements [27]. NetLogo is a programmable modeling environment for simulating natural and social phenomena and particularly appropriate for modeling complex systems that develop over time. Modelers can present instructions to agents who operate independently. This situation makes it possible to explore the connection between the microlevel route choice behavior of individuals and the macrolevel patterns that emerge from their actions and interactions. 3.1. Development of the Simulation Environment. The development of simulation environment based on NetLogo is mainly composed of three parts: road network generation and initialization, agent’s generation and rule setting, and human–machine interaction module establishments. In the simulation environment, the network with 9 nodes and 12 roads is used, as shown in Figure 4. The gray segments in Figure 4 represent the roads; and the green segments represent the buildings. Agent generation and rule setting are organized as follows. This study focuses on the investigation of the effects of information on global network performance and system performance with a fraction of drivers receiving information service of connected vehicles. Agents can be informed or uninformed. Each agent that represents a vehicle is created with an arbitrary rate at the certain point within the simulation environment. When an agent is generated, it is assigned with individual attributes and rules, such as experiences, information, and route choice rules. Besides, the agents in this simulation environment
Journal of Advanced Transportation
road_1a
2
road_1b
road_2c road_2a
5
road_2b
road_2d
road_1d
4
7
road_3a
8
3
6
road_3d
road_1c
1
road_3c
6
road_3b
9
Figure 4: Road network in the simulation environment.
Figure 5: Interface of the simulation environment.
are given the microlevel behavior rules on the roads, such as the car-following model. Therefore the cars can respond to the conditions of the surrounding roads and cars, and the substantial cars traveling information can reflect the transportation system performance. So in the simulation environment, we can obtain the real-time traffic information about the transportation system performance through the running status data of substantial cars directly. Human–machine interaction module establishments: NetLogo enables developers to set up human–machine interaction modules, as shown in Figure 5. The modules can produce data generated by the simulation model monitoring, where the parameters determine the simulation scenario adjustment and the simulation animation display (Figure 4).
Thus, several simulation scenarios that represent the corresponding application environments of connected vehicles can be easily changed by the simulation parameter adjustment modules (i.e., the green parts of Figure 5; the cover rate of the connected vehicles is adjusted by the part marked in red circle).The significant characteristics of this simulation environment embody the collection and transmission of realtime information, which is relatively consistent with the connected vehicle environment. Specifically, each agent that represents the car in the network can perceive and record its own operating condition data and send this information to the agent that represents the central control unit of connected vehicles. Thus, the central control agent can collect real-time instantaneous traffic information and transmit the
3.2. Simulation Experiment Results. In the experiments, only a pair of origin-destination (OD) is presented in the network, as shown in Table 1. To ensure that the experiments are conducted with moderate traffic loads that avoid the extremes, the vehicle come-rate at the point of departure is set as follows: come-rate = 0.22. First, the simulation experiments are performed under the traditional driving environment and the connected vehicle environment. The time-dependent changes in the travel time of each road under the traditional driving environment and the connected vehicle environment are shown in Figures 6 and 7, respectively. It should be noted here that the unit of time is the ticks in the simulation environment. The traffic system performance under the connected vehicle environment (i.e., full-information regime) is better without the large spikes and high volatility compared with the traditional environment (i.e., zero-information regime). This phenomenon is in accordance with the analysis above that drivers can receive real-time traffic information under the connected vehicle environment to avoid congested roads. Thus, the congestions are prevented from getting further deterioration caused by vehicles continuously entering these roads. In addition, the maximum and mean values of travel time are small in the absence of serious congestion, as shown in Figures 8 and 9. In other words, the connected vehicles have improved traffic efficiency. The results illustrate
3000
2750
2500
2250
2000
250 200 150 100
road_3d
road_2d
road_1d
road_3c
road_2c
road_1c
road_2b
road_2a
50 0
information to the driver agents who are receiving the service of connected vehicles. These agents use this information as the basis of decision-making.
1750
300
road_1b
Figure 6: Time-dependent change of travel time under the traditional driving environment.
Figure 7: Time-dependent change of travel time under the connected vehicle environment.
road_1a
3000
2750
2500
2250
2000
1750
1500
1250
Time (ticks) “road_1c” “road_2c” “road_3c” “road_1d” “road_2d” “road_3d”
Time (ticks) “road_1c” “road_2c” “road_3c” “road_1d” “road_2d” “road_3d”
220
250
Travel time (ticks)
270
1250
0
Note. The routes are represented by ordered arrays, which are elements that store the position of each node in Figure 4.
road_3b
1-2-5-8-9 1-4-5-6-9
1000
Alternatives
road_3a
OD from 1 to 9 1-2-5-6-9 1-4-5-8-9
1-2-3-6-9 1-4-7-8-9
100 90 80 70 60 50 40 30 20
750
OD
Travel time (ticks)
Table 1: OD in the network and the alternative routes.
500
7
250
Journal of Advanced Transportation
Traditional driving environment Connected vehicle environment
Figure 8: Maximum value of travel time under the traditional driving environment.
the effectiveness of the connected vehicles, which distributes the traffic loads on road network in a practical way in space and time. Simulation results show that the connected vehicles can improve the performance of the traffic system. However, the relationship between the penetration rate of connected vehicles and the effect of connected vehicles on the traffic system has not been proven. Therefore, the simulation experiments are performed to reveal the best coverage of the connected vehicles. Figure 10 shows the performances of road_1a (without loss of generality) under different coverages of connected vehicles. Above all, we can clearly see that the performance of road_1a is not the best when the coverage of connected vehicles is 100% (i.e., full-information regime). Statistically, the performance of road_1a has the best condition when the coverage is approximately 70% rather than 100%, as shown in Figure 11. This result might be caused by the concentration of information when the coverage of connected vehicles is excessive. The real-time information prompted the drivers to select the roads with less travel time simultaneously. However, this scenario would lead to these roads to become crowded with the short distance
Traditional driving environment Connected vehicle environment
Figure 9: Mean value of travel time under the connected vehicle environment. 110
Figure 11: Statistics of travel time under different penetration rates of connected vehicles (road_1a).
100 90 80
60
70
58
60
56
50 Mean
Travel time (ticks)
Max. Mean Min.
0% 20% 40% 60%
3000
2750
2500
2250
2000
1750
1500
1250
1000
750
500
0
30
250
40
Time (ticks) 70% 75% 80% 100%
Figure 10: Travel time of in different penetration rates of connected vehicles (road_1a).
following driving phenomenon. The vehicles in these roads inevitably drove accompanied by frequent acceleration and deceleration, which caused not only confusion of the traffic flow but also the fluctuation of travel time aggravation. Other drivers may alter selections when the performance of these selections becomes worse in a vicious cycle. All of these conditions make the traffic system unstable. Figure 12 shows the evidence for this phenomenon.
4. Summary and Conclusions This study aids in understanding the effects of connected vehicles on global transportation system. This system has favorable and unfavorable characteristics, and its efficiency is influenced by the penetration rate of the connected vehicles. The conclusions drawn in this study can be divided into two aspects: implemented methodology and policy guidance. In terms of implemented methodology, an example based on the classical two-route network is adopted, in which the drivers are either informed or uninformed. Based on the characteristic summary of the connected vehicles, the benefits of connected vehicles for the efficiency of global transportation
Figure 12: Correlations between statistics and the penetration rate of connected vehicles.
system are revealed in comparison with the traditional environment. Meanwhile, the concentration phenomenon, which is caused by the excessively informed drivers simultaneously selecting certain routes with better performance, is proposed when the penetration rate of the connected vehicles is excessive. The efficiency of the connected vehicles influenced by its penetration rate is analyzed and proved, and the optimal penetration rate of the connected vehicles is identified by the simulation experiments under a certain condition. One of the most important contributions of this paper is that the characteristics of the connected vehicle environment are considered. The transportation system consists of users (i.e., vehicle driver units) who operate and interact in a shared environment (i.e., road network). The performance of the entire transportation system is the emergence of behavior of all its interacting elements. In addition, the analysis for the model is based on the principle that the connected vehicles are a dynamic feedback process between the driver route choice behavior and the transportation system performance over time. Furthermore, the multiagent technology has the potential to research the operating conditions of a traffic
Journal of Advanced Transportation network developing over time, resulting from driver route choice under the connected vehicle environment. Therefore, based on multiagent technology, NetLogo is used to develop the simulation environment that embodies the features of connected vehicles. Various scenarios (i.e., zero-information, full-information, and connected vehicles with various penetration rates) are simulated, and the results are analyzed. In terms of policy guidance, the results aid in understanding connected vehicles. In addition, the results are beneficial for traffic managers to make appropriate management measures. The connected vehicle environment is proven to enhance the efficiency of the global transportation system. However, an optimal penetration rate of connected vehicles exists instead of having more information. Thus, having more informed drivers does not mean the better performance of the transportation system. Hence, traffic managers should ensure that the penetration rate must be controlled within a certain range according to the application conditions by measures, such as containing the expenses of information services of the connected vehicles. For further studies, more efforts should be made to investigate the influential factors of the optimal penetration rate of connected vehicles.
Conflicts of Interest The authors declare that they have no conflicts of interest.
Acknowledgments This work is supported by the National Natural Science Foundation of China (71503018, U1564212, and U1664262).
References [1] M. Nourinejad and M. J. Roorda, “Impact of hourly parking pricing on travel demand,” Transportation Research Part A: Policy and Practice, vol. 98, pp. 28–45, 2017. [2] C. Ding, Y. Lin, and C. Liu, “Exploring the influence of built environment on tour-based commuter mode choice: a cross-classified multilevel modeling approach,” Transportation Research Part D: Transport and Environment, vol. 32, pp. 230– 238, 2014. [3] C. Ding, D. Wang, C. Liu, Y. Zhang, and J. Yang, “Exploring the influence of built environment on travel mode choice considering the mediating effects of car ownership and travel distance,” Transportation Research Part A: Policy and Practice, vol. 100, pp. 65–80, 2017. [4] X. Ma, Y. J. Wu, Y. Wang, F. Chen, and J. Liu, “Mining smart card data for transit riders’ travel patterns,” Transportation Research Part C: Emerging Technologies, vol. 36, pp. 1–12, 2013. [5] X. Ma, C. Liu, H. Wen, Y. Wang, and Y. Wu, “Understanding commuting patterns using transit smart card data,” Journal of Transport Geography, vol. 58, pp. 135–145, 2017. [6] J. Enrique Fern´andez L., J. de Cea Ch, and G. Germ´an Valverde, “Effect of advanced traveler information systems and road pricing in a network with non-recurrent congestion,” Transportation Research Part A: Policy and Practice, vol. 43, no. 5, pp. 481–499, 2009.
9 [7] R. Arnott, A. de Palma, and R. Lindsey, “Does providing information to drivers reduce traffic congestion?” Transportation Research Part A: General, vol. 25, no. 5, pp. 309–318, 1991. [8] A. De Palma, R. Lindsey, and N. Picard, “Aversion, the value of information, and traffic equilibrium,” Transportation Science, vol. 46, no. 1, pp. 1–26, 2012. [9] S. Khoshmagham, Y. Feng, M. Zamanipour, and K. L. Head, “Travel time observation in privacy ensured connected vehicle environment using partial vehicle trajectories and extended tardity,” in Proceedings of the Transportation Research Board Annual Meeting, Washington, DC, USA, 2015. [10] M. Gerla, E.-K. Lee, G. Pau, and U. Lee, “Internet of vehicles: from intelligent grid to autonomous cars and vehicular clouds,” in Proceedings of the IEEE World Forum on Internet of Things (WF-IoT ’14), pp. 241–246, March 2014. [11] F. Zhou, X. Li, and J. Ma, “Parsimonious shooting heuristic for trajectory design of connected automated traffic part I: theoretical analysis with generalized time geography,” Transportation Research Part B: Methodological, vol. 95, pp. 394–420, 2017. [12] J. Ma, X. Li, F. Zhou, J. Hu, and B. B. Park, “Parsimonious shooting heuristic for trajectory design of connected automated traffic part II: computational issues and optimization,” Transportation Research Part B: Methodological, vol. 95, pp. 421–441, 2017. [13] J. Ma, X. Li, S. Shladover et al., “Freeway Speed Harmonization,” IEEE Transactions on Intelligent Vehicles, vol. 1, no. 1, pp. 78–89, 2016. [14] C. Ding, X. Wu, G. Yu, and Y. Wang, “A gradient boosting logit model to investigate driver’s stop-or-run behavior at signalized intersections using high-resolution traffic data,” Transportation Research Part C: Emerging Technologies, vol. 72, pp. 225–238, 2016. [15] G. Londono and A. Lozano, “Dissuasive Queues in the Time Dependent Traffic Assignment Problem,” Procedia - Social and Behavioral Sciences, vol. 162, pp. 378–387, 2014. [16] X. Li, J. Cui, S. An, and M. Parsafard, “Stop-and-go traffic analysis: theoretical properties, environmental impacts and oscillation mitigation,” Transportation Research Part B: Methodological, vol. 70, no. 1, pp. 319–339, 2014. [17] N. Lu, N. Cheng, N. Zhang, X. Shen, and J. W. Mark, “Connected vehicles: solutions and challenges,” IEEE Internet of Things Journal, vol. 1, no. 4, pp. 289–299, 2014. [18] C.-Y. Chan, “Connected vehicles in a connected world,” in Proceedings of the 2011 International Symposium on VLSI Technology, Systems and Applications, VLSI-TSA 2011, pp. 86–89, April 2011. [19] R. Lindsey, T. Daniel, E. Gisches, and A. Rapoport, “Pretrip information and route-choice decisions with stochastic travel conditions: Theory,” Transportation Research Part B: Methodological, vol. 67, pp. 187–207, 2014. [20] E. Ben-Elia, R. Di Pace, G. N. Bifulco, and Y. Shiftan, “The impact of travel information’s accuracy on route-choice,” Transportation Research Part C: Emerging Technologies, vol. 26, pp. 146–159, 2013. [21] A. Popoviˇc and A. Habjan, “Exploring the effects of information quality change in road transport operations,” Industrial Management and Data Systems, vol. 112, no. 9, pp. 1307–1325, 2012. [22] S. C. Litescu, V. Viswanathan, H. Aydt, and A. Knoll, “The effect of information uncertainty in road transportation systems,” Journal of Computational Science, vol. 16, pp. 170–176, 2016.
10 [23] E. Ben-Elia and Y. Shiftan, “Which road do I take? A learningbased model of route-choice behavior with real-time information,” Transportation Research A: Policy and Practice, vol. 44, no. 4, pp. 249–264, 2010. [24] D. Levinson, “The value of advanced traveler information systems for route choice,” Transportation Research Part C: Emerging Technologies, vol. 11, no. 1, pp. 75–87, 2003. [25] R. Lindsey, T. Daniel, E. Gisches, and A. Rapoport, “Pretrip information and route-choice decisions with stochastic travel conditions: Experiment,” Transportation Research Part B: Methodological, vol. 67, no. 9, pp. 187–207, 2014. [26] R. H. M. Emmerink, K. W. Axhausen, P. Nijkamp, and P. Rietveld, “Effects of information in road transport networks with recurrent congestion,” Transportation, vol. 22, no. 1, pp. 21– 53, 1995. [27] S. Litescu, V. Viswanathan, M. Lees, A. Knoll, and H. Aydt, “Information impact on transportation systems,” Journal of Computational Science, vol. 9, no. 4, pp. 88–93, 2015.