Harris Semiconductor, P. 0. BOX 883, Melbourne, FL 32902. Patrick Lenahan and Christopher Frye. Pennsylvania State University, University Park, PA 16802.
IEEE TRANSACTIONS ON NUCLEAR SCIENCE, VOL. 43, NO. 6, DECEMBER 1996
2565
The Effect of Deposition Conditions on the Radiation Tolerance of BPSG Films Robert Fuller, Howard Evans, Carol Gamlen, Bill Czagas, Michael Morrison, David Decrosta and Robert Lowry Harris Semiconductor, P. 0. BOX 883, Melbourne, FL 32902 Patrick Lenahan and Christopher Frye Pennsylvania State University, University Park, PA 16802
Abstract A study has been conducted of the effects of deposition conditions on the radiation hardness of borophosphosilicate glass (BPSG). Films deposited by two common deposition techniques were evaluated using gamma cell testing, electron spin resonance (ESR), and capacitance voltage (CV) measurements. The results indicate that two stoichiometrically similar films can differ greatly in radiation tolerance depending on the deposition conditions.
I. INTRODUCTION Although borophosphosilicate glass (BPSG) is commonly used in the manufacture of semiconductor devices, there are very few published studies on the trapping characteristics of the bulk material [1,2] or thin BPSG films [3,4]. In the studies that have been published there has not been an investigation into the dependence of trapping characteristics on the film deposition parameters. The relationship between the trapping characteristics and the radiation response of transistors built using these films has also not been investigated. In this study we investigate the trapping characteristics of BPSG films deposited by two popular techniques. Additionally we attempt to relate the trapping characteristic to the radiation response of transistors.
II. EXPERIMENT A. Sample Preparation BPSG films from two common deposition tools were studied. Initially, three films were prepared. Films labeled A were deposited in an atmospheric pressure chemical vapor deposition (APCVD) system using silane, phosphine, and diborane in an overpressure of oxygen. Films labeled B 1 were deposited in a plasma enhanced chemical vapor deposition (PECVD) system using silane, phosphine, and diborane in an overpressure of nitrous oxide and a nitrogen carrier gas. Films labeled B2 were deposited in the PECVD system using a lower silane to nitrous oxide ratio and lower chamber pressure than films B1. The phosphine and diborane flow was chosen to result in the same weight percentage of boron and phosphorus in each film type. The weight percentage of boron and phosphorus was in the range of 3% to 4%. Samples for the ESR and CV measurements consisted of half micron films
deposited on blank high resistivity silicon wafers. These films were densified to represent the films as found in the semiconductor devices. BiCMOS test structures were also fabricated using film types A and B1 as the dielectric layer between the polysilicon gate and the first layer of metal. The BiCMOS process used is a radiation hardened 1.2 micron process that has been in production for about eight years. These samples were used for the gamma cell testing. A second set of six samples was fabricated using the PECVD deposition tool. The deposition parameters were varied to determine which parameters would affect the trapping characteristics. These samples are labeled C1 through C6. A summary of the samples prepared is shown in Table 1.
Table 1 Summary of Samples
Sample
Tool
Recipe
A
APCVD
Standard
BI
PECVD
Standard
B2
PECVD
0 2
Rich
c1
PECVD
0 2
Rich
c2
PECVD
Si& Rich
c3
PECVD
Standard
c4
PECVD
P& Rich
c5
PECVD
SH i &€'Q
C6
PECVD
02/PH4 Rich
Rich
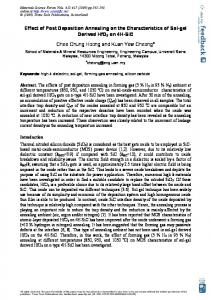
B. Gamma Cell Testing In order to test the effect of the BPSG film, NPN devices were chosen as the test structure. A diagram of this device is
shown in Fig. 1. If sufficient charge is trapped in the BPSG film, the area of the P-well under the BPSG and field oxide will invert. This inversion layer will create a leakage path between the emitter (N+) and the collector (substrate) as
0018-9499/96$05.00 0 1996 IEEE
2566
microwave cavity such that the normal to the dielectric-silicon interface was parallel to the magnetic field vector.
Trapped Charge I
I
Collector (Substrate) Fig. 1 - Diagram of the NPN test device. shown in the diagram. A similar leakage path might exist on NMOS devices depending on the layout and processing parameters. Test transistors from the BiCMOS wafers were packaged and tested using a Co60 gamma ray source. The devices were maintained at room temperature during irradiation and were biased under worst case conditions (V,=5, V,=V,=O). The dose rate in the gamma cell was approximately 1.2 krad (Si) per minute. The device parameters were measured using a HP 4062B test system before and after various radiation levels. The measurements were made within 30 minutes of removing the samples from the gamma cell. The off state leakage (1,ff) for the NPN device is defined as the collector (substrate) current measured with the collector at 5 volts and the emitter and base at 0 volts.
C. Charge Injection To evaluate the trapping characteristic of the films, charge was injected in several ways [51. Electrons were photoinjected into the films using unfiltered ultraviolet (W) light with hclhl5.1 eV while a positive corona ion bias was applied across the films. The electron fluence was calculated from the change in surface potential. Holes were injected by exposing the samples to filtered vacuum ultraviolet light (VUV) with h c l k l 0 . 2 eV while a positive corona ion bias was applied across the films. The 10.2 eV photons create electron hole pairs in the top 10 nm of the film. The positive corona bias drives the holes through the rest of the film, while the electrons recombine at the surface. Hole fluence is determined in a similar manner to electron fluence. A very efficient method to generate paramagnetic centers is to expose unbiased samples to unfiltered VUV light with hclhll0.2 eV. In this case both holes and electrons are generated throughout the film.
D. ESR Measurements A Bruker ER 200 SDC electron spin resonance spectrometer with a “300 series” bridge was used for all the ESR measurements made in this study. For the ESR measurements made in this study, samples were placed in the
I
Two types of ESR measurements were made on the samples in this study. The first type of measurement, which we will refer to as the first harmonic, was made over a range of about 150 to 200 Gauss. By first harmonic, we refer to the standard first derivative of the absorption detection mode used most often in ESR spectroscopy. The first harmonic measurements were made at a non-saturating microwave power level (this turned out to be about 3mW for the phosphorus and boron related centers), and with modulation amplitude and frequency of 5 Gauss and 100kHz, respectively. Spin counts for the first harmonic measurements were obtained by twice integrating the first derivative of the absorption signal and comparing it to the second integral of a weak pitch spin standard absorption signal obtained at the same spectrometer settings. With this spin counting scheme, we estimate an accuracy in absolute spin concentration good to within a factor of two, and a relative spin concentration accurate to within +I- 10%. In the second type of ESR measurement, which we will refer to as the second harmonic, the second harmonic mode of detection was used with high microwave power (-3OmW) and a high modulation amplitude (-20 to 50 Gauss). In addition, the measurements were made at low modulation frequency (-12.5kHz) and over a wide range of magnetic field (-2000 Gauss). The second harmonic detection mode uses the phase quadrature portion of the modulation signal for detection, so the output signal had to be rotated ninety degrees out of phase. These settings presumably optimize the fast passage condition for the resonance of the defects under study. According to Griscom et al. [1,2], the fast passage condition and the second harmonic mode of detection used together result in a higher signal amplitude (relative to the first harmonic mode) for the detection of broad spectra involving centers with long spin-lattice relaxation times. It should also be noted that, for complicated reasons, the second harmonic, out-of-phase spectra appear as the absorption spectra when the fast passage condition is met. One shortcoming of the second harmonic mode of detection is that the amplitude of the fast passage spectrum for various defects will vary in complex ways with modulation frequencies, modulation amplitudes, and microwave power levels. For this reason, although several defects may exhibit fast passage effects for a given set of spectrometer settings. the increase in signal amplitude over that of the first harmonic signal varies from defect to defect. Therefore, it is not possible to compare the spectra of different defects within a second harmonic trace for quantitative spin comparisons. Moreover, no single spin standard can be made for counting the spins of any defect detected in the second harmonic mode (technically, this can be done if the spin-lattice time constants and the spin-spin time constants are known for all defects being compared). Assuming that the spectrometer settings are not changed from measurement to measurement, however, the
2567
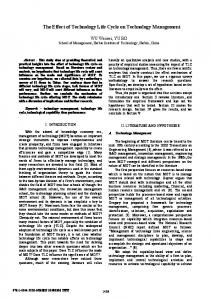
signal amplitude for a single defect should scale with the spin the devices using film A even after a dose of 150 krad. density of that defect. Accordingly, we developed a spin counting scheme by making both first and second harmonic B. CV Measurement measurements on a thick (-3000 nm) sample with a very high spin concentration. In this way, the first harmonic spectra To determine the charge trapping characteristics of the could be compared to the weak pitch standard and a spin films, high frequency ( 1 MHz) CV measurements were made concentration for an individual defect could be associated as a function of injected charge. These results are shown in with the signal amplitude of its second harmonic spectra. These second harmonic spectra were then used as a spin standard for samples in which the spin concentrations were so low that their spectra could only be detected in the second harmonic mode. 60
-e- Film A -
III. RESULTS
Holes
-- 13
-40
-
-
U)
.L
A. Gamma Cell Testing The post 300 krad (Si) radiation IV characteristics are shown in Fig. 2 for the NPN transistors. The collector current is plotted as a function of the base bias. The results for transistors built using film B 1 have a large leakage component in the collector current after 300 krad while those built using film A do not. This leakage can be explained by the parasitic 1.00E-01
&Fllm A -
c -
-40
t
-60 -80
Electrons U - Film E1 Electrons
1
4
O.OE+OO
1.00E-03
Holes
--
$20
a - Fllm E1 -
I 1.OE+13
2.0€+13
3.OE+13
Charge Fluence (lcm2) Fig. 3 - CV shifts due to injected charge for films A and B 1.
i
- 1.00E-094 0
1.00E-11
, ,~
'""*;
I
;
0.8
1
~
,:..? $
1.00E-13
0
0.2
0.4
0.6
1.2
Vbe (volts) Fig. 2 - Post 300 krad (Si) IV curves for NPN transistors with film A and film B1 as the poly-metal dielectric. leakage path shown in Fig. 1. The results for the leakage at V p O volts (Ioff)are summarized in Table 2 for each film type. Clearly devices with film B 1 as the poly-metal dielectric have several orders of magnitude more off-state leakage than
Table 2 Gamma Cell Test Results
Film A
Radiation Level
Film B1
N-fleld FET I&
N-Field FET Ion
Pre-Rad
1x10-'2A
1 ~ 1 0 -Al ~
50 krad (Si)
IxIO-'~A
I x ~ O -A' ~
150 krad (Si)
3x 1O-l2 A
8xlO-''A
3x10-'2A
1x10⁻⁷A
--
-
300 krad (Si)
'
Fig. 3. Both films have a high density of electron and hole traps with large capture cross sections of approximately 1x 10l 3 cm2. For hole injection, the CV shift for film A saturates after a fluence of 1 . 5 ~ 1 0 + ' ~ / cwhile m ~ the shift for film B1 continues to increase. This contrasts with electron injection where the CV shift for film B1 saturates and the shift for film A continues to increase. 100 krad of gamma radiation generates approximately 3 . 5 ~ 1 0 + ' ~ / c holes m ~ in the 0.5 micron film. The larger CV shift observed in film B1 at this level of injection matches the onset of leakage in the gamma cell experiment.
C. ESR Measurement To further investigate the nature of the traps in these films, ESR measurements were performed. The traps were activated by combinations of exposure to unfiltered vacuum ultraviolet light (VUV), hole injection, and electron injection as described above. Prior to exposure, the ESR measurement showed no paramagnetic defects in any of the films. However, after activation of the defects, six paramagnetic centers could be observed in some of the films. The densities of these defects are strongly processing dependent. Among the six defects, two are the widely studied intrinsic Pbo and E' centers [6]. The Pbo center is an unpaired spin primarily localized on a silicon back bonded to three other silicon atoms at the Si/SiO2 boundary [6]. It is the dominate radiation induced
2568
interface state. The E’ center is also an unpaired spin localized on a silicon atom, in this case a silicon back bonded to oxygen atoms in the oxide. In high quality thermally grown oxides E’ centers are the dominant deep hole traps [6]. The other four centers are associated with the boron and phosphorous atoms.
BOHC
7
,-
Both boron and phosphorous atoms have magnetic nuclei. Phosphorous has a 100% abundant spin-112 nucleus. About 80% of boron atoms have a spin-312 nucleus; the remaining 20% have a spin-3 nucleus. These magnetic nuclei create local magnetic fields at the defect sites. Quantum mechanics restricts the phosphorous spin- 1/2 nucleus to two possible orientations in the strong applied magnetic field of the ESR measurement. This produces two local fields at the phosphorous sites. Thus, phosphorous associated defects will produce two line spectra. The situation is more complicated for boron associated sites. The boron spin-312 nucleus has four possible orientations; the spin-3 nucleus has seven possible orientations. Two of the four impurity related centers, that is, the boron and phosphorous related centers, involve an unpaired electron primarily localized on oxygen atoms bonded to phosphorous or boron. These centers are called, respectively, the phosphorous oxygen hole center (POWC) and the boron oxygen hole center (BOHC). Since the I 1 electron spins are relatively distant from the magnetic nuclei (oxygen nuclei are not magnetic) their spectra consist of 200G relatively closely spaced, relatively narrow lines. Traces of both the BOHC and POHC spectra appear in Fig. 4a. Both BOHC and PQHC spectra have been observed in recent Fig. 4 - ESR spectra from film A after two hours VUV exposure studies of BPSG thin films [3,4]. They had earlier been (a) narrow scan, (b) wide scan identified in studies of large volume samples. The two other “non-intrinsic” centers observed are called the PI and P2 defects. Both involve an unpaired spin strongly localized on a as mentioned previously, be identified by monitoring ESR phosphorous atom 121. These centers have been observed spectra as a function of electron or hole injection. previously in bulk samples [2], but, to the best of our Fig. 7 shows the ESR spectra for film A after exposure to, knowledge, have not previously been reported in thin films. in order, two hours of VUV illumination, injection of 4x10‘’ The proximity of the electronic spin and the magnetic nuclei /cm2 electrons, injection of 3 ~ 1 0/cm2 ’ ~ holes. The injection of produce a very strong magnetic field for the unpaired electrons decreases the PQHC spin density by about 30%. The electron. This strong field is reflected in the very broad ESR BOHC signal is unchanged. The subsequent injection of holes line doublets split by very large fields - 1000 Gauss. Traces of these spectra appear in the very wide scan ESR plot of Fig. 4b.
I ll
-
Film B l The spin densities of the various centers depend strongly upon processing. In Fig. 5, we compare narrow scan ESR traces of samples A and B 1. In both cases, the samples were exposed to identical two hour periods of VUV illumination. Clearly, the strong POHC and BOHC spectra of sample A are absent in B 1. Fig. 6 illustrates a comparison of wide scan ESR traces of 20 G Film A the same samples, in this case after VUV illumination, electron injection and hole injection. The PI and P2 spectra are clearly evident in sample A’s trace but are not detectable Fig. 5 - Comparison of ESR spectra from samples A and B1 after in sample B1. The electronic properties of these defects can, two hours VUV exposure.
2569
Film B 1
Y Film A
20G Fig. 8 - ESR spectra of film B1 after A) two hours VUV, B) injection of 4x10’” /cm2electrons, and C) injection of 3 ~ 1 0 ”/cm2 ~ holes.
200G Fig. 6 - Wide scan ESR spectra of film A and B 1.
almost doubles the POHC density but does not measurably change BOHC density. Fig. 8 shows ESR traces of film B1 after the same treatments illustrated in Fig. 7 for film A. The results are dramatically different. The only change in the spectra is an increase in the Pbo center signal with electron injection and a subsequent decrease with hole injection.
20G
Another comparison, this between films A and B2 after two hours of V W exposure, is shown in Fig. 9. BOHC and POHC defects are present in film B2, but at a density about 30% lower than that of film A. Additional spin density measurements were made on films CI through C6. These results, as well as those described earlier, are summarized in Table 3.
-
V
20 G Fig. 7 - ESR spectra of film A after A) two hours VUV, B) injection of 4x10” /cm2electrons, and C) injection of 3 ~ 1 /cm2 0 ~ holes. ~
Film B 2
Fig. 9 - ESR spectra of film A and B2 after two hours VUV
IV.DISCUSSION A. Charge Trapping in Film A Fig. 5 and 6 show that film A exhibits much higher concentrations of paramagnetic defects than film B 1. Typically high concentrations of paramagnetic defects are associated with poor radiation tolerance. In this case, the gamma cell testing shows the opposite to be true. Apparently these defects improve the radiation performance of film A. From the CV shift information, it can be seen hole trapping in film A saturates whereas electron trapping does not. We suggest that holes trapped in these paramagnetic defects are subsequently neutralized by the trapping of an electron. Fig. 7 shows that the POHC signal decreases when electrons are trapped and increases when holes are trapped. This supports the POHC model suggested by Warren et al. [4]. In this model, the POHC precursor is neutral stoichiometricP205 that becomes positively charged after the capture of a hole. This center could then act as a coulombic trap for electrons. This contrasts with the stable model suggested by Griscom et al. [2] where the POHC is modeled as a negative precursor that is neutralized by the trapping of a hole. Film A also exhibits PI and P2defects. Griscom et al. [2] proposed the Pi center to be a trapped hole at a PzO3 nonstoichiometric configuration and the P2 to be an electron trapped at a PO2 nonstoichiometric configuration. An electron trapped at a P2 center would
2570
Table 3 Summary of ESR spin density measurements
Sample
History
POHC (cm")
A
vuv
not measured
not measured
4.8~10'~
4.8~10"
A
VUV, ~ x ~ ~ - ' ~ e l e c t r o n s not measured
not measured
3.4x10'6
4 . 8 ~0l6 1
A
VUV, 1x10-'2eIectrons, 1x10-l2holes
-3 x10¹⁷
-3 x10¹⁷
7.4~10'~
4.8~10'~
B1
vuv
not measured
not measured
*
*
B1
VUV, 1x10-'2electrons
not measured
not measured
*
*
B1
VUV, 1x10-'2electrons, I x ~ O -holes '~
*
*
B2
vuv
*
e1
2x1 0l3holes
*
c2
2x10" holes
*
e3
2xlOI3holes
*
*
l.lx1 Ol6
*
c4
2x10¹³holes
*
*
*
C5
1.2x10¹³holes
*
*
*
C6
2x1 Oi3 holes
*
*
5.7~10'~
BOHC (cm")
*
* below detection limit neutralize a hole trapped at a PI center. The balance between the PI and P2 centers could be responsible for the superior radiation performance of film A. The concentration of Pi and P2 centers are roughly equivalent and about five to ten times higher than the POHC concentration. These centers may dominate the radiation response of film A. Diagrams of these defects are shown in Fig. 10
B. Charge Trapping in Film B1 and B2 No ESR signals other than a small Pbo center were detected in film B1 after VUV, electron injection or subsequent hole injection. This suggests that both the precursor and the positively charged sites are diamagnetic for both hole and electron trapping. This electron trapping behavior has been associated with a defect that traps two electrons simultaneously. This can occur if the lattice relaxation energy gained by the doubly occupied orbital can compensate the electron-electron repulsive energy. These trap sites have a negative correlation energy [7]. POHC's are evident in film B2 after charge injection. This observation
suggests that POHC concentration may be related to the oxygen content in the films. This may be affected by the flow ratios of the gases during the film deposition. Samples C l through C6 were fabricated to investigate this.
C. The Effect of Deposition Conditions The results of the ESR measurements of films C l through C6 were analyzed to determine which parameter had the largest effect on the observed paramagnetic defect density after hole injection. The resulting response surface model (RSM) of the fit to the data had a correlation coefficient (R2) of 0.81. The analysis indicated that the phosphine to nitrous oxide ratio had the largest effect on the concentration of POHC's. Lowering this ratio increased the concentration of POHC's in the film. The phosphine to silane ratio and the nitrous oxide to silane ratio had a lessor effect, but the trend was the same: increasing the oxygen in the reaction increased the POHC concentration. The pressure of the deposition had no effect on the POHC concentration. The result for the POHC's agrees with the proposed defect models. The POHC
2571
Griscom et d.P,
Griscom et al.POHC
Warren et al.POHC
Griscom et d.BOHC
Fig. 10 - diagrams of various phosphorus - oxygen defect centers found in BPSG films is modeled to be stoichiometric P205as opposed to an oxygen deficient configuration of phosphorus and oxygen. Increasing the oxygen present during the reaction should increase the concentration of fully reacted P205,The disappointing result was that no P1 or Pz defects were observed in any of the samples from the PECVD deposition tool. One might expect that lowering the oxygen concentration in the reaction would increase the oxygen deficient configurations of phosphorus and oxygen. This was not observed.
V. CONCLUSIONS BPSG films deposited by APCVD and PECVD were evaluated using gamma cell testing, electron spin resonance (ESR), and capacitance voltage (CV) measurements. The results indicate that two stoichiometrically similar films can differ greatly in radiation tolerance depending on the deposition conditions. The difference in the radiation tolerance can be explained by the film’s trapping characteristics. The radiation hard APCVD film displayed the spectra for POHC and BOHC as well as the spectra for the PI and P2 centers. The radiation soft PECVD film showed no discernible trapping centers in the ESR signal. Experiments with the PECVD deposition conditions indicate that the POHC density can be effected by the deposition conditions, however we have been unable to indentify changes in the PI or P2 density with process variations. The hardness of the APCVD film appears to be due to a balance in electron and hole traps.
VI. REFERENCES [ I ] D.L. Griscom, E. J. Friebele, K. J. Long, and J. W. Fleming, “Fundamental defect centers in glass: Electron spin resonance and optical absorption studies of irradiated phosphorus-doped 43* PP. 960glass and optical fibers,” J. &‘pl. phYs.
967, March 1976. [2] D. L. Griscom, G. H. Sigel, Jr, and R. J. Ginther, “Defect centers in a pure-silica-core borosilicate-clad optical fiber: ESR studies”,J. Appl. Phys. vol. 54, pp. 3743-3762, July 1983. [3] W. L. Warren, M. R. Shaneyfelt, D. M. Fleetwood, and P. S.
Winokur, “Nature of defect centers in B- and P-doped SiOl thin films,”Appl. Phys. Lett. vol. 67, pp. 995-997,August 1995. [4] W. L. Warren, M. R. Shaneyfelt, D. M. Fleetwood, P. S. Winokir, and S. Montague, “Electron and Hole Trapping in Doped Oxides”, IEEE Trans. Nucl. Sci. vol. 42, pp. 1731-1739, December 1995.
[5] J. F. Conley, Jr., P. M. Lenahan, and P. Roitman, “Electron Spin Resonance Study of E’ Trapping Centers in SIMOX Buried Oxides,” IEEE Trans. Nucl. Sci. vol. 38, pp - . - - 2, Decmeber 199I. ‘
’-
[6] J. F. Conley, Jr. and P. M. Lenahan, A Review of Electron Spin Resonance Spectroscopy of Defects in Thin Film Si02 on Silicon, in The Physics and Chemistry of Si02 and the Si-Si02 Inteface III, H. 2.Massoud, E. H. Poindexter, and C. R. Helms editors. The Elctrochemical Society, Pennington, NJ (1996) ~214-249. [7] P. W. Anderson, “Model for the Electronic Structure of Amorphous Semiconductors,”Phys. Rev. Lett. vol. 34, pp. 953955, May 1975.