Nov 30, 1987 - It is found that the freezing and sublimation provide a ... evaporation of frozen particles. .... loading, condensation and evaporation, freezing.
Tellus (1989), 4 1 A , 132-147
The effect of parameterized ice microphysics on the simulation of vortex circulation with a mesoscale hydrostatic model By DA-LIN Z H A N G , Nutionul Center for Atmospheric Reseurch, Boulder, CO 80307-3000, USA (Manuscript received 30 November 1987; in final form 26 April 1988)
ABSTRACT It has been proposed that ice microphysics, particularly the melting effect, can play an important rde in the generation of mesoscale structure and evolution of convective weather systems and associated stratiform rainfall. In this paper, parameterized cloud ice and snow crystals are incorporated into an explicit (grid-resolved) convective scheme as prognostic variables and tested using an observed mesovortex on a grid resolution of 25 km. With the inclusion of ice microphysics parameterization. the resolvable-scale precipitation begins to develop nearly 1 h earlier and undergoes a more rapid acceleration. Meanwhile, the resulting maximum upward motion and locally accumulated rainfall are significantly larger than that without ice microphysics. However, the model produced a relatively weak mesovortex circulation with the maximum cyclonic vorticity located more than 50 mb higher when the ice microphysics is incorporated. It is found that the freezing and sublimation provide a positive forcing for the rapid development of the mid-tropospheric warm-core vortex circulation, while the melting tends to destroy the concentration of cyclonic vorticity in the lower levels. In particular, intercomparisons among all sensitivity experiments so far performed reveal that the melting effect can be of equal importance to those of the hydrostatic water loading and evaporative cooling in retarding the development of the CISK-like instability and in reducing the intensity of the mesovortex. The results indicate that the vertical distribution of diabatic heating may be more important than the total heating in determining the strength of mesovortices. when the melting effect is considered.
1. Introduction It has been recognized for more than 5 decades that ice particles play an important r81e in the formation of precipitation (Bergeron, 1935). This recognition formed the experimental basis for dynamic cloud seeding in which massive artificial ice nucleation in updraft regions increases buoyancy through additional latent heat release of fusion and sublimation (Simpson et al., 1965). In addition, many numerical simulations of individual clouds show that incorporation of icephase microphysics tends to produce more realisI The National Center for Atmospheric Research (NCAR) is funded by the National Science Foundation.
tic structure and evolution of convective storms than that without ice-phase microphysics (e.g.. Orville and Kopp, 1977; Cotton et al., 1982; Lin et al., 1983). However, the significance of ice-phase microphysics in the generation of mesoscale structure and evolution did not become evident until Zipser (1969; 1977) and others noted characteristic “diamond-shaped” thermal profiles often present in the trailing stratiform region of tropical squall lines. Those profiles exhibit a gradual separation of temperature and dew point curves below the 0°C isotherm and then a merging of the curves on approaching the surface. Such a thermal structure suggests the existence of mesoscale unsaturated downdrafts that may partly result from the melting and Tellus 41A (1989), 2
EFFECT OF PARAMETERIZED ICE MICROPHYSICS ON THE SIMULATION OF VORTEX CIRCULATION
evaporation of frozen particles. The “diamondshaped” soundings have also been found in many mesoscale convective systems (MCSs) in midlatitudes (Ogura and Liou, 1980; Johnson, 1986; Leary and Rappaport, 1987). In particular, the 0°C isotherm, which is often observed as a “bright band” in radar echoes, has been conceptually regarded as the demarcation between mesoscale updrafts associated with predominant stratiform (anvil) clouds and mesoscale downdrafts beneath for tropical cloud clusters (see Houze, 1977). A recent Doppler radar study by Chong et al. (1987) appears to support such a conceptual flow structure. Furthermore, Leary and Houze (1979) investigated five cases of tropical anvil clouds and found that cooling rates due to melting of ice particles were conparable to that by evaporation of raindrops within I-km layer immediately below the melting level. This further suggests that melting can be an important factor for the initiation or maintenance of mesoscale downdrafts. In fact, numerical sensitivity studies by Willoughby et al. (1984) and Lord et al. (1 984) confirm that the widespread cooling by melting of frozen particles can generate a preferred region for the development of mesoscale downdrafts. Srivastava (1987) also showed that the melting of ice particles increases the intensity of downdrafts. Recently, the importance of ice microphysics has been further emphasized. Churchill and Houze (1984) observed during the Winter Monsoon Experiments (WMONEX) that the stratiform region of tropical cloud clusters were largely composed of ice particles and responsible for more than 45% of the total precipitation. Based upon the fact that within the mid- to upper-troposphere there often exists a front to rear relative flow accompanying MCSs and associated stratiform clouds, Smull and Houze (1987) proposed a hypothesis that the fallout of rearwardly advected ice particles from the leading convective line can be responsible for most of precipitation in the trailing stratiform region. Later, with a two-dimensional diagnostic model, Rutledge and Houze ( I 987) obtained some plausible results for the validation of the SmullHouze hypothesis, although their results appear to be sensitive to the magnitude of the front to rear flow and the vertical distribution of hydrometeors. The trailing stratiform region has Tellus 41A (1989), 2
133
also been found to be a favorable location for the development of mesovortices-an important component of MCSs and many recent studies have shown the presence of large amount of widespread low- to mid-level stratiform precipitation associated with those vortex systems (Churchill and Houze, 1984; Rockwood et al., 1984; Smull and Houze, 1987; Zhang and Fritsch, 1987). From the above brief review, it is apparent that explicit incorporation of ice microphysics into mesoscale can be very important not only for the reasonable prediction of resolvable-scale precipitation, but also for the realistic simulation of the mesoscale structure and evolution of convective weather systems. In particular, Zhang and Fritsch (1987) and Zhang et al. (1988) pointed out that as the grid size decreases to capably resolve mesoscale features, the grid-scale phase changes need to be described realistically, since it has been widely recognized that with such a grid spacing resolvable-scale updrafts and downdrafts become an integral part of MCSs and phase-change processes (Zipser, 1977 ; Houze, 1977; Ogura and Liou, 1980; Brown, 1979; Leary, 1980; Maddox, 1983). Furthermore, Molinari and Dudek (1986), Kalb (1987) and Zhang et al. (1988) found that mesoscale models are prone to the unrealistic development of the conditional instability of the second kind (or the CISK-like instability) when simulating mesovortices or when a model cyclone is falsely generated (so-called numerical point storm) as a result of unsatisfactory mechanisms to release local gravitational instability (also see Kasahara, 1961). (The CISK-like instability is referred to by Zhang et al. (1988) as an overenhanced positive feedback process on the resolvable scale among latent heat release, moisture convergence and the surface pressure fall.) Molinari and Dudek (1986) and Zhang et al. (1988) also illustrated that the incorporation of resolvable-scale evaporation and hydrostatic water loading helps stabilize the vertical atmospheric column, and thus retards the development of the CISK-like instability. Thus, it is desirable to include an additional retarding factor through melting of ice particles for the control of the CISK-like instability. Moreover, the r6les of ice-phase microphysics in mesoscale hydrostatic models have not been rigorously examined with real-data cases.
134
DA-LIN ZHANG
For the purpose of investigating the effect of parameterized ice microphysics on the simulation of MCSs, an observed mesovortex that developed in the 19-20 July 1977 Johnstown, Pennsylvania (USA) flood events is chosen for this study. The development of most mesovortices has been found to be strongly linked to the resolvable-scale diabatic heating or stratiform condensation and therefore requires more realistic model physics to describe the resolvable-scale phase changes (Zhang et al., 1988). Thus, under such a meteorological circumstance, ice microphysics can demonstrate its r d e in reproducing the intensity and distribution of MCSs and associated rainfall. In this model, the resolvable-scale ice-phase microphysics parameterization follows Lin et al. (1983) and Rutledge and Hobbs (1983), and is described briefly in Section 2 and the Appendix. Section 3 provides a sensitivity study of different effects on ice microphysics, such as full ice physics, freezing, melting and sublimation, on the simulation of the Johnstown mesovortex. Section 4 contains a summary and concluding remarks.
2. Model description The model used for this study is an improved version of the Pennsylvania State University/National Center for Atmospheric Research (PSU/NCAR) mesoscale hydrostatic model originally described by Anthes and Warner (1978); it is very similar to the version used by Zhang and Fritsch (1986a), Zhang et al. (1988) for the same case study of the 1977 Johnstown flood event. The following modifications are considered to be very important for the numerical simulation of mesovortices : 0 an explicit (i.e., grid-resolved) convective scheme containing predictive equations for cloud water (ice) and rainwater (snow) (Hsie et al., 1984; Lin et al., 1983; Rutledge and Hobbs, 1983); and 0 an improved explicit (i.e., parameterized) convective scheme of the Fritsch-Chappell (1980, also see Zhang and Fritsch, 1986a) for the fine mesh and the R. A. Anthes-H. L. Kuo (Anthes and Keyser, 1979) for the coarse mesh portion of the nested-grid model.
Other important modifications include a twoway interactive nested-grid procedure (Zhang et al., 1986); a modified version of the Blackadar “large-eddy exchange” planetary boundary layer (PBL) parameterization (Zhang and Anthes, 1982: Zhang and Fritsch, 1986a); and virtual temperature effects in the ideal gas law. The nested-grid ratio is 1 to 3 with a fine-mesh length of 25 km and a coarse-mesh length of 75 km. The number of grid points for the ( x , y , a) dimensions of coarse and fine meshes are 39 x 31 x 19 and 43 x 37 x 19, respectively. The vertical coordinate a is defined as a = (p -p,)/p* and p* = p s - p t where pt (=80 mb) and p s are the pressure at the top of the model and at the surface, respectively. Since the results from the find mesh domain are of essential interest, the following descriptions will be confined only to the fine-mesh portion of the simulation. All experimental simulations are initialized at 1200 GMT 19 July 1977, and integrated in time for 12 h which is roughly a lifecycle of the Johnstown mesovortex. For a more detailed description of the different model aspects, the reader is referred to Anthes and Warner (1978), Zhang and Fritsch (1986a), Anthes et al. (1987), and Zhang et al. (1988). The implicit Fritsch-Chappell convective scheme contains individual components of updrafts, moist downdrafts and subgrid compensating subsidence, and includes parameterized freezing and melting effects (see Fritsch and Chappell, 1980). Zhang et al. (1988) and Zhang (1988) showed that the implicit convective scheme is very important for the numerical simulation of convectively driven mesoscale weather systems even with a grid resolution of 12.5 km. Without the Fritsch-Chappell scheme, the explicit convective scheme fails to reproduce any precipitation associated with the squall line system that occurred in the Johnstown flood events, and the mesovortex is overgenerated. The explicit convective scheme contains the effects of virtual temperature, hydrostatic water loading, condensation and evaporation, freezing and melting, and sublimation. In the present explicit convective scheme, the phase demarcation between liquid water (i.e., cloud water and rainwater) and frozen particles (i.e., cloud ice and snow crystals) is made to be dependent upon the position of a parcel (above or below the 0°C Tellus 41A (1989), 2
EFFECT OF PARAMETERIZED ICE MICROPHYSICS ON THE SIMULATION OF VORTEX CIRCULATION
isotherm). Furthermore, the freezing of cloud water and rainwater, and the melting cloud ice and snow are assumed to occur within a model layer (i.e., about 50 mb thick for this case study) around the 0°C isotherm. Note that the melting of most ice particles generally occurs at one level below the level where the freezing and sublimation become operative due to the discretized nature of the vertical grids, i.e., when T > 0°C is checked for melting from the model top downward and T I 0°C for freezing from the model bottom upward. Supercooled liquid water is not allowed to exist in the model. This is considered to be a reasonable approximation for mesoscale vertical resolution less than 20 layers. The computational advantage of making this approximation is that cloud ice and snow can be stored in the same array as cloud water and rainwater, respectively. The explicit predictive equations for water vapor, q v , cloud water and ice, qw,, and rainwater and snow, qm, and the --cessary thermodynamic equation are given by : dP* 4" St
SP* q w , dt
Tellus 41A (1989), 2
135
where
6={
at the melting or freezing level, 0 at all other levels, 1
(5)
and Cp,
= C,(1
+ 0.814,)
(6)
is the specific heat at constant pressure for moist air, and L={
L, T>O"C L, = L, Lf T I 0°C
+
(7)
where L,, is latent heat of vaporization and LI is latent heat of fusion, Pgc,is the initiation rate of cloud water (ice), Pa,,is the autoconversion rate of cloud droplets (ice crystal) to raindrops (snow), Pa,, is the accretion rate of cloud droplets (ice crystals) by raindrops (snow), Peed is the evaporation (deposition/sublimation)rate of cloud water (ice), Pred is the evaporation (deposition/sublimation) rate of rainwater (snow), and t',is the mass-weighted mean terminal velocity of raindrops (snow), and FCON, FpBL, FHD, and F v D are the tendency operators for parameterized moist convection, the PBL effect, horizontal diffusion, and vertical diffusion, respectively, and all other variables assume their usual meanings. The term with the parameter 6 in eq. (4) denotes the freezing (melting) of liquid water (ice particles) when u < O ( u > O ) , and the melting of snow fallouts when they fall through the 0°C isotherm. The specific formulations for the microphysics parameterization in the explicit convective scheme are given in the Appendix. It should be noted that the implicit and explicit schemes are operating simultaneously in this model to account for the separate effects of
136
DA-LIN ZHANG
subgrid-scale and mesoscale convection. For the convenience of model description, the explicit convective scheme computes “stratiform” or resolvable-scale precipitation which is generated within a saturated atmosphere (i.e., 100% relative humidity), whereas the implicit convective schemes obtain parameterized convective precipitations which forms in a conditionally unstable and favorably forced but not necessarily saturated environment. As discussed by Zhang et al. (1988), the simultaneous incorporation of implicit and explicit convective schemes (termed “the full physics approach”) does not double account for either resolvable-scale or subgrid-scale heating and moistening, since explicit convective schemes neglect subgrid eddy fluxes that implicit convective schemes handle. Zhang et al. (1988) showed that the full physics method appears to be the best approach to handling convective and stratiform precipitation in nature. Although the cloud water (ice) and rainwater (snow) are not explicitly present in the implicit convective schemes, the present approach does not produce any notable discontinuity in the model dynamics and thermodynamics when the model rainfall switches from convective to stratiform mode, or vice versa (see discussion in Zhang et al., 1988). However, the incorporation of cloud water (ice) and rainwater (snow) may affect the profiles of parameterized heating and moistening.
3. Results There are two types of MCSs involved in the 1920 July 1977 Johnstown flood events: a convective squall line and a meso-8 scale vortex which is embedded in a mesoscale convective complex (MCC, see Maddox, 1980 for its definition). Hoxit etal. (1978), BosartandSanders(1981),Zhangand Fritsch (1986a) and Zhang and Fritsch (1987) provided a detailed description for the case study of the Johnstown MCSs. Since the squall line produced little resolvable-scale condensation/precipitation and since implicit convective heating has a much less important effect on the development of the mesovortex than resolvablescale heating, only the mesovortex and associated resolvable-scale diabatic heating will be emphasized in this paper.
Fig. 1. Analysis of sea-level pressure (mb) from Exp. CTR (control simulation without ice microphysics) for (a) 1800 GMT and (b) oo00 GMT. (c) Predicted 12 h accumulated total rainfall (mm) for the period 1200 GMT 19 to OOO GMT 20 July 1977.
Tellus 41A (1989). 2
EFFECT OF PARAMETERIZED ICE MICROPHYSICS ON THE SIMULATION OF VORTEX CIRCULATION
As shown in Zhang and Fritsch (1986b, 1987), the Johnstown mesovortex initiates from a nearly saturated and moist adiabatic environment over Lake Erie in combination with a centralized lifting from a midtropospheric meso-a scale short wave near the model initial time (i.e., 1200 G M T 19 July 1977). As it propagates east-southeastward towards central Pennsylvania, it quickly intensifies with a mesolow pressure extended from the midtroposphere down to the surface around 0000 G M T 20 July (see Figs. 15-18 in Zhang and Fritsch, 1986a and Fig. 1 in Zhang and Fritsch, 1987). The vortex at the mature stage exhibits a closed cyclonic wind circulation in the low- to midtroposphere and an anticyclonic outflow near the tropopause. Its maximum vorticity occurs between 850 and 700 mb. The thermal structure of the vortex is characterized by a pool of cool moist downdraft air from the surface to 850 m b beneath its midtropospheric warm core, and a cold dome in the vicinity of the tropopause above the warm core. The warm-core structure results from the surplus of latent heat release over the adiabatic cooling and horizontal energy dispersion and is responsible for the initial concentration of cyclonic vorticity through the geostrophic adjustment processes. In the decaying stage, the warm-core vortex is primarily maintained by inertial stability of the cyclonic circulation. The vortex drops a significant amount of stratiform rainfall along its path (Zhang and Fritsch, 1987). The observed 12 h local maximum rainfall over northwestern Pennsylvania is more than 100 mm (see Hoxit et al., 1978; Zhang and Fritsch, 1986a). Although Zhang and Fritsch (1986a) reproduced extremely well the development and evolution of the mesovortex and associated convective weather systems, its strength and associated rainfall amount were overpredicted due to the relatively poor control of the CISK-like instability. Later, by incorporating hydrostatic water loading and evaporative cooling, Zhang et al. (1988) significantly improved the simulation of the vortex strength, accumulated rainfall and associated MCSs, as compared with the observational analyses of Hoxit et al. (1978) and Bosart and Sanders (1981). In the next subsection, this simulation (see Fig. 1) will be utilized as a control run (Exp. CTR) for the purpose of investigating the r81e of ice-phase microphysics in the simulation of the Johnstown mesovortex. Tellus 41A (1989), 2
137
Then, in subsection 3.2, individual effects of the parameterized ice microphysics will be examined.
~~
Fig. 2. As in Fig. 1 but for Exp. ICE (with full ice microphysics).
138
DA-LIN ZHANG
3.1. The effkct of jull ice microphysics By incorporating ice microphysics into the explicit convective scheme used for Exp. C T R (Exp. ICE, see Fig. 2), the vortex-related sea-level pressure perturbation at 1800 G M T becomes less significant and the major mesolow at 0000 G M T is about 1 mb weaker than that in Exp. C T R (cf. Figs. 1b and 2b, and see Table 1). Note that since the distribution of model convection and associated temperature perturbation produced by the Fritsch-Chappell implicit convective scheme for all experimental simulations presented here are similar to that in Exp. CTR or in Zhang and Fritsch (1986a), only the domain-accumulated convective rainfall is given in Table 1 for the purpose of the intercomparisons. The appearance of a weak pressure perturbation during the development stage and a closed mesolow at the decaying stage is a characteristic feature of many midlatitude mesovortices (Hoxit et al., 1978; Zhang and Fritsch, 1986a; Rockwood et al., 1984; Johnson, 1986). and can be explained hydrostatically by the well-developed midtropospheric warm-core (or high-8, core) structure of the cyclonic circulation (see Figs. 7- 10 and 1 I in Zhang and Fritsch, 1987). Thus, the weaker mesolow in Exp. ICE implies that the cooling due to melting of ice particles compensated for freezing and sublimination effects, and reduced the mean temperatures in the air column beneath the 0°C isotherm. Numerous studies indicate that decreases in the magnitude of the resolvable-scale heating below 500 mb can have a
h
,I
'L
earlier triggering of the grid-scale condensation and additional latent heat release of fusion appear to have helped accelerate the positive feedback process among latent heat release, low-level moisture convergence and the surface pressure fall
'\\ \
040-
I
3 0
delay of'the resolcable-scale condensate production in meso- or larger-scale numerical weather prediction models could be improced by incorporating realistic ice microphysics into the model. Moreover, the
--_-
-
l-
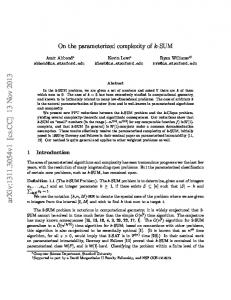
prominent effect on retarding the development of model cyclones (Anthes and Keyser, 1979; Gyakum, 1983; Sardie and Warner, 1983). Hence, the melting may be an important factor in weakening the mesovortex, and this will be examined in the next subsection. Another important effect of including ice microphysics is related to the timing of initiating the resolvable-scale condensation/precipitation. Fig. 3 shows that with the inclusion of ice microphysics, precipitation begins to develop and reaches its maximum rate nearly one hour earlier. As pointed out by Zhang et al. (1988), there is a common problem in the generation of resolvablescale condensation for meso- and larger-scale models, namely, an unrealistic delay in the start of the grid-box saturation. Although the control simulation exhibits little delay of the grid-scale condensation and rainfall conversion because of the initial near-saturated environment over Lake Erie, the extent and the number of grid boxes in which the condensation occurs during the initial two model hours are much less than that in Exp. ICE. Thus, the result appears to indicate that the
I I
\
\
\
,
. . . . . ,.,
M LT ICE FRZ
-
MODEL HOUR Fig. 3. The predicted hourly domain-integrated resolvable-scalerainfall rate (kg h-I) for individual experimental
simulations. Tellus 41A (1989), 2
EFFECT OF PARAMETERIZED ICE MICROPHYSICS ON THE SIMULATION OF VORTEX CIRCULATION
139
Table 1. Predicted 12-h domain-accumulated total rainfall volume of convective (Rcm), resolvable-scale (R,) and local maximum (RH); minimum sea-level pressure ( P L )pf the mesolow and local maximum vertical motion ( - w H for ) individual experimental simulations Code
Description of simulations
CTR a : ICE b: MLT c : FRZ d : SBM
no ice control full ice microphysics no melting no freezing no sublimation
4%
RC,"
kg) 2.76 2.36 2.41 2.26 2.24
that is responsible for the initial rapid development of the mesovortex. As a consequence, the local maximum upward motion ( - w) and accumulated rainfall in Exp. ICE are significantly larger than that in Exp. C T R (see Table 1). Notice that the rainfall rate in Exp. ICE quickly decreases after the sixth model hour. As will be shown in the next subsection, this can be attributed to the dominant r6le of melting in retarding the preceding-mentioned positive feedback process. Of particular interest is that although the hourly resolvable-scale rainfall rate during first 5.5 h (Fig. 3) and the maximum locally accumulated rainfall over northwestern Pennsylvania (Table 1) in Exp. ICE are much larger than that in Exp. CTR, the surface pressure perturbation at 1800 G M T is not as significant as that in Exp. CTR. The physical processes involved can be understood as follows. Since the lapse rate of an ice moist adiabat is larger than a liquid moist adiabat due to the additional latent heat release by fusion, an air parcel lifted by the mesoscale ascent within the nearly watersaturated vortex layers (see Fig. 8 in Zhang and Fritsch, 1987) will become less stable or unstable along the ice moist adiabat. This implies that vertical circulation will be enhanced, generally leading to augmented snow crystals or precipitation (cf. Figs. Ic, 2c). However, an increase in precipitable particles tends to not only enhance cooling due to the melting as more snow crystals fall through the 0°C isotherm but also increase the hydrostatic water loading effect, and thus retard the development of strong upward motion and cyclonic vorticity. The former point will be further discussed in the following paragraphs. As a result of a relatively weak mesovortex, the 12 h domain-accumulated rainfall associated with the mesovortex in Exp. ICE is about 20% less than that in Exp. C T R (see Table 1). Tellus 41A (1989). 2
RH
PL
-wi
(10" kg)
(mm)
(mb)
(pb s-I)
1.41 1.18 2.42 1.03 0.94
I17 140 202 I24 I18
101 1.4 1012.3 1007.5 1012.8 1013.0
215 243 324 198 185
In essence, the above-discussed differences can be attributed to the differences in the resolvablescale heating profile and in the response of the wind field to the perturbed mass field. Fig. 4 shows the pressure-time cross section of the maximum area-averaged (i.e., 9-point average around the vortex center) resolvable-scale diabatic heating rate (DT/Dt, "C h-l), vertical motion (-OMG, pb s-I) and relative vorticity (VOR, s-I) for Exps. ICE and CTR. Note that the hourly resolvable-scale heating rate profiles are obtained from their instantaneous values. The dashed lines denote the time evolu!ion of local maxima in the vertical. Several similarities between the left and right panels are worth mentioning first. For example, the maximum upward motion develops nearly in phase with the diabatic heating both in time and space. The development of the maximum cyclonic vorticity in lower levels and anticyclonic vorticity near the tropopause lags about two hours behind the maximum rate of diabatic heating. The maximum vorticity is also slightly out of phase in space with and to the rear of the maximum upward motion in the low- to mid-troposphere (see Zhang and Fritsch, 1987). The phase shift has also been noted in a numerical simulation of an observed front by Ross and Orlanski (1982). Furthermore, the 2- to 3-h lagging period was found to be an approximate time scale for the wind field to geostrophically adjust to the perturbed mass field in this particular case. Note also that the center of local maximum cyclonic vorticity is displaced downward as the mesovortex spins up as a result of an increase in the resolvable-scale heating rate or low- to mid-level moisture and mass convergence, and vice versa. The differences produced between these two simulations are of our primarily concern and can be briefly summarized as follows. Firstly, with the inclusion of ice microphysics parameterization, all
140
DA-LIN ZHANG
TIME
(h)
TIME
(h)
Fig. 4. The pressure-time cross section of the area-averaged (i.e., 9-point around the vortex center) resolvable-scale diabatic heating rate (DT/Dt, "C h-I), vertical motion (-OMG, pb s-I) and relative vorticity (VOR, s-l). Dashed lines denote the time evolution of local maxima. The left panel is for Exp. ICE (full ice microphysics) and the right panel is for Exp. CTR (control run without ice microphysics). Tellus 41A (1989). 2
EFFECT OF PARAMETERIZED ICE MICROPHYSICS ON THE SIMULATION OF VORTEX CIRCULATION
variables in Fig. 4 reach their maximum values one hour earlier, which is consistent with the evolution of the resolvable-scale rainfall rate. (The maximum rainfall rate lags half an hour behind the maximum diabatic heating). Secondly, the switch from saturation with respect to water to ice increased the maximum heating rate by 5°C h-l, and the maximum upward motion ( - w ) by 14 pb s-I whereas it unexpectedly reduced the maximum vorticity by 6 x 10⁻⁵ SKI. Moreover, the resolvable-scale rainfall during first six model hours increases considerably (see Fig. 3), but the surface pressure perturbation is less significant, as mentioned before. Thirdly and most importantly, the maximum values of all variables in Fig. 4 for Exp. ICE are shifted upward by more than 50 mb. As is well known, model cyclogenesis is very sensitive to the vertical location of the maximum heating (see Anthes and Keyser, 1979; Gyakum, 1983; Sardie and Warner, 1983; Zhang et al., 1988). Thus, such an upward shifting may be the major reason for why a relatively weak mesovortex but stronger upward motion and more locally accumulated rainfall develop in Exp. ICE. This result tends to suggest that the uertical distribution ofthe diabatic heating may be more important than the total amount of heating (i.e.,rainfall reaching the ground) in determining the strength of mesovortices (also see Fig. 3). Fourthly, all variables in Fig. 4 for Exp. ICE tend to decay faster than that in Exp. CTR after reached their maximum values, as can also be seen from Fig. 3 . This may reflect the importance of the melting in reducing the net convergence of high-0, air through dumping substantial amount of colder air mass into lower troposphere, thereby retarding the above-mentioned positive feedback process. In particular, the melting results in a near discontinuity in the diabatic heating profile around 600 mb where the 0°C isotherm is rougly located. The cooling rate is as large as 5°C h-l within a 50 m b layer depth. This is in agreement with the diagnostic calculation of cooling rate due to the melting effect by Leary and Houze (1979). 3.2. The ejects of melting..freezing and sublimation To gain more insight into individual effects of the ice-phase microphysics on the simulation of the Johnstown mesovortex, three additional experimental simulations are performed by suppressing certain aspects of the diabatic heating in eq. (4)
Tellus 41A (1989), 2
141
while holding all other conditions the same as Exp. ICE. For these three experimental simulations, the total rainfall distributions will not be shown in Figs. 5-7 since it is similar to that in Exp. ICE or Exp. CTR except for the magnitude of the resolvable-scale and parameterized convective rainfall which has been given in Table 1 and Fig. 3. When the melting of frozen particles and snow fallouts (Exp. MLT) was neglected from Exp. ICE, the strength of the mesovortex and associated rainfall were unrealistically too intense (see Fig. 5). Specifically, Table 1 shows that the minimum central pressure of the predicted mesolow is 4.7 m b deeper and the 12 h accumulated resolvable-scale rainfall more than doubles that in Exp. ICE. In addition, Fig. 3 displays a more rapid acceleration
Fig. 5. As in Figs. la and lb but for Exp. MLT (no melting effect).
142
DA-LIN ZHANG
of the resolvable-scale precipitation during first five model hours and a slower decay thereafter than that in Exp. ICE. As shown in Zhang et al. (1988), liquid water evaporation has little effect on the control of the CISK-like instability before 1800 G M T due to the development of the mesovortex in the nearly saturated environment. Thus, it appears that under nearly saturated conditions, melting can play a much more important r d e than the evaporative cooling in retarding the CISK-like instability and the intensification of the mesovortex. Furthermore, when comparing Exp. MLT with the experimental simulations presented in Zhang et al. (1988) for the same Johnstown MCSs, the neglect of the melting effect is as significant as the omission of hydrostatic water loading and liquid water evaporation in controlling the intensity of mesovortices. It is evident that the significant differences between Exps. ICE and MLT result from the difference in the lower tropospheric heating profile to which numerical models are most sensitive. When the liquid water is not allowed to freeze as it is advected through the 0°C isotherm by mesoscale ascent (Exp. FRZ), the model produced a mesovortex of the surface pressure 0.5 mb weaker than that in Exp. ICE and 1.4 m b weaker than that in Exp. CTR (see Fig. 6 and Table 1). The local strongest upward motion is also weaker. Nevertheless, the maximum locally accumulated rainfall is still larger than that in Exp. CTR, further suggesting that the magnitude of the resolvable-scale rainfall is not necessarily a good indicator for the intensity of mesovortices if the melting effect is included in a numerical model. The lower model's sensitivity to the freezing than the melting is more likely due to (1) the presence of significant cooling below the 0°C isotherm; (2) the Occurrence of the freezing one level above the melting in the model; and (3) the larger amount of ice particles available for melting than liquid water for freezing (i.e., certain amount of rainfall is generated above the 0°C isotherm without going through the freezing process). In addition, the lower-level drying and upper-level moistening by the parameterized convection tend to further enhance the effect of melting and reduce the effect of freezing. By turning off the fusion of sublimation effect (Exp. SBM) from Exp. ICE, namely, let L = L, in eq. (4) for T