system and into the effects performance management has on organizational results ( .... The strategy has to be translated into business unit plans, budgets .... Because of time and data availability limitations, only a limited number of indicators.
The effect of performance management on the organizational results of a bank
André A. de Waal Maastricht School of Management, The Netherlands Vincent Coevert Erasmus University Rotterdam, The Netherlands
-
Published in the International Journal of Productivity and Performance Management, August 2007 -
This paper was the winner of the Highly Commended Paper Award of the International Journal of Productivity and Performance Management 2008
1
Introduction In recent years many organisations have been busy implementing new or improved performance management systems. Recent research shows that the regular use of these systems leads to better organisational results (Ahn, 2001; Ittner et al., 2003; Lawson et al., 2001; Said et al., 2003; Sandt et al., 2001; Waal et al., 2004). There is however little knowledge about the actual mechanisms which cause the positive effects of performance management (Bourne et al., 2000; Bourne et al., 2005). This might be because a lot of research has gone into the design and implementation of a performance management system and into the effects performance management has on organizational results (see a.o. Schiemann and Lingle, 1999; Waal, 2002b; Stratton et al., 2005). There is however a scarcity of empirical case study work at organizations into the actual workings of performance management and the factors which actually cause the positive effects. Fortunately this issue has gotten more attention these past years and researchers are increasingly focussing on the factors which cause performance management to work (Malina and Selto, 2000; Vakkuri and Meklin, 2001; Neely et al., 2004).
This article follows this line of research by describing a study that explored the impact and working of a new performance management system in a branch of a bank. The article start with a overview of the case company and the reasons why it implemented a new performance management system called One Page Management. The theoretical foundation of the new system are discussed, after which a detailed discussion follows of the behavioural factors important for implementing performance management successfully. Then the research approach is described which is based on collecting performance data of the case company before and after introducing the new performance management system and on observing the results of actions taken by case company managers to improve the results in their responsibility areas. The effects of the new system are described for the two main divisions of the case company and an analysis is given of the causes for these effects. The paper ends with a discussion of the limitations and opportunities for further research.
2
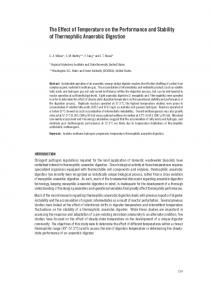
The bank The branch of the national bank1 consists of three divisions: Private Clients and Business Clients, both commercial divisions, and Corporate Organisational Management (Figure 1). The last division consists of the departments Management Control and Local Administrative Centre. Within the Private Clients division there are two departments, Financial Advice and Client Advice. Within the Business Clients division there are three departments, Corporate Advice, Business Relations and Credit Risk Management. There are approximately 50 employees working in the branch.
The Bank Branch
Board of Directors
Supervisory Board
General Director Corporate Organizational Management
Management Support
Management Control Business clients division
Private clients division
Credit Risk Management Corporate Advice
Local Administrative Centre
Financial Advice (FA) Business Relations Advice
FA 1
FA 2
Client Advice Planned Sales
Insurances
Client Service
Walk-in
Service Center
Figure 1: Organisational chart of the bank
The two commercial divisions report directly to the general director, who in turn reports to Corporate head-office. Each commercial division has its own manager who is a member of the management team, which is completed with the manager of the Corporate Organisational Management division. At the beginning of the year 2005 the management team felt the need for extra reporting on the performance of the Private Clients and Business Clients divisions. There were several problems with the current reporting: no concise monthly updates on the realisation of key performance indicators of the two divisions were available; there was not enough good quality information to be able for the commercial divisions to underwrite the obligatory ‘In Control statement’
1
On request the bank remains anonymous
3
every year in accordance with industry regulations; there were so many different reports on the results of the two commercial divisions that an accurate picture of the overall branch performance was not possible; and at the same time there was not enough tailored information to evaluate whether the bank’s strategy – “To offer as much value to customers by offering them the best financial service and continuity in this service” - was being achieved. The Management Control department was put in charge of creating an improved reporting structure. Preconditions were that, because of the scarcity of time that managers have, brief and easy monthly updates about performance should be created; and that each division would get its own performance scorecard which was to be put together on the basis of the currently available key performance indicators. This lead to the development of the so-called One Page Management (OPM) system which was introduced in March 2005.
One Page Management To be successful in the long run, an organisation strives for organisational fitness. Organisational fitness is defined as an organisation’s ability to adapt and survive in the ever-changing business environment and is achieved through natural evolution, purposeful change and continuous learning (Beer, 2003; Voelpel et al., 2004). To obtain organisational fitness, an organisation needs a clear and explicit management concept which is formulated by its most senior management (Bossert, 1993). This management concept is the basis for long-term development of the organisational strategy and the strategic objectives. The strategy has to be translated into business unit plans, budgets and operational action plans at the lower organisational levels. The management concept needs to be supported by an unambiguous and well-organized planning and control cycle. In this cycle, clear feedback is given on the execution of the plans by means of a management control and information system. Having an effective planning and control cycle and management control and information system is essential for business success. One Page Management (OPM) forms the heart of the management control and information system. It is based on three popular management models: steering on results, total quality management, and the balanced scorecard (Rigby, 2005). The steering on results model is based on the well-known Plan – Do – Check - Act (PDCA) management cycle. The INK management model is the Dutch version of the European Foundation of Quality Management model, which is a framework for conducting total quality management projects (Waal, 2002a). It consists of nine areas of
4
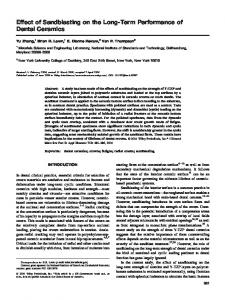
attention (Figure 2): four result areas (end results, customer satisfaction, employee satisfaction, appreciation of the society, and end results) and five enabler areas (leadership, strategy & policy, human resource management, resource management, and process management). In an INK diagnose it is determined how the organisation is performing in each area of attention and where improvements are needed. The feedback loop indicates that improvements are mainly made in the enabler areas on the basis of the results achieved in the result areas (Ahaus and Diepman, 1999).
Human Resource Management
Leadership
Strategy & Policy
Employee Satisfaction
Management of Processes
End Results
Customer Satisfaction
Appreciation of the Society
Resource Management
Feedback Enablers
Results
Figure 2: The INK management model
Managing the organisation on the basis of the INK management model has the following characteristics: it is based on the mission, strategy and policy of the organisation; there is attention for both results and efforts and for both the short and long term; there is a continuous focus on what is really important for the organisation; it is a continuous proves as the model requires frequent and regular re-evaluation; and implementing and using the model is a learning process of several years during which the organisation is constantly improved.
5
The balanced scorecard (BSC) gives managers a comprehensive view of the organization’s results and includes both process and results measures (Kaplan and Norton, 1996). The BSC is used to represent the financial and non-financial critical success factors (CSFs) and key performance indicators (KPIs) in a user-friendly format. Traditionally, a BSC consists of four ‘perspectives’. The innovative perspective measures how often an organization introduces new products, services or (production) techniques. By innovating, the organization makes sure it does not become complacent but continuously renews itself. Some organizations add ‘people’ factors to this perspective, which measure the well-being, commitment and competence of people in the organization. The internal perspective measures the effectiveness of the processes by which the organization creates value. It follows the innovative perspective because innovation and people influence the ability of the organization to create value by implementing and managing effective processes. The customer perspective measures performance in terms of how the customer experiences the value created by the organization. It follows the internal perspective, because efficient processes enable the organization to provide better service to its customers. The financial perspective measures the ‘bottom line’ of the organisation, such as growth, return on investment and other traditional measures of business performance. It follows the customer perspective because customer appreciation influences the financial results of the company. The financial perspective is the last of the four perspectives because it is the product of commitment, effective processes, renewal and innovation, and of value creation. Different organizations are likely to have different perspectives and indicators. A BSC however is universal in the sense that it combines lagging and leading indicators to give an understanding of where the organization was and where it is going.
One Page Management system combines elements of the three described models. It fulfils the check phase of the PDCA cycle by collecting, measuring, and reporting data. It focuses on the result areas of the INK management model. Most elements in the OPM are derived from the BSC. It uses CSFs and KPIs to measure the strategy and the main processes (like financing and mortgages) of the bank. It also depicts cause-effect relationships between different performance indicators. An example of such a relation is the one between the number of conversations with clients and sales. Without the conversations there would be no selling, so in order to keep the sales on par with the budget, these conversations are an essential effort. Finally just as in the BSC, OPM also
6
reports on financial and non-financial KPIs to accurately measure the performance of the two commercial divisions. All the elements are literally reported on one page. The appendix gives an abbreviated OPM scorecard for the Business Clients division. The scorecard has many different KPIs, like number of sales, number of sales conversations, and client satisfaction, for the various departments in the division. For every KPI there are three columns: Budget, Realisation, and Difference. These columns indicate whether the budget for the KPI has been achieved in the reporting month. If it has, the number in the ‘Difference’ column is coloured green, if not the colour is red. This type of representing performance is referred to as traffic light reporting, which makes it is possible for management to evaluate the performance of the division at a single glance. The graphs in the scorecard depict the performance for the KPIs throughout the year. The budget is linear lined from January to December, the dotted line shows the actual result.
After almost one and a half year of using OPM management wanted to know whether the introduction of this system had actually improved the performance of the divisions. Management especially was interested whether behavioural factors had played a role in getting employees more performance-driven. This question is a legitimate one as many authors state that in order to make a performance management system successful, i.e. it is regularly used by managers and results in improved organisational performance (Moriarty and Kennedy, 2002; Propper and Wilson, 2003; Said et al., 2003; Davis and Albright, 2004; Epstein, 2004; Marr et al., 2004), both the structure of the performance management system and the performance-driven behaviour of an organisation need to be of a high quality (Lipe and Salterio, 2000; Martins, 2000). Simons (1992) clearly states that performance management systems cannot be designed without taking into account human behavior. Recent research (Waal, 2002b) identified behavioural factors that are of importance to the success of a new performance management system because they have a positive influence on performance-driven behaviour. The term ‘behavioural factors’ is used here twofold: (1) for activities of organisational members that can be observed, and (2) for preconditions that allow organisational members to show certain behaviour. These behavioural factors are grouped into five categories, called areas of attention (see Table IV). These are the areas that an organisation needs to pay special attention to in order to improve the use of performance management by organisational members, and foster and stimulate performance-driven behaviour. The combination of OPM (the
7
structural side of performance management) and the behavioural factors (the behavioural side of performance management) should have a positive impact on the results of an organisation.
Research approach The approach for the research described in this paper can be characterised as descriptive and analysing, using a longitudinal case study. According to Burns and Scapens (2000) a longitudinal case study allows for an opportunity to explore the processes of change (how the various factors interact in a given context to produce a trajectory of change), often in the form of an evolutionary process. Eventually the evolutionary aspect should imply that the OPM could have a long lasting effect on the results. The entities investigated were the financial and non-financial results on KPIs of the commercial divisions, before and after the implementation of OPM. The research matches the profile of an explanatory case study, because causal links between the implementation of OPM and improvement of organizational results were uncovered. The research itself consisted of four phases. In the first phase, literature research was undertaken and the results were matched with the structure and composition of OPM. During phase two, a quantitative analysis of the results of the two commercial divisions was made. This analysis consisted of gathering historical date for the KPIs in the OPM scorecards. Because of time and data availability limitations, only a limited number of indicators were investigated for each commercial division, over the period January 2004 until May 2006. The choice for the specific KPIs was made after consulting with the divisional managers who stated that these particular indicators were most important for their steering of the divisions. The data was analysed and put into graphs to visualise the historical development of the performance on these KPIs. Also the moments when the OPM scorecards were introduced at the divisions were identified. After this, the development of the KPI results was matched with the introduction of OPM, to identify whether the new system had influence on the performance of the divisions. During phase three, a qualitative analysis of the results of the two commercial divisions was made. This was done by interviewing the managers of the Private Clients and the Business Clients divisions. These managers are the ones who could give the best analyses of the results of their own division. The research findings were regularly verified with other members of the organisation. Answers given by the managers on questions in the interviews were also randomly submitted to employees of the divisions
8
in order to verify them where possible, to check whether they experience the style of leadership in the same way their managers describes it. The interviews contained open questions on the manner the managers use OPM as a performance management system and its influence on the KPI results, and on any external or other internal factors which may have influenced the results on the KPIs. The interviews can be typified as a qualitative review of the quantitative analyses of the performance on the KPIs. The research of Waal (2002b) on behavioural factors that influence the success of performance management was used to determine the influence of OPM on the behaviour of managers and on the subsequent performance of the divisions. Finally, in phase four conclusions were drawn and recommendations were made. In the next two section the results for the two divisions are discussed.
Results for the Private Clients division The strategy for the Private Clients division is focused on maintaining market share and gaining more penetration at current private customers. This translates in a focus on keeping current private customers at the bank and selling more and different products (services) to these customers. The main product of the division is mortgages, which can be very lucrative, not least because a lot of cross-selling can take place at the time a mortgage is closed. However, heavy competition is expected in this market in the coming years. Main activity in the division is bank advisors having conversations with customers. Without these conversations there would be no selling at all, so the more sales conversations an adviser has, in potential the more sales he can make. The three main KPIs for the Private Clients division are: Amount of Mortgages Sold, Total Products Sold, and Number of Conversations with Private Clients. As the business of the Private Clients division is dependant on the number of advisors, the results for these three KPIs have been normalised to the number of full-time equivalents (FTE) of 2005 which was 3,0. This means that the data for 2004 (3,7 FTE) was recalculated be dividing by 3,7 and multiplying by 3; for 2006 (2,5 FTE) the recalculation was to divide by 2,5 and multiply by 3. Table I 3 gives the normalised results for the three KPIs, accumulated for each year. Figures 3 to 5 give schematic representations of the data.
9
Mortgages
Sold
(€1000)
Products
Sold
(no.)
Conver
sations
(no.)
2004
2005
2006
2004
2005
2006
2004
2005
2006
January
3178
5995
5185
84
102
145
69
96
137
February
8651
9701
8677
162
205
239
135
191
238
March
12287
13947
14681
245
307
371
224
287
367
April
15130
19649
20377
300
444
475
257
376
481
May
17591
24591
33174
349
591
620
298
425
574
June
19734
28924
426
655
365
467
July
22168
32812
504
708
417
490
August
24103
37875
582
812
473
615
September
27806
42629
679
873
557
720
October
30019
47037
782
920
641
793
November
33158
53693
888
1172
735
994
December
38865
58096
980
1196
803
1068
Month
Table I: Normalised results for the three main KPIs of the Private Clients division, for the period January 2004 – May 2006
Private Clients Division – KPI: Amount of Mortgages Sold (in €) 7000 0 6000 0 5000 0 4000 0 3000 0 2000 0 1000 0
0 ja n
fe b
mc h
ap r 2004
ma y
ju n 2005
ju l
au g
se p
oc t
no v
de c
2006
Figure 3: Normalised results for the Amount of Mortgages Sold, January 2004 – May 2006
10
Private Clients Division – KPI: Total Products Sold (in no.) 140 0 120 0 100 0 80 0 60 0 40 0 20 0 0 jan
feb
mc h
apr
ma y
2004
jun
jul
aug
2005
sep
oct
nov
dec
2006
Figure 4: Normalised results for the Number of Products Sold, January 2004 – May 2006
Private Clients division – KPI: Number of Conversations with Private clients
120 0 100 0 80 0 60 0 40 0 20 0 0 jan
feb
mch
apr
2004
may
jun
jul
2005
aug
sep
oct
nov
dec
2006
Figure 5: Normalised results for the Number of Conversations with Private Clients, January 2004 – May 2006
From the schematic depictions in Figures 3 to 5 it can be seen that for all three KPIs from March 2005 onwards a boost in results took place, an improvement in performance that has not only been sustained but increased every year. The OPM system was introduced in … March 2005. Whether there is a relation between this event and the improved results was discussed with the manager of the division. He stated he uses the system for two main purposes: as an information system for steering purposes, the OPM scorecard 11
gives him a brief monthly update on the position of the division compared to the stated performance goals; and as a stimulator towards the employees, the OPM scorecard confronts employees in a graphic way with the results they achieved and focuses them on the activities needed to be performed to improve the divisional KPIs. According to the divisional manager, OPM did not create a new culture, because a selling culture was already present within the division. However, OPM did sharpen the existing culture, it was an extra push in the right direction: “OPM did not give an impulse for a course change but it gave an impulse for a course acceleration!” The manager applied OPM as a stimulator towards his employees by setting individual KPI targets for them, which were aligned with the KPIs in the OPM scorecard. This way, the employees started automatically to feel responsible not only for their own results but also for those of the division. The targets for the individual KPIs were set in consultation with the employees, which can be described as combining top-down and bottom-up goal-setting. This process was chosen by the divisional manager to make employees feel more involved in the target-setting process, thereby increasing their motivation for achieving these goals. During the verification of the answers given by the divisional manager, the employees agreed with the fact that there is no new selling culture, but they did not describe this as a sharpened culture. Instead they were of the opinion that now the style of measuring performance differed, a difference which made them feel more responsible for divisional results. The employees saw OPM, and thereby performance management, as a chance to improve their own results and earn not only more salary, but also get more satisfaction from their work. The latter was caused by the fact that they now got more frequent and better quality feedback.
The divisional manager remarked there were no other internal factors but several external factors that had a positive influence on divisional performance in the period studied, like the low interest rates from the end of 2004 until now so that more mortgages could be sold; more competition on the market, which forced the bank to stay sharp; and better support from Corporate. However, these factors only had a minor influence according to him, the main improvement factor was the introduction of OPM. Both the manager and the employees agreed that OPM enticed increased performance by creating more focus on performance, by providing better steering possibilities though more frequent reports on performance, and by enticing better performance-driven behaviour.
12
Results for the Business Clients division Just as in the Private Clients division, the strategy for the Business Clients division is focused on maintaining market share and gaining more penetration at current business customers. This translates in the motto: “Scoring by deepening our relation with current customers” and in a focus on keeping current business customers at the bank and selling more and different products (services) to these customers. The core business for the division is financing, so the focus for selling is also in this area. The cross-selling of insurance products has in recent years also become an important source of revenue. The two main KPIs for the Business Clients division are: Business Financing, the total amount of financing provided to companies; and Commission Earned, this is the commission which is earned when insurance products are sold. As the number of advisors in the Business Clients division did not vary over the years investigated, no normalisation of the results took place. Table II gives the results for the two KPIs, accumulated for each year. Figures 6 and 7 give schematic representations of the data.
Business
Financing
(€1000)
Products
2004
2005
2006
2004
2005
2006
January
2460
38000
7565
235903
278946
322000
February
6650
42000
23116
239486
282887
323079
March
8892
45757
32968
247495
284620
313302
April
11482
50916
44076
253858
290466
313029
May
35850
56318
45936
257254
296278
316830
June
36425
65258
260050
298243
July
39892
66864
261192
300729
August
44114
69093
263204
305272
September
52241
73801
267597
307490
October
53130
75954
269060
311402
November
55205
82395
272630
314206
December
58435
99873
276324
318367
Month
Sold
(no.)
Table II: Results for the two main KPIs of the Business Clients division, for the period January 2004 – May 2006
13
Business Clients division – KPI: Business Financing (in €) 120000 100000 80000 60000 40000 20000 0 jan
feb
mar
apr
may
2004
jun
jul
2005
aug
sep
oct
nov
dec
2006
Figure 6: Results for the Amount of Business Financing, January 2004 – May 2006
Business Clients division – KPI: Business Financing (in €) 120000 100000 80000 60000 40000 20000 0 jan
feb
mar
apr 2004
may
jun 2005
jul
aug
sep
oct
nov
dec
2006
Figure 7: Results for the Commission Earned, January 2004 – May 2006
As can be seen in Figure 6, there was a jump in Financing in April 2004. This jump set the level of financing not only for the remainder of 2004 but also for 2005 which was a good year. The graphic representation also shows that the inclination of the growth lines for these years is similar, meaning the growth rate was virtually the same. Unfortunately, in 2006 the financing level went down compared with the previous year. 14
The KPI Commission Earned is measured in a different manner than the other KPIs: it is customary in the industry to measure this as a cumulative continuous amount, as can be seen in Figure 7. So the year-to-year comparison shows each consecutive year to be higher than the previous year. However, the inclination of the growth lines for these years is similar, meaning the growth rate was virtually the same.
In contrast with the Private Clients division, neither graphs for the Business Clients division show a break-point when OPM was introduced in March 2006, implying that the new system did not have a noticeable effect in this division. Why this is, was discussed with the manager of the Business Clients division. The manager stated that OPM had no significant effect on the divisional KPIs results but that other factors did play a role in the gradual performance improvement, like better co-operation between the departments in the division, a specific focus on acquisitions to create a bigger portfolio, and newly introduced selling methods. The only benefit the manager got from the OPM scorecard was better management information for more adequate steering and a better focus on the most important KPIS of the division. However, the manager added that the results on his KPIs would not have been any different if OPM was not introduced. After further questioning, it turned out that the manager only used OPM as a reporting system towards the management team of the bank. He did not use it to stimulate employees to focus on the divisional KPIs, and the employees did not have access to the OPM scorecard. The reason for this was that the manager considered much of the information in the scorecard to be unreliable. Much of the performance information for the Business Clients division originated from the information department at Corporate, and this department had thus far not been able to provide high-quality input on time for the OPM scorecard. Cause of this was that the management information for the Business Clients divisions in the local branches was still in a developing phase at Corporate. The manager believed that the resulting false representation of divisional performance would have a negative effect on the motivation of his employees. The consequence of this was that the introduction of OPM had not changed the culture in the Business Clients division because only the divisional manager used it (in a limited way). Another consequence was that employees from sheer necessity kept their own register of sales and conversations with clients, registers which were used in different ways by different people creating a diffuse performance culture in the division.
15
Analysis: Private Clients versus Business Clients The striking issue in this case is the different effects the introduction of OPM had in the two commercial divisions of the bank branch. There are some similarities to be noted, like the facts that for both divisional managers OPM created better steering possibilities by reporting on performance on a monthly basis, and that both managers themselves experienced a better focus on KPIs by using the new system. At the same time, there are differences, like the facts that OPM was used by employees of the Private Clients division and not by those of the Business Clients division, a bigger focus on performance-driven behaviour in the Private Clients division, and a considerable and step-wise improvement in the results of the Private Clients division while there was only a gradual performance improvement in the Business Clients division. As OPM was introduced at the same time, in the same way, and with the same set-up in both divisions, it seems reasonable to state that the technical side of the implementation cannot be the cause for the different outcome at the divisions. The reason has to be in the way the system was used. To analyse this use, the criteria for regular use of a performance management system are applied (Waal, 2003). These criteria denote whether use of the performance management system is valuable to an organization and its managers. The criteria are a mix of tangible and intangible benefits but focus more on the intangibles (Mooraj et al., 1999). The assumption is that a successful implementation is achieved when the managers have an intensified awareness of the importance of the performance management system and that the new system has been embedded in the organization’s planning and control cycle, with periodic reporting and discussion (Lewy and Du Mée, 1998). Table III shows the degree to which the commercial divisions satisfy the criteria.
The degree of OPM use in the Private Clients division has increased steadily: the scorecard is invariably communicated and discussed monthly in the division. OPM has stimulated both the divisional manager and employees to keep improving the CSFs and KPIs, and it has become the formal monthly management reporting mechanism in the division. The degree of OPM use in the Business Clients division has increased somewhat but only with the divisional manager, and then in an informal way. OPM has not been used to communicate performance results within the division.
16
Criteria for Regular Use
Private
Business
Are the results of the organization, according to managers, improved through the use of OPM?
Yes
No
Are the results of the organization, objectively, improved through use of OPM?
Yes
No
Has the degree of OPM use in time by divisional managers and employees increased?
Yes
No
Are there plans for follow-up projects?
Yes
Yes
Is there a difference in manager and employee attitude toward performance management, from project start to currently?
Yes
Yes
Is there regular communication about the KPI results in OPM?
Yes
No
Is OPM incorporated in the regular management reporting?
Yes
No
Table III: The criteria for regular use of OPM, for the Private Clients and Business Clients divisions
The behavioural factors that are of influence on the success of a new performance management system can shed more light on the difference in use of OPM (Waal, 2003). These factors were discussed in one-to-one conversations with the manager and four randomly selected employees of each of the commercial divisions. On the basis of their answers Table IV indicates which behavioural factors were taken into account during the implementation and use of OPM at the divisions.
Behavioural factors 1. Organisational members understand the meaning of performance management, so they have an insight into the (possible) consequences that their actions have on organisational results.
Private Yes
1
Business Yes 1
2. Organisational members have insight into the relationship between business processes and OPM, so they understand that the results they achieve on their KPIs are important to the continuity of the division.
Yes
No
3. Organisational members’ frames of reference contain similar KPIs, so they can compare their results to those of other members and obtain insight into how they are doing comparatively.
Yes
Yes
4. Organisational members agree on changes in OPM so they keep on feeling responsible for the results they achieve.
No 2
No
5. Organisational members’ results are openly communicated, so everyone is aware of the status of the organisation and performance knowledge can be shared.
Yes
6. Organisational members recognise and acknowledge the need for performance management, which makes them willing to cooperate during the implementation of OPM. 7. Organisational members agree on the starting time, which makes them willing to cooperate from the start of the implementation of OPM. 8. Organisational members have earlier positive experiences with performance management, so they can communicate the aim and goals of OPM to the organisation.
Yes
3
Yes Yes
4
2
No
No
No Yes 4
17
Behavioural factors
Private
Business
9. Organisational members realise the importance of performance management to their performance, so OPM becomes part of their daily activities.
Yes
No
10. Organisational members do not experience performance management as threatening, so they are not hesitant to use OPM.
No 5
11. Organisational members’ KPIs measure their responsibility areas, so they can be used for steering and control of those areas.
Yes
12. Organisational members can influence the KPIs assigned to them, so the acceptance and use of OPM is increased.
Yes
No
No
6
13. Organisational members prepare their own analyses, which increases the acceptance of those analyses.
Yes
14. Organisational members find the quality of the analyses good, which increases the use of those analyses.
Yes
15. Organisational members can use their the KPIs for managing their employees, which increases regular use of OPM.
Yes
5
No No No
7
No
16. Organisational members are stimulated to improve their performance by using OPM, so they do not have to be afraid performance management will be used to punish lagging results.
No 8
No
8
17. Organisational members trust the performance information, which increases the acceptance of OPM.
Yes
No
9
18. Organisational members clearly see (top) management using OPM, so they understand the importance of the system to management and the organisation.
Yes
19. Organisational members find OPM relevant because it has a clear internal control purpose, and can therefore support their activities well.
Yes
20. Organisational members find OPM relevant because only those stakeholders’ interests that are important to the organisation’s success are incorporated, so the system stays aimed at the continuity of the organisation.
1
Individual performance is linked to departmental performance.
2
Changes in the KPIs have lead to resistance in the past.
No 11
No
No
10
Yes 12
3
Employees like the feedback on their results.
4
In a limited way.
5
Employees do feel somewhat threatened by performance management because of experiences in the past.
6
The employees are involved in setting the targets.
7
The scorecards are not of enough quality to make good analyses.
8
Good performance means a bonus, but bad performance can lead to lowering of the standard salary.
9
The information department of Corporate does not deliver all information in reliable form yet.
10
Because of the unreliability of the management information, the employees do not use OPM as the internal control instrument.
11
OPM does not have a link with stakeholders.
12
The clients of the Business Client division are companies who have different stakeholders. The advisors have to consider these stakeholders when dealing with their clients.
Table IV: Behavioural factors at the banks’ Private Clients and Business Clients divisions
18
The assumption behind Table IV is that the more behavioural factors are taken into account during the implementation and use of a performance management system, the higher the chance is on a successful system, meaning a system which is used regularly and improves the results of the organisation (Waal, 2007). As can be seen from the table, the Private Clients division satisfies 16 of the 20 factors, while the Business Clients division only meets four factors. It seems reasonable to assume that the main reason for the difference in the effect OPM has had on the results of the divisions is mainly due to the lack of attention the divisional manager of the Business Clients division paid to the behavioural factors. A similar result has been found by Waal (2006) in another case study at two divisions of an oil company. The mentioned lack of attention mainly manifests itself in not opening up the system to the employees in the division. As a consequence of this, the divisional employees cannot help to create a performancedriven culture in the division which means there is a lack of focus on continuously improving divisional results. The reason given by the manager of the Business Clients division for not sharing OPM with his employees is the unreliability of the data in the scorecard. However, it seems the disadvantage of this unreliability is overshadowed by not sharing any data at all, so the recommendation to the manager is to introduce OPM as soon as possible to his employees. Any KPIs for which data cannot be determined in a reliable way, can for the time being be left out of the OPM scorecard. The aim of the introduction is to create the same performance effects as in the Private Clients division.
Summary and recommendations The Private Clients division experienced several positive changes after the introduction of OPM: the selling of mortgages got an impulse in March 2005 when the new system was introduced and this impulse has continued, performance in 2006 seems to develop better than 2005. The number of products sold and the number of conversations with clients have also improved. OPM created better steering possibilities for the divisional manager on a monthly basis and according to him the system has had a positive influence of the awareness of and focus on performance by the employees. As a result of this, OPM sharpened the selling culture within the department. The manager of the Private Clients division approached the challenge of improving performance by focussing on the KPIs in OPM, which are in line with the strategy of the organisation. This approach has proven to be successful in the investigated period, from January 2004 until May 2006. Almost all behavioural aspects (Waal, 2002) apply to the employees of
19
the Private Clients division, and after verifying these aspects with the employees it appears that OPM is indeed working positively on the performance driven behaviour of the manager and the employees themselves.
In the Business Clients division, OPM created better steering possibilities for the manager on a monthly basis. However, OPM was not presented yet to the employees within the division who therefore often make their own register of sales and conversations. The KPIs of the division have shown reasonable results but these results have not, according to the divisional manager, been positively influenced by OPM. The Business Clients division does not apply many of the behavioural aspects that are of influence on the success of performance management.
When comparing the results of OPM in the two divisions it seems clear the main difference can be detected in the way the new system was applied by the managers. Both managers did use OPM to obtain better steering possibilities by reporting on performance on a monthly basis, and both managers have experienced that their focus on measurable KPIs has improved by using the OPM scorecards. Performance-driven behaviour of employees was fostered by the manager of the Private Clients division by letting them use the OPM, but not by the manager of the Business Clients division. As a result, performance has improved since the introduction of OPM in the Private Clients division, and the system is evolving towards a commercial scorecard, a steering mechanism and a stimulating instrument. At the same time, in the Business Clients division OPM is more just a steering mechanism rather than an instrument to increase performance-driven behaviour.
The case study results support the findings in recent literature that implementing a performance management system increases organisational results but that certain conditions have to be satisfied to actually achieve this benefit. The case study results support the findings of Waal (2002b) that one of these conditions has to do with behavioural factors, in this case the manner in which the divisional manager applied performance management and enticed his people in using the new system. In the words of De Smet et al. (2001): “The manager indeed makes the difference!” The implication is that further research into management styles of managers is recommended to strengthen the application of performance management systems.
20
The main recommendation to the management team of the bank deals with assuring that OPM will stay a success on the long run so the bank can keep improving its performance. The managers of both commercial divisions should try to get their employees to comply with the behavioural factors as much as possible. The fact that the performance-driven behaviour of employees at the Private Clients division has improved considerably, as well as this division’s results, clearly indicates that complying with the behavioural factors makes the difference. The manager of the Business Clients division should therefore immediately introduce OPM to his employees. If there are KPIs whose data cannot be determined in a reliable way, the manager can decide to leave these out of the OPM scorecard. OPM should be further introduced at all units of the bank. This way the total management control process can be performed using the same system. Finally, the performance on the KPIs in the OPM scorecards should be continuously measured and compared with the past, to create benchmarking possibilities for the years to come.
Limitations and further research The research described in this article has several limitations. The main limitation is that the research concerns a case study in which only one organisation has been subject of investigation. Whether OPM can work and will have the same performance effects in other organisations can therefore not be derived from the results of this research. Also, the branch of the bank is relatively small which makes it unclear whether OPM will work in large organisations. A consequence of the relatively small size of the organisation is that the divisional manager manages his employees on an operational level. This is an advantage because he can directly see developments in motivation of the people in regard to performance management and OPM. At the same time it also is a disadvantage because he does not have a clear and objective top-down view, being involved in day-to-day operational tasks. This dual focus might have influenced the answers the divisional managers gave during the interviews, causing confusion in whether they were talking about strategical or operational issues. Another limitation is that it is always difficult to isolate the effects of one management technique on the overall results of an organisation. Although the users of OPM (the divisional managers)
21
clearly state no other techniques were applied or projects were undertaken which could have an effect, it can never be completely ruled out other factors are in play.
Further research possibilities consist of evaluating the effects of introducing OPM on a wide scale in the Business Clients division, evaluating the longer-term performance of the Private Clients division, introducing OPM at other branches of the bank (especially in the larger ones) and studying the performance effects, and introducing OPM at other organizations in other industries, to gauge whether the performance effects of performance management, and specifically OPM, can be transferred to other surroundings.
References Ahn, H. (2001), “Applying the balanced scorecard concept: an experience report“, Long Range Planning, Vol 34, pp. 441-461 Ahaus, C.T.B. and F.J. Diepman (1999) Balanced Score Card & Model Nederlandse Kwaliteit, first edition, Kluwer, Deventer Beer, M. (1997), Why management research findings are unimplementable: an action science perspective. Working paper, Harvard University Beer, M. (2003), “Building organisational fitness”. In: S. Chowdhry (ed.), Organisations 21C, Financial Times Prentice Hall, NJ Bossert, J. (1993), “De organisatie van besturingsprocessen, een exploratief onderzoek naar de vormgeving van besturingssystemen” [transl.: The organisation of management control processes, explorative research into the design of management control systems], PhD dissertation, Vrije Universiteit Amsterdam Bourne, M., Mills, J., Wilcox, M., Neely, A. and Platts, K. (2000) “Designing, implementing and updating performance measurement systems”, International Journal of Operations & Production Management, Vol 20 No 7, pp. 754-771 Bourne, M., Kennerley, M. and Franco-Santos, M. (2005) “Managing through measures: a study of impact on performance”, Journal of Manufacturing Technology Management, Vol 16 No 4, pp. 373-395 Burns, J. and R.W. Scapens (2000), “Conceptualising management accounting change: an institutional framework”, Management Accounting Research, 11(1): 3–25
22
Davis, S. and T. Albright (2004), “An investigation of the effect of balanced scorecard implementation on financial performance”, Management Accounting Research 15: 135-153 Epstein, M.J. (2004), “The drivers and measures of success in high performance organizations”. In: Epstein, M.J. and J.F. Manzoni (eds), “Performance measurement and management control: superior organizational performance”, Studies in managerial and financial accounting, volume 14: 3-18 Ittner, C.D., Larcker D.F., and Randall, T. (2003) “Performance implications of strategic performance measurement in financial services firms”, Accounting, Organisations and Society, Vol 28 No 7-8, pp. 715-741 Kaplan, R. S. and Norton, D.P. (1996), The balanced scorecard, translating strategy into action, Harvard Business School Press, Boston, Mass. Lawson, R., Stratton, W. and Hatch, T. (2005) “Achieving strategy with scorecarding”, The Journal of Corporate Accounting & Finance, March/April, pp. 63-68 Lewy, C.P. and Du Mée, A.F. (1998) “In de kaart laten kijken, de tien geboden bij BSCimplementaties, versie 1.0” [transl. ’Show one’s cards, the ten commandments of BSC implementations, version 1.0’], Management Control & Accounting, Vol 2, pp. 32–37 Lipe, M.G. and S.E. Salterio (2000), “The balanced scorecard: judgmental effects of common and unique performance measures”, Accounting Review, 75, 3: 283–298 Malina, M.A. and Selto, F.M. (2000), “Communicating and controlling strategy: an empirical study of the effectiveness of the balanced scorecard”, Paper presented at the AAA Annual Conference, Philadelphia, August 13–16 Marr, B. (2004), Business performance management: current state of the art, Cranfield University & Hyperion Marr, B. and G. Schiuma, “Research challenges for corporate performance measurement: evidence from a citation analysis”. In: A. Neely, A. Walters & R. Austin (ed.), Performance Measurement and Management: Research and Action, Cranfield School of Management, UK (2002) Martins, R.A. (2000), “Use of performance measurement systems: some thoughts towards a comprehensive approach”. In: A. Neely (ed.), Performance measurement – past, present, and future, Centre for Business Performance, Cranfield University, Cranfield: 363–370 Mooraj, S., Oyon, D. and Hostettler, D. (1999) “The balanced scorecard: a necessary good or an unnecessary evil?”, European Management Journal, Vol 17 No 5, pp. 481–491
23
Moriarty, P. & D. Kennedy (2002) “Performance measurement in public sector services: problems and potential”. In: A. Neely, A. Walters & R. Austin (eds.), Performance Measurement and Management: Research and Action, Cranfield School of Management Neely, A., Kennerley, M. and Martinez, V. (2004) “Does the balanced scorecard work: an empirical investigation”. In Neely, A., Kennerly, M. and Waters, A. (ed.) Performance measurement and management: public and private, Centre for Business Performance, Cranfield University, Cranfield, pp. 763-770 Propper, C. and D. Wilson (2003), The use and usefulness of performance measures in the public sector, CMPO Working Paper Series, no. 03/073 (May) Rigby, D. (2005), Management Tools 2005, Bain & Company Said, A.A., HassabElnaby, H.R. and Wier, B. (2003) “An empirical investigation of the performance consequences of nonfinancial measures”, Journal of Management Accounting Research, Vol 15, pp. 193-223 Sandt, J., Schaeffer, U. and Weber, J. (2001) Balanced performance measurement systems and manager satisfaction, Otto Beisheim Graduate School of Management Schiemann, W.A. and Lingle, J.H. (1999), Bullseye! Hitting your strategic targets through high-impact measurement, The Free Press, New York Simons, R. (2000) Performance measurement and control systems for implementing strategy: text & cases, Prentice Hall, Upper Saddle River, NJ Smet, Y. de, Gelderman, M. and Waal, A. de (2001), “Control-stijl en het gebruik van de balanced scorecard” [transl. “Control style and use of the balanced scorecard”], Tijdschrift voor BedrijfsAdministratie, vol 1-2: pp. 18–24 Stratton, W., Lawson, R. and Hatch, T. (2005), “Achieving strategy with scorecarding”, Journal of Corporate Accounting & Finance, March/April Vakkuri, J. and Meklin, P. (2000), “The impact of culture on the use of performance measurement information in the university setting”, Management Decision, Vol 41, Issue 8, pp. 751-759 Voelpel, S.C., M. Leibold and K.M. Mahmoud (2004), “The organisational fitness navigator: enabling and measuring organisational fitness for rapid change”, Journal of Change Management, 4, 12: 123-140 Waal, A.A. de (2002a) Lexicon Prestatiemanagement, Kluwer, Deventer
24
Waal, A.A. de (2002b) The role of behavioural factors in the successful implementation and use of performance management systems, PhD thesis, Vrije Universiteit Amsterdam Waal, A.A. de (2003) “Behavioural factors important for the successful implementation and use of performance management systems”, Management Decision, Vol 41 No 8, pp. 110-122 Waal, A.A. de (2006) “The role of behavioral factors and national cultures in creating effective performance management systems”, Systemic Practice and Action Research, no. 3 Waal, A.A. de (2007) Strategic Performance Management, a Managerial and Behavioural Approach, Palgrave MacMillan, London Waal, A.A. de, Radnor, Z.J. and Akhmetova, D. (2004) “Performance-driven behaviour: a cross-country comparison”, in Neely, A., Kennerly, M. and Waters, A. (ed.) Performance measurement and management: public and private, Centre for Business Performance, Cranfield University, Cranfield, pp. 299-306
25
Appendix – The abbreviated OPM scorecard for the Business Clients division
Scorecard Business Clients division 200x - March
Department Business Advice
Budget
Actual
Difference
1
Number of Conversations with Clients
38
60
22
2
Number of Sales
38
31
-7
3
Number of Sales Conversions
31
40
9
4
Number of Referrals
7
6
-1
5
Client Satisfaction
3
3
0
Budget
Actual
Difference
Department Customer Relations 1
XXX
60
74
14
2
YYY
4583
28882
24299
3
ZZZ
1000
1278
278
26