In Proceedings of the SIGCHI Conference on Human Factors in Computing Systems - CHI, Montreal, Canada, 2006. Copyrighted material -- do not distribute.
The Effect of Speech Recognition Accuracy Rates on the Usefulness and Usability of Webcast Archives Cosmin Munteanu1
Ron Baecker1,2
Gerald Penn1,2
Elaine Toms3
David James1
[email protected] [email protected] [email protected] [email protected] [email protected] 1 ) Department of Computer Science 2 ) Knowledge Media Design Institute 3 ) Faculty of Management
University of Toronto Toronto, M5S 3G4, Canada
University of Toronto Toronto, M5S 2E4, Canada
Dalhousie University Halifax, B4H 4H8, Canada
ABSTRACT
The widespread availability of broadband connections has led to an increase in the use of Internet broadcasting (webcasting). Most webcasts are archived and accessed numerous times retrospectively. In the absence of transcripts of what was said, users have difficulty searching and scanning for specific topics. This research investigates user needs for transcription accuracy in webcast archives, and measures how the quality of transcripts affects user performance in a question-answering task, and how quality affects overall user experience. We tested 48 subjects in a within-subjects design under 4 conditions: perfect transcripts, transcripts with 25% Word Error Rate (WER), transcripts with 45% WER, and no transcript. Our data reveals that speech recognition accuracy linearly influences both user performance and experience, shows that transcripts with 45% WER are unsatisfactory, and suggests that transcripts having a WER of 25% or less would be useful and usable in webcast archives. Author Keywords
Webcast systems, Automatic speech recognition, Text transcripts, Navigational tools ACM Classification Keywords
H5.1 Multimedia Information Systems, H5.2 User interfaces INTRODUCTION
Recent years have witnessed an increase in the availability and affordability of broadband Internet connections. This has led to an increase in the use of Internet broadcasting [15]. For example, major media corporations offer newscasts, and universities deliver lectures through the Internet. Most such webcast media are archived after being delivered live, and can be accessed by users through interactive systems such as ePresence (http://epresence.tv/), illustrated in Figure 1, which serves as framework for this study (a review of webcast systems can be found in [2]). Permission to make digital or hard copies of all or part of this work for personal or classroom use is granted without fee provided that copies are not made or distributed for profit or commercial advantage and that copies bear this notice and the full citation on the first page. To copy otherwise, or republish, to post on servers or to redistribute to lists, requires prior specific permission and/or a fee. CHI 2006, April 22-27, 2006, Montr´eal, Qu´ebec, Canada. Copyright 2006 ACM 1-59593-178-3/06/0004. . . $5.00.
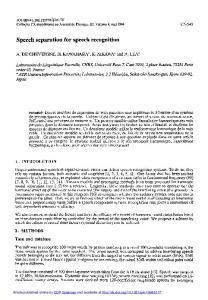
Figure 1. The transcript-enhanced ePresence system. In contrast with archives of text documents, video and audio archives pose some challenges to their users: • difficulty in retrieving a specific audio/video document from the archives, given a text query • difficulty in browsing and skimming through a large audio and video document In the absence of transcripts, humans are faced with increased difficulty in performing tasks that are easily achieved with text documents. For example, a user must listen to or watch a long recording in order to locate a specific passage, instead of quickly skimming through the content of a text document looking for visual landmarks and textual cues. This represents an important hurdle in making webcast archives the digital equivalent (from a user perspective) of libraries. Although various methods propose improved access to speech recordings [1,17], user studies [3] suggest that transcripts are a much-needed tool for carrying out complex tasks that require information seeking from webcast archives. Ideally, audio documents should be processed through an automatic speech recognition (ASR) system before being
(c) ACM, 2006. This is the authors version of the work. It is posted here by permission of ACM for your personal use. Not for redistribution. The definitive version is published in The Proceedings of the SIGCHI Conference on Human Factors in Computing Systems -- CHI 2006, http://doi.acm.org/10.1145/1124772.1124848
placed into the archive along with their transcriptions. Yet manual transcription is an expensive process. Replacing the transcription with a manually produced set of keywords is also not a solution. The human transcriber still must listen to the entire recording. The process does not always provide an acceptable solution, mostly because of the low rate of inter-annotator agreement [23]. Despite efforts to improve the quality of ASR systems, current ASR systems do not perform satisfactorily in domains such as transcribing lectures or conference presentations. This is caused by poor acoustic conditions, diverse speakers (with particular speech styles and various accents, including non-native), and large vocabularies (determined by the large pool of topics). In perfect conditions (anechoic room, slow speaking rate, limited vocabulary, ASR system previously trained on the same speaker), state-of-the-art systems can achieve a Word Error Rate (WER)1 of less than 3%. For less restricted domains with good acoustic conditions (such as broadcast news), the state-of-the-art WER is about 20-25% [4]. When acoustic conditions degrade (such as in lectures or conference talks), WER can increase to 40-45% [12], although some reports suggest a 20-30% WER for lectures given in more artificial and better controlled conditions [9, 16]. In our research, we have introduced manually and semi-automatically-generated transcripts into webcast archives, and are investigating the influence of WER on the usability and usefulness of these archives. We asked three research questions: • What is the relation between WER and the usability and usefulness of transcript-enhanced webcast archives? • What is the relation between WER and the webcast users’ experience? • What is the minimum level of WER for a transcript to be useful and accepted by users as a feature of webcast systems? Is the currently or near-future achievable WER for lectures good enough to warrant including transcripts into archives? To answer these questions, we designed an ecologically valid experiment, where users performed various tasks using a transcript-enhanced version of the ePresence webcast system. Figure 1 shows a screen capture of the system, with transcripts of 45% WER. ePresence is part of an ongoing research project that has the goal to make webcasting highly interactive, more engaging, and more accessible, and to make webcast archives more useful and usable. The ePresence system gives users full control of the archive, mainly through the display of the slides used in lectures and the video recording, through interaction with a table of contents (TOC – at the left of the screen, which 1 WER is defined as the edit distance (percentage of substituted, deleted, and inserted words) between the correct sentence and the output sentence from the ASR system [5]. While WER might not always be an adequate measure of transcript quality [25], it is widely used due to practical considerations. Thus, it was also our choice as a measure of ASR accuracy.
contains “chapter” headings and the title of the slides), and through the timeline (an interactive, clickable, fine-grained time-progress indicator). For our experiment, transcripts were added to the system. The lines were time-synchronized with the video, by boldfacing the current line of the transcript, thus emulating a closed captioning system, while fully displaying the transcript of the segment of lecture for the current slide. The line breaks do not represent ends of sentences, but rather correspond to pauses longer than 200ms. To further enhance the user’s control over the lecture, users can re-synchronize the playback of the video by clicking on a line in the transcript. RELATED WORK
As more media archives become available, research is starting to emerge on users’ strategies for navigating through such information-rich repositories. Studies on how archived webcasts are used [3], and on the effectiveness of navigational tools for webcast archives [21] provide clues as to how users access information in webcasts. Transcripts seem much needed to aid navigating through a webcast [3] or accessing information in spoken media [24]. Research is therefore needed to establish what is a satisfactory quality for archive transcripts, and to develop better ASR systems that deliver transcripts with lower WERs. Equally important, since ASR techniques that achieve close to 0% WER are not likely to be available in the near future [28], more studies are needed to understand users’ expectations from transcripts and to explore how imperfect transcripts should be integrated into a highly-interactive webcast system. Transcribing lecture/presentation speech is a research topic still in its infancy. The challenges met by the task of recognizing open-domain, speaker-independent, large-vocabulary, continuous, and noisy speech are very hard to overcome. While a significant amount of research effort have been spent on improving speech recognition for lectures and presentations [9, 12, 13, 16], the quality of the transcripts (typically WERs of 30-40%, at most 20% in particular conditions) is still below that for other domains, such as broadcast news transcriptions. For certain automated applications, where transcripts obtained through ASR are used by a machine (e.g. travel reservation systems such as ATIS [26]), a lower WER might not affect the system’s performance, as long as keywords are recognized accurately. However, when transcripts are to be used directly by humans, the overall quality of the text could be more critical. Unfortunately, the research that investigates how humans deal with error-ridden transcriptions and which accuracy rates can be deemed acceptable is scarce. One of the few existing studies of users needs with respect to the ASR accuracy sought to assess users perception of the improvements in recognition accuracy [22]. The result of a Wizard of Oz simulation showed that humans perceive differences in WER that are greater than 5-10% when asked to directly rate the quality of transcriptions. A previous study on handwriting recognition systems by the same authors [11] showed that users’ expectations of accuracy vary with how
critical the domain of the application is; participants were less willing to accept higher error rates for documents to be sent to their boss than for documents of personal use. This shows that while users’ perception of transcript quality is very subjective, it is also coarse-grained. Unfortunately, this research does not measure the perception of the recognition accuracy in information-based, task-oriented, contexts. A study based on recognition accuracy that assessed human ability to use transcripts is presented in [19]. Users performed summarizations and relevance judgements of audio materials from the HUB news corpus, using transcripts of various WERs obtained by different state-of-the-art ASR systems. As expected, the better the transcript accuracy, the better users performed on several measures, such as time to solution, solution quality, amount of audio played, and probability of abandoning the transcripts. This study served as a motivation for the SCANMail system [27], a voicemail user interface that offers synchronized browsing/skimming through a voicemail message and its automatically-generated transcription. While the SCANMail study revealed that users spent less time performing their tasks when they could browse through speech and text simultaneously, their performances were lower for keywords that were not properly transcribed. Also, subjects were sometimes mislead in their tasks by the transcription errors, assuming that transcripts accurately reflected the content of the voice message. Another finding was that users were looking in the voice messages mostly for critical information such as phone numbers or names, and that phone numbers especially needed to be recognized accurately. It is to be expected that users’ performance, when faced with an errorful transcript in the context of a speech browsing interface, can be improved by providing additional information-mining tools. Indeed, it is shown in [28], in a similar context as [19] (the retrieval of spoken news documents) that, when users are using a search tool to retrieve documents matching their query, providing visual information extracted from transcripts about their search results can be more effective than displaying only the (errorful) transcript of the news story. Thus, appropriate choices for the design of multimedia browsing tool can offset some of the shortcomings of having imperfect transcripts. Unfortunately, while these studies provide valuable insights into the users’ handling of errorful transcripts, they do not study the relation between performance and WER, nor do they provide insights into what level of WER is acceptable for a transcript to be included in a browsing interface. This is important because recognition accuracy by ASR systems for lectures and conference talks will not improve dramatically in the near future [28]. Further research is also needed to investigate how users compensate for errors in transcripts. RESEARCH QUESTIONS AND HYPOTHESES
The purpose of this research was to assess the usability and usefulness of automatically-generated transcripts for webcast archives. Given that the generation of transcripts
with current technologies results in error-laden documents, we wondered how partially correct transcripts would affect user performance and user perception of the system, and thus would suggest an appropriate level of WER in which to aspire. Specifically we wanted to test: Performance-Quality Hypothesis: User performance will decrease with increased WER. We expected users’ performance to be influenced by the accuracy of the transcripts; the performance should increase as the quality of transcripts improves. We expected a WER of 25% to be above the level of WER at which transcripts become useful (a level at which users achieve the same performance as with no transcripts). Experience-Quality Hypothesis: The quality of the user’s experience will decrease with increased WER. We expected users perception of their experience in completing tasks to be influenced by the accuracy of the transcripts; positive experiences should increase as the quality of the transcripts improves. We expected a WER of 25% to be above the level of WER at which users appreciate transcripts as a feature of the system. User perception was not a single value, but represented as a series of indicators each with its own result (as discussed in the next section). METHODS Overview
In order to test our hypotheses, we designed a within-subjects study in which participants were exposed to multiple levels of WER in their interaction, in a typical webcast use scenario – that of the undergraduate student responding to a quiz about the content of a class lecture. Independent Variables
The independent variable in this study was the WER. The WER of a transcript was computed as the average WERs of the sentences (transcript lines), of length at least 3 words2 . We assessed the effect of the WER at four levels: WER=0 – 0% WER (manual transcription). WER=25 – 25% WER. This is the WER that current ASR systems are able to achieve for broadcast news transcriptions. WER=45 – 45% WER. This is the WER reported in the literature for the task of transcribing lectures and conference talks, in real-life conditions (bad acoustics and diverse speakers). WER=NT – No transcripts were used (baseline case). Task
Each participant completed a quiz consisting of five questions for each webcast viewed. Each webcast was on a different lecture. The 38-minute lectures came from a a third year undergraduate course, The Design of Interactive Computational Media. Participants were required to complete each quiz in 12 minutes, which forced them to finish the quiz without listening to the entire lecture. Of the five quiz questions, at least one had the answer on the slide, and at least two did not have the answers on a 2
Most 1 and 2-word lines were just breathing noises or repetitions.
slide and were obscured by the errors in the transcripts. The quizzes contained only factual questions, specific to each of the lectures, and answers were typically very short (e.g. “Who developed PICTIVE?” – “Michael Muller”). Measures and Instruments
To compare the effect of each level of WER, two types of data were collected: Task performance data and User perception data. Task Performance Data
This was assessed by the accuracy of responses to a quiz on the presentation. Each five-question quiz had a maximum value of 10 points, with two points for each correctly answered question. The questions were designed in such a way that answers were unambiguous. Therefore, no partial points were awarded, except for answers that were half-complete, which received one point. Typically, half-complete answers were those for which participants found a partially correct answer, caused by speech recognition errors, in the transcript, but did not verify its accuracy by listening to the corresponding audio stream. Only two participants correctly answered questions on the preliminary quiz (and only one question each). One of them answered the same question correctly on the quiz during the experiment – the answer was ignored and the score on the quiz was adjusted for a maximum of 8 points instead of 10. The other participant did not answer the question due to a lack of time – thus no adjustment was needed. In order to eliminate the effects that differences in difficulty among lectures may have on quiz scores, the scores (referred from this moment on as raw quiz scores) were averaged across participants for each lecture, and relative quiz scores, defined as the difference between the raw quiz score and the lecture average, were used. For the four lectures used in the experiments the raw quiz averages were 4.10, 5.62, 6.18, and 6.67. Therefore, relative quiz scores could range from -6.67 to 5.90. For example, quiz scores on the most difficult lecture (of 4.10 average) could have ranged from -4.10 (a raw score of 0) to 5.90 (a raw score of 10).
Perception of speech recognition errors. Participants indicated their degree of agreement/disagreement with two statements: “The errors in the transcript didn’t stop me from solving the quiz” and “I was bothered by the errors in the transcript.” These statements were included only for tasks in which transcripts were present. Another statement assessing directly their perception of errors (“I haven’t noticed significant differences in the quality of the transcripts for different lectures”) was presented on the post-session questionnaire. Perception of usefulness of transcripts. Participants indicated agreement/disagreement with statements referring to transcripts as being helpful in solving the quiz better, and in solving the quiz faster, while on the post-session questionnaire they indicated their agreement with the statement “I would rather have transcripts with some errors than not have transcripts at all.” Perception of usability of transcripts. Participants, through the post-session questionnaire, indicated which feature they used to compensate for errors in the transcripts. We also assessed the usability of making transcripts “clickable,” both to compensate for errors in the transcript and as a general browsing feature. Confidence in using the entire system. Participants indicated the context in which they would choose to use the transcript-enhanced ePresence webcast system. The contexts ranged from very critical to less critical: “Prepare for an examination instead of going to classes,” “Prepare for an examination in addition to going to classes,” “Prepare for an assignment,” and “Make up for a missed class.” For each context, participants could choose “Yes,” “No,” or “Only if transcripts have no errors.” The user perception data consist of ordinal and discrete values, representing either choices on a rating scale or agreement/disagreement with various statements. In order to eliminate the differences in the lectures’ difficulty, the post-quiz raw data were translated into relative values, in the same manner as the quiz scores. Data collected from the post-session questionnaires were not adjusted, since these questionnaires addressed users’ overall experience with the enhanced ePresence system.
User Perception Data
User perception was assessed using a series of indicators derived from two instruments: a post-quiz questionnaire completed after each quiz that assessed user perception of the task at a specific level of WER, and a final post-session questionnaire which reflected the influence of WER on users’ experience. These instruments consisted of multiple-choice questions and/or indicated agreement/disagreement with various statements. The user perception indicators include: Perception of task difficulty. Participants rated the difficulty of each quiz relative to a preliminary quiz. Confidence in performance. Participants assessed the correctness of their answers to the quiz, by choosing one of “All correct”/”Mostly correct”/”Some correct”/”Mostly wrong”/”All wrong” choices for the question “I think my answers on the quiz were. . . ”.
System
Transcripts of 0% WER were obtained through manual transcription. In order to achieve the desired levels of less-than-perfect WERs, a special ASR system was built using the SONIC toolkit [14]. We controlled for the level of WER by developing language models and vocabularies that were over-fit to each lecture. The 25% level was achieved using trigram models built on sets of between 50 and 200 sentences extracted from the lectures. The 45% level was achieved by building bigram models on a mixture of sets of 20 sentences from the lectures and 650 sentences from the transcripts of the 1997 LDC Broadcast News (HUB-4) Corpus [20]. The recognition was performed on each set of sentences using the language model that was trained on data consisting of or containing the same set. Besides allowing for a greater control of the WER variable, this ensured that
users were exposed to transcripts generated by a real ASR system. Transcripts with these levels of WER as well as no transcript were integrated into an existing webcasting system that additionally provided the following components: video of the presentation, slides, table of contents, and timeline. Experimental Design
We opted for a repeated-measures (within-subjects) design: each participant completed four quizzes, one for each level of the independent variable. Each quiz was administered on a different lecture. A Latin square design (of size four) was chosen to randomize the order in which participants were exposed to the four levels of the independent variable [10]. For the 48 participants, 12 squares were used. The squares were designed such that each level of the independent variable was matched with one of the four lectures an equal number of times, and such that each of the four lectures appeared in every position in the sequence given to the participants. Participants
The study was conducted using 48 students (26 female and 22 male) at the undergraduate level, recruited from various disciplines. Procedures
Participants first completed a preliminary quiz that consisted of the questions from all four quizzes used in the experiment as well as filler questions, to eliminate the potential for confounding effects that might have been caused by a previous exposure to the course lectures used in the study. After becoming familiar with the system, participants completed a warm-up quiz while reviewing a lecture not included in the main experimental data. Next, each of the four quizzes and the corresponding lectures were presented to participants. Upon completion of each quiz, participants were assigned a very brief post-quiz questionnaire to assess user perception. Breaks were permitted between quizzes. After all quizzes were completed, a post-session questionnaire collected additional comparative user perception data and demographic information.
descriptive statistics are also presented for each level of the WER variable. RESULTS: TASK PERFORMANCE
Synopsis: Transcripts of WER=0 led to best Task performance, followed (in decreasing order) by WER=25, WER=NT, and WER=45. The Performance-Quality Hypothesis was tested through the ANOVA procedure. Also, a trend analysis was performed in order to estimate the nature of the relation between the scores corresponding to each level of WER. As indicated in [6] and [8], for independent variables with ordinal values (such as the WER variable), trend analysis is more meaningful than multiple (pairwise) ANOVAs among levels of the independent variable in revealing the kind of relationship that exists between the independent and the dependent variable. As the WER variable has a mixture of ordinal (0%, 25%, and 45% error rates) and categorical (NT – no transcript) levels, two trend analyses were run: one using only the ordinal levels (to reveal the influence of error rates on performance) and one using all levels, in which WER=NT is considered equivalent to an ordinal level of unknown value (to estimate the WER threshold above which transcripts become useful). Also, since WER=NT is a categorical value, a set of pairwise ANOVA comparisons were performed between WER=NT and each of WER=0, WER=25, and WER=45 to confirm the findings of the trend analysis. Performance-Quality Hypothesis
Synopsis: Users’ performance is indeed influenced by WER. Also, WER=25 is above the WER threshold for achieving the same performance as no transcripts. However, the increase in performance does not slow down as quality improves. Instead, the trend analysis (detailed below) suggests that performance varies linearly with the transcript’s quality. The ANOVA using all levels of WER shows a significant relation between quiz scores and quality of transcript (Table 1). The results are also confirmed by the distribution-free test (Friedman’s Rank test). The trend analysis carried out on the ordinal values of WER shows a significant linear relation (Table 2), WER=0 having the highest score, and WER=45, the lowest.
Data Analysis
In order to verify our hypotheses, the most suitable statistical test for our within-subjects design is the repeated-measures ANOVA [7], using SPSS’s General Linear Model Repeated Measures procedure [18]. All tests were run using a significance level of α = .05 as the size of the null hypothesis’ rejection region. For the ANOVA procedure, the independent variable WER was used with its four levels: WER=0, WER=25, WER=45, and WER=NT. Although we tested the data for normalcy, a non-parametric (distribution-free) test, Friedman’s Rank Test for Correlated Samples [7], was also run and χ2 -scores were computed, in order to confirm the validity of the F-scores obtained through ANOVA. Beside the tests for statistical significance, simple
In order to assess whether WER=25 leads to a better performance than having no transcripts, we consider WER=NT as an ordinal value (being equivalent to a transcript of unknown WER). The trend analysis (Table 2) reveals that the quiz scores for WER=NT fall between those for WER=45 and those for WER=25 (Table 1 shows the average scores for each value of WER), the relation still being best approximated as linear. A set of multiple (pairwise) comparisons (Table 3) was also carried out between the categorical value of WER (WER=NT) and each of the ordinal levels (WER=0, WER=25, and WER=45). While the difference in means can
WER Mean Score ANOVA Friedman
0 25 NT 45 0.907 0.071 -0.373 -0.605 F (3, 141) = 7.264, p < .001 χ2F (3) = 18.325, p < .001
Table 1. Mean relative quiz scores for each level of WER, and tests of significance over all levels of WER. WER 0, 25, 45 0, 25, NT, 45
Trend Linear: F (1, 47) = 20.133, p < .001 Linear: F (1, 47) = 23.477, p < .001
Table 2. Trend analyses over the ordinal values of WER and over all values of WER. be attributed to the quality of transcripts for WER=0 when compared to WER=NT, the differences between WER=25 and WER=NT and between WER=45 and WER=NT are not significant. This confirms the trend analysis findings that the performance for WER=NT is close to both WER=25 and WER=45 (falling in between them) and significantly lower than the performance for WER=0. Performance-Quality Hypothesis – NotOnSlide Scores
A similar analysis was also performed on a OnSlide / NotOnSlide breakdown of quiz scores. Some of the quiz questions (typically 1 or 2 out of 5 for each quiz) could be answered without listening to the lecture (the answer was found on the slides). Therefore, a separate analysis was carried out for quiz scores that summed up only the questions with answers on slides (OnSlide scores) and, independently, for those that required a thorough listening of the lecture (or reading of transcripts) in order to answer the questions (NotOnSlide scores). When considering only the OnSlide scores, there are no significant effects of having different values for the WER variable. However, the differences in WER values have a significant effect on the NotOnSlide scores (Table 4). The trend analysis (Table 5) clearly shows a linear relation between WER values (0, 25, and 45) and quiz (NotOnSlide) scores. Interestingly, the scores (Table 4) for WER=NT are now marginally lower than those for WER=45. Indeed, the trend analysis over all levels of WER (Table 5) indicates a linear relation between WER values and scores, with a slight quadratic component explained by the close means for WER=NT and WER=45. This indicates that the WER threshold for which transcripts yield better performance than having no transcripts is lower for questions that do not have the answer on slides. However, in terms of post-hoc analysis WER 0 25 45
Comparison with WER=NT F (1, 47) = 18.498, p < .001 F (1, 47) = 1.428, p = .238 F (1, 47) = .405, p = .527
Table 3. Multiple comparisons between WER=NT and each of the ordinal levels of WER.
WER Mean Score ANOVA Friedman
0 25 45 NT 0.287 -0.024 -0.121 -0.140 F (3, 141) = 8.473, p < .001 χ2F (3) = 18.175, p < .001
Table 4. Mean relative NotOnSlide scores for each level of WER, and tests of significance over all levels of WER. WER 0, 25, 45 0, 25, NT, 45
Trend Linear: F (1, 47) = 18.139, p < .001 Linear: F (1, 47) = 29.293, p < .001 Quadratic: F (1, 47) = 4.010, p = .051
Table 5. Trend analyses over the ordinal values of WER and over all values of WER for NotOnSlide scores. between WER=NT and the ordinal levels of WER (Table 6), the effects of WER=25 and WER=45 are, as expected, still not significantly different than those of WER=NT. Performance-Quality Hypothesis – Novice Users
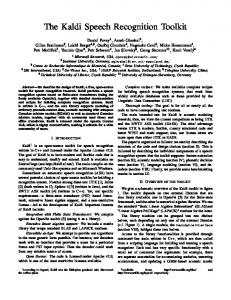
While ANOVA tests and trend analyses allow us to make inferences about the data collected through the experiments, in many cases it is also important to take a closer look at simple descriptive statistics [7]. In particular for our experiment, examining the histograms of quiz scores for each level of WER leads to some interesting observations. Although the distributions of quiz scores for each value of WER can be approximated as normal, the histogram for WER=25 (Figure 2) shows an almost bi-modal distribution, with scores between -3 and -2 occurring 14 times, while scores between 1 and 2 occur 12 times. In order to determine the cause for having scores distributed around 2 poles for WER=25, we looked at the demographic information collected through the post-session questionnaire. The demographic information consists of: using the system (or a similar one) before, estimated number of hours of daily internet usage, interaction with media content on internet, field and year of study, enrollment in the course where the recordings of lectures come from. The histograms for each demographic factor were analyzed, and only the used system before factor (8 subjects out of 48) produced a change in the shape of the histogram (Figure 3 shows the histogram for WER=25 with these 8 subjects removed). The distributions for the other levels of WER are not affected by this factor. The same analyses that were carried out for testing the Performance-Quality Hypothesis were also performed WER 0 25 45
Comparison with WER=NT F (1, 47) = 27.996, p < .001 F (1, 47) = 1.447, p = .235 F (1, 47) = .034, p = .855
Table 6. Multiple comparisons between WER=NT and each of the ordinal levels of WER for NotOnSlide scores.
WER Mean Score ANOVA Friedman Trend
0 25 NT 45 0.812 0.261 -0.438 -0.635 F (3, 117) = 5.567, p = .001 χ2F (3) = 12.570, p = .006 Linear: F (1, 39) = 18.207, p < .001
Table 7. Mean relative scores for each level of WER across novice users, and tests of significance and trends over all levels of WER.
Figure 2. The histogram of the relative quiz scores for WER=25
Confidence in perform. Percep. task difficulty
WER Mean level ANOVA Mean level ANOVA
0 25 NT 45 -0.220 -0.026 0.009 0.238 F (3, 141) = 5.369, p = .001 -0.339 -0.151 0.245 0.245 F (3, 141) = 6.201, p < .001
Table 8. Mean relative perception of difficulty and confidence in performance levels for each level of WER, and tests of significance over all levels of WER. Lower values mean increased confidence (choice 1 on questionnaire indicated being very confident) and perception of an easier task (choice 1 indicated a very easy task). using the 40 subjects that never used the system or a similar system before (novice users). While there is still a significant effect of the WER variable on quiz scores (Table 7) and a linear trend can also be observed among all levels of WER, the mean scores for WER=25 for novice users are higher than for WER=25 across all participants, while scores for WER=0 and WER=45 remain relatively unchanged. A possible explanation of this is that previous versions of the ePresence system (as well as other similar webcast systems) do not include any transcripts in the interface, thus participants that used such systems were not accustomed to handling transcripts. While perfect transcripts (WER=0) equally helped such users and novice users, and poor-quality transcripts (WER=45) lowered the performance for experienced users and novice users alike, transcripts that are usable but not perfect (WER=25) required participants to employ strategies to compensate for errors in transcripts that might be more easily to be developed by novice users than by more experienced users, as novice users have no prior expectations about the system. RESULTS: USER PERCEPTION
Synopsis: Transcripts of WER=0 led to best user experience, followed (in decreasing order) by WER=25, WER=NT, and WER=45. As previously mentioned, the user perception data were collected through post-quiz questionnaires (post-quiz perception data) and through the post-session questionnaire (post-session user perception data). The post-quiz data were analyzed through Repeated Measure ANOVAs (F-scores), in the same manner as the relative quiz scores. Trend analyses were also carried out, as well as multiple comparisons between WER=NT and each of the ordinal levels of WER. Since the post-session user perception data were collected at the end of the study and refer to users’ overall experience, no tests of statistical significance needed to be performed. Instead, simple descriptive statistics are used to present this post-experiment analysis of user perception. Figure 3. The histogram of the relative quiz scores for WER=25 (only for subjects that haven’t used the system before).
Experience-Quality Hypothesis
Synopsis: Users’ experience is indeed influenced by WER. Also, WER=25 is above the WER threshold at which users welcome transcripts as a feature of the system. However, the
Confidence in perform. Percep. task difficulty
WER 0, 25, 45 0, 25, NT, 45 0, 25, 45 0, 25, NT, 45
Trend – linear: F (1, 47) = 13.108, p = .001 F (1, 47) = 12.006, p = .001 F (1, 47) = 10.735, p = .001 F (1, 47) = 12.857, p = .001
Table 9. Trend analyses over the ordinal values of WER and over all values of WER for perception and confidence levels.
Confidence in perform. Percep. task difficulty
WER 0 25 45 0 25 45
Comparison with WER=NT F (1, 47) = 4.399, p = .041 F (1, 47) = 0.126, p = .724 F (1, 47) = 4.642, p = .036 F (1, 47) = 12.242, p = .001 F (1, 47) = 4.797, p = .034 F (1, 47) = 0.000, p = 1.00
Table 10. Multiple comparisons between WER=NT and each of the ordinal levels of WER for perception and confidence levels. increase in user experience does not always slow down as quality improves. We found that some user perception data (perception of task difficulty and confidence in performance) exhibit only a linear relation with WER, while other data (perception of transcripts’ usefulness and perception of errors in transcripts) show an increase in user experience as quality improves, but seem to level off at lower values of WER. Perception of task difficulty and confidence in performance
These were the user perception data collected at all levels of WER. The ANOVA shows that WER affects users’ experience both for perception of task difficulty and for confidence in performance (Table 8). The increase in users’ experience (over the ordinal values of WER) is linear both for confidence in performance and perception of difficulty (Table 9). For confidence in performance, multiple-comparisons (pairwise) ANOVAs between WER=NT and each ordinal level of WER show a significant effect (Table 10) between WER=NT and WER=0 and between WER=NT and WER=45, but not between WER=NT and WER=25. Indeed, the mean relative level of confidence for WER=NT is very close to that for WER=25, which is confirmed by the trend analysis of all levels of WER. This is still a linear relation, since the confidences for WER=25 and WER=NT are very close when compared to those for WER=0 and for WER=45. For perception of difficulty, pairwise comparisons (Table 10) reveal significant effects between WER=NT and WER=0 and between WER=NT and WER=25, but not between WER=NT and WER=45. Perceived difficulty levels for WER=NT and WER=45 are equal, thus the trend analysis over all values still shows a linear relation. Therefore, we can conclude that WER=25 is at least equal or even better in improving users’ experience as having no transcripts.
Perception of speech recognition errors
Participants indicated their agreement/disagreement with two statements that appeared on post-quiz questionnaires that were administered only after quizzes where transcripts were present: “The errors in the transcript didn’t stop me from solving the quiz” and “I was bothered by the errors in the transcript.” For both questions, the level of agreement was significantly influenced by WER (F (2, 94) = 7.060, p = .001 and F (2, 94) = 12.212, p < .001 respectively). A trend analysis shows that the relation between WER and participants’ perception of error rates is linear for both questions (F (1, 47) = 12.746, p = .001 and F (1, 47) = 20.699, p < .001 respectively), with users being more aware of the errors in transcripts of higher WER. The perception of errors in transcripts was also assessed through the post-session questionnaire. Participants indicated their agreement with the statement “I haven’t noticed significant differences in the quality of the transcripts for different lectures”. 64% of subjects disagreed or strongly disagreed with the statement, while only 19% of subjects agreed or strongly agreed with it. This further shows that participants were fully aware of the differences in transcripts’ quality levels across sessions. Perception of transcripts’ helpfulness
Participants indicated their agreement with two statements from post-quiz questionnaires administered only when transcripts were present: “Transcripts helped me solve the quiz faster” and “Transcripts helped me solve the quiz better.” For both questions, the level of agreement was significantly influenced by WER. However, the trend analysis shows (Table 11) both a linear and a quadratic component of the relation between perception of transcripts’ helpfulness and WER (transcripts of WER=0 being perceived as more helpful than those of WER=25, which in turn are more helpful than those of WER=45). The quadratic component is explained by users’ perception of helpfulness for WER=25 being closer to that for WER=0 than to the perception for WER=45 (Table 11). Besides the statements from the post-quiz questionnaires, users’ perception of usefulness was also assessed through one question on the post-session questionnaire, by indicating their agreement with the statement “I would rather have transcripts with some errors than not having transcripts at all”. 91% of subjects indicated (agreed or strongly agreed) their preference for having access to transcripts, even if their quality is not perfect. This further demonstrates that 25% error rate is acceptable from the users’ perspective. Perception of transcripts’ usability
The post-session questionnaire also asked participants to indicate which features they used to compensate for the errors in the transcripts, by indicating their agreement with statements such as “When transcripts seemed to be full of errors, I used X to find the answer,” with X being each of “slides,” “audio playback,” “table of contents,” and “timeline.” Slides, audio playback, and table of contents were equally favoured by users (about 65% of subjects
Solved faster Solved better
WER Mean Score ANOVA Trend: linear & quadratic Mean Score ANOVA Trend: linear & quadratic
0 25 45 -0.345 -0.282 0.627 F (2, 94) = 20.164, p < .001 F (1, 47) = 24.790, p < .001 F (1, 47) = 11.594, p = .001 -0.283 -0.240 0.523 F (2, 94) = 14.721, p < .001 F (1, 47) = 18.884, p < .001 F (1, 47) = 8.051, p = .006
Table 11. Mean relative perception of helpfulness levels for each level of WER, and tests of significance and trends over all levels of WER. Lower values mean increase helpfulness (choice 1 on questionnaire indicated transcripts helped solved the quiz faster/better).
agreed or strongly agreed with each) as navigational tools useful in compensating for speech recognition errors in transcripts (timeline was used by only 18%). Of these, the table of contents was the highest rated (31%) as the first choice (strongly agreed that it helped compensate for transcripts’ errors), followed by the audio playback (23%). Participants also indicated (over 80% agreed or strongly agreed) that being able to play individual lines from transcripts both made the tasks easier to accomplish and was useful when transcripts had errors. Participants were also asked (on the post-session questionnaire) to rate all features of the system from an overall usefulness perspective. About 95% of subjects rated all features except the timeline as useful or very useful (the timeline was rated as useful or very useful only by 59% of the subjects). The table of contents was rated the highest for first choice only (very useful for 79% of the subjects), followed by transcripts (62%). This analysis leads to the conclusion that appropriate navigational tools improve users’ experience when errorful transcripts are present.
Confidence in using the system
We also assessed users’ overall confidence in using the system, with respect to the importance of the application where the system is to be used. When asked if they would use the system to “prepare for an examination instead of going to classes,” 33% of respondents chose “no,” while 37% of them indicated “only if transcripts have no errors.” Unsurprisingly, their confidence changed when asked if they would use the system to “prepare for an examination in addition to going to classes”: 75% opted for an unconditional “yes.” With respect to less critical tasks (preparing for an assignment), 72% indicated they would use the system, while 21% conditioned it by having transcripts with no errors. Meanwhile, using a system to make up for a missed class would not demand accurate transcripts (93% would use the system for such a task, only 4% conditioning it by having perfect transcripts). This shows that transcripts’ quality is more critical in some applications than in others.
DISCUSSIONS, CONCLUSIONS AND FUTURE WORK
One of the major drawbacks for the users of audio/video archives (such as those of webcast lectures and presentations) is the difficulty in performing operations typically associated with archived text, such as scanning and browsing. While manual transcription is a very expensive and time-consuming task, speech recognition systems can provide an alternative solution. However, for lecture and presentation speech, the poor accuracy of automatically generated transcripts makes their use questionable. In this paper, we investigated users’ expectations for transcription accuracy in webcast archives, and measured how the quality of the transcripts affects the usability and usefulness of the archives. We also investigated what other navigational tools (table of contents, slides, etc.) users employ to compensate for errors in the transcripts. For this, we designed an ecologically valid experiment, where 48 subjects used a fully-featured webcast browsing tool, while answering quizzes based on archives of webcast lectures. Our analysis of the task performance data revealed that speech recognition accuracy linearly influenced users’ performance. For transcripts with a word error rate equal to or less than 25%, users’ task performance was better than that of using no transcripts. Word error rate also influenced (linearly) the users’ experience, as shown by the analysis of the user perception data. Error rates of 25% led to users’ experience above that achieved when using no transcripts. When exposed to transcripts with WER of 45%, both task performance and user experience were worse than if no transcripts had been provided. Our study is limited to one specific task (quiz answering) under strict time constraints and to an undergraduate-level student population, most of whom used such a system for the first time. While the findings of our research can be generalized (as indicated by the post-session questionnaire) to various academic activities (such as making up for a missed class or preparing an assignment), future work must take into consideration extending this study to a broader pool of participants (such as corporate webcast users, for which accuracy might be more critical), to more diverse tasks and conditions (such as presentations for which no slides are available), and to levels of WER between 0% and 25%. Existing research on ASR for lectures and presentations shows promising results that can lead to a further reduction of error rates for these domains: while current lecture-dedicated systems can achieve WERs of 40-45%, emerging ASR systems can, in certain conditions, reduce the WER up to 20-30%. Part of our future work will be focused on developing better ASR systems that will be able to deliver WERs of 25% for real-life lecture conditions. ASR systems are not likely to improve significantly more in the near future, and thus existing webcast systems may not reach the same usability levels as perfect (manually generated) transcripts. Further research, such as on summarization of spoken documents or extraction
of keywords from speech, is needed for obtaining text representations of lectures (e.g. summaries, keyword indices) that increase the usability of webcast archives. More user studies are needed to determine what kind of textual information increases the usability and usefulness of webcasts. Also, current measures of speech recognition accuracy (mainly word error rate) might not fully reflect user needs for transcript quality. Future work will look at developing other more appropriate measures of quality. ACKNOWLEDGEMENTS
14. Pellom, B. L. Sonic: The University of Colorado Continuous Speech Recognizer. Technical Report #TR-CSLR-2001-01, Boulder, Colorado (2001). 15. Ritter, P. The Business Case for On-Demand Rich Media. Wainhouse Research Whitepapers (2004). 16. Rogina, I. and Schaaf, T. Lecture and Presentation Tracking in an Intelligent Meeting Room. Proc. of the International Conference on Multimodal Interfaces (2000).
This research was funded by the NSERC Canada Network for Effective Collaboration Technologies through Advanced Research (NECTAR).
17. Sawhney, N. and Schmandt, C. Nomadic Radio: Speech & Audio Interaction for Contextual Messaging in Nomadic Environments ACM Transactions on Computer-Human Interaction (2000), v. 7, n. 3, 353–383.
REFERENCES
18. SPSS 13.0. http://www.spss.com
1. Arons, B. SpeechSkimmer: A System for Interactively Skimming Recorded Speech. ACM Transactions on Computer-Human Interaction (1997), v. 4, n. 1, 3–38.
19. Stark, L., Whittaker, S., and Hirschberg, J. ASR Satisficing: The Effects of ASR Accuracy on Speech Retrieval. Proc. of the International Conference on Spoken Language Processing (2000), 1069–1072.
2. Baecker, R. M. A Principled Design for Scalable Internet Visual Communications with Rich Media, Interactivity, and Structured Archives. Proc. of CASCON (2003), 83–96.
20. Stern, R. Specifications of the 1996 Hub 4 Broadcast News Evaluation. Proc. of the DARPA Speech Recognition Workshop (1997)
3. Dufour, C., Toms, E. G., and Lewis, J. and Baecker, R. M. User Strategies for Handling Information Tasks in Webcasts Proc. of CHI (2005), 1343–1346.
21. Toms, E. G., Dufour, C., Lewis, J., and Baecker, R. M. Assessing Tools for Use with Webcasts. Proc. of the Joint Conference on Digital Libraries (2005), 79–88.
4. Gauvain, J-L., Lamel, L., and Adda, G. The LIMSI Broadcast News Transcription System. Speech Communications (2002), v. 37, n. 1-2, 89–108.
22. Van Buskirk, R. and LaLomia, M. J. The Just Noticeable Difference of Speech Recognition Accuracy. CHI Mosaic of Creativity: The Conference Companion on Human Factors in Computing Systems (1995), 95.
5. Huang, X., Acero, A., and Hon, H.W. Spoken Language Processing. Prentice Hall, USA, 2001. 6. Howell, D.C. Statistical Methods for Psychology. Duxbury Press, USA, 1997 7. Howell, D. C. Fundamental Statistics for the Behavioural Sciences. Duxbury Press, USA, 1999.
23. V´eronis, J. A Study of Polysemy Judgements and Inter-annotator Agreement. Proc. SENSEVAL Workshop: Evaluating Word Sense Disambiguation Programs (1998), 2–4.
8. Howell, D. C. Multiple Comparisons with Repeated Measures. http://www.uvm.edu/∼dhowell
24. Wald, M., Bain, K., and Basson, S.H. Speech Recognition in University Classrooms. Proc. of the International ACM SIGCAPH Conference on Assistive Technologies (2002), 192–196.
9. Kato, K., Nanjo, H., and Kawahara, T. Automatic Transcription of Lecture Speech Using Topic-Independent Language Modeling. Proc. of the International Conference on Spoken Language Processing (2000), 162–165.
25. Wang, Y.Y., Acero, A., and Chelba, C. Is Word Error Rate a Good Indicator for Spoken Language Understanding Accuracy? Proc. of the IEEE Automatic Speech Recognition and Understanding Workshop (2003), 577–582.
10. Kirk, R. E. Experimental Design: Procedures for the Behavioural Sciences. Brooks Publishing, USA, 1995.
26. Ward, W. and Issar, S. The CMU ATIS System. Proc. of the ARPA Workshop on Spoken Language Technology (1995), 249–251.
11. LaLomia, M. J. User Acceptance of Handwritten Recognition Accuracy. The Conference Companion on Human Factors in Computing Systems (1997), 107. 12. Leeuwis, E., Federico, M., and Cettolo, M. Language Modeling and Transcription of the TED Corpus Lectures. Proc. of the IEEE Conference on Acoustics, Speech, and Signal Processing (2003), 232–235.
27. Whittaker, S., Hirschberg, J., Amento, B., Stark, L., Bacchiani, M., Isenhour, P., Stead, L., Zamchick, G., and Rosenberg, A. SCANMail: a Voicemail Interface that Makes Speech Browsable, Readable and Searchable. Proc. of the SIGCHI Conference on Human Factors in Computing Systems (2002), 275–282.
13. Park, A., Hazen, T.J., and Glass, J.R. Automatic Processing of Audio Lectures for Information Retrieval. Proc. of the IEEE Conference on Acoustics, Speech, and Signal Processing (2005), 497–500.
28. Whittaker, S. and Hirschberg, J. Look or Listen: Discovering Effective Techniques for Accessing Speech Data. Proc. of the Human-Computer Interaction Conference. Springer-Verlag (2003), 253–269.