The Effect of Thiazolidinediones on Plasma Adiponectin Levels in Normal, Obese, and Type 2 Diabetic Subjects Joseph G. Yu,1,2,3 Sandrine Javorschi,4 Andrea L. Hevener,1,2,3 Yolanta T. Kruszynska,1,2,3 Rodney A. Norman,4 Madhur Sinha,5 and Jerrold M. Olefsky1,2,3
The insulin-sensitizing effects of thiazolidinediones are thought to be mediated through peroxisome proliferator–activated receptor-␥, a nuclear receptor that is highly abundant in adipose tissue. It has been reported that adipocytes secrete a variety of proteins, including tumor necrosis factor-␣, resistin, plasminogen activator inhibitor-1, and adiponectin. Adiponectin is a fat cell– secreted protein that has been reported to increase fat oxidation and improve insulin sensitivity. Our aim was to study the effects of troglitazone on adiponectin levels in lean, obese, and diabetic subjects. Ten diabetic and 17 nondiabetic subjects (8 lean, BMI 27 kg/m2) participated in the study. All subjects underwent an 80 mU 䡠 mⴚ2 䡠 minⴚ1 hyperinsulinemic-euglycemic glucose clamp before and after 3 months’ treatment with the thiazolidinedione (TZD) troglitazone (600 mg/day). Fasting plasma glucose significantly decreased in the diabetic group after 12 weeks of treatment compared with baseline (9.1 ⴞ 0.9 vs. 11.1 ⴞ 0.9 mmol/l, P < 0.005) but was unchanged in the lean and obese subjects. Fasting insulin for the entire group was significantly lower than baseline (P ⴝ 0.02) after treatment. At baseline, glucose disposal rate (Rd) was lower in the diabetic subjects (3.4 ⴞ 0.5 mg 䡠 kgⴚ1 䡠 minⴚ1) than in the lean (12.3 ⴞ 0.4) or obese subjects (6.7 ⴞ 0.7) (P < 0.001 for both) and was significantly improved in the diabetic and obese groups (P < 0.05) after treatment, and it remained unchanged in the lean subjects. Baseline adiponectin levels were significantly lower in the diabetic than the lean subjects (9.0 ⴞ 1.7 vs. 16.7 ⴞ 2.7 g/ml, P ⴝ 0.03) and rose uniformly in all subjects (12.2 ⴞ 2.3 vs. 25.7 ⴞ 2.6 g/ml, P < 10– 4) after treatment, with no significant difference detected among the three groups. During the glucose clamps, adiponectin levels were suppressed below basal levels in all groups (10.2 ⴞ 2.3 vs. 12.2 ⴞ 2.3 g/ml, P < 0.01). Adiponectin levels correlated with Rd (r ⴝ 0.46, P ⴝ 0.016) and HDL cholesterol levels (r ⴝ 0.59, P < 0.001) and negatively correlated with fasting insulin (r ⴝ ⴚ0.39, P ⴝ 0.042) and plasma triglyceride (r ⴝ ⴚ0.61, P < 0.001). Our findings show that TZD treatment increased adiponectin levels in all subjects, inFrom the 1Department of Medicine, Division of Endocrinology and Metabolism, University of California San Diego, La Jolla, California; the 2Veterans Administration San Diego Healthcare System, San Diego, California; the 3 Whittier Institute for Diabetes, La Jolla, California; 4GenSet Corporation, San Diego, California; and 5Linco Research Inc., St. Charles, Missouri. Address correspondence and reprint requests to Jerrold M. Olefsky, MD, University of California San Diego (0673), 9500 Gilman Dr., La Jolla, CA 92093. E-mail:
[email protected]. Received for publication 21 February 2002 and accepted in revised form 17 July 2002. NEFA, nonesterified fatty acid; PPAR, peroxisome proliferator–activated receptor; Ra, glucose appearance rate; Rd, glucose disposal rate; TNF, tumor necrosis factor; TZD, thiazolidinedione. 2968
cluding normal subjects in which no other effects of TZDs are observed. Insulin also appears to suppress adiponectin levels. We have confirmed these results in normal rats. These findings suggest that adiponectin can be regulated by obesity, diabetes, TZDs, and insulin, and it may play a physiologic role in enhancing insulin sensitivity. Diabetes 51:2968 –2974, 2002
I
n the past, adipose tissue was largely regarded as a depot for fuel storage in the form of triglyceride. However, the adipocyte is now known to secrete a variety of proteins such as tumor necrosis factor (TNF)-␣, adipsin, plasminogen activator inhibitor-1, leptin, resistin, and adiponectin (1–9). Because these proteins appear to have similar structural properties to cytokines, they have been collectively called adipocytokines and are implicated in a wide range of biological effects. Insulin resistance is a major feature in the etiology of obesity and type 2 diabetes, and the relationship between insulin resistance and these pathophysiologic states is complex. Thiazolidinediones (TZDs) improve insulin sensitivity and have emerged as an effective treatment for type 2 diabetes and other insulin-resistant states (10). The insulin-sensitizing effects of TZDs are mediated through the peroxisome proliferator–activated receptor (PPAR)-␥, a nuclear receptor that is highly abundant in adipose tissue but is also expressed in skeletal muscle, macrophages, as well as other tissues (11–15). In adipose tissue, the PPAR-␥ receptor functions to promote differentiation (16,17), and it has been proposed that one mechanism of TZD-induced insulin sensitization resides in adipose tissue, which then “communicates” with skeletal muscle to improve insulin action (18). Adipocytokines may bridge the gap in this cross-talk between fat and muscle tissue. Steppan et al. (7) have reported that circulating levels of resistin are increased in diet-induced and genetic forms of obesity. Concomitant treatment with TZDs decreased resistin levels and administration of antiresistin antibody improved insulin action and glucose levels in obese mice. However, other groups have found conflicting results (19,20). Alternatively, blood levels of another adipocytokine, adiponectin, are decreased in obesity, type 2 diabetes, and coronary artery disease (21–23). ACRP30 is the rodent form of adiponectin, and ACRP30 levels are lower in high-fat fed mice (24) and PPAR-␥⫹/⫺ mice made lipoatrophic by treatment with a retinoid-X receptor antagonist. Administration of ACRP30 to diabetic db/db mice improved insulin resistance and corrected hyperglycemia and hyperinsulinemia (24). Furthermore, administration of DIABETES, VOL. 51, OCTOBER 2002
J.G. YU AND ASSOCIATES
TABLE 1 Clinical characteristics of the subjects studied
N (F/M) Age (years) Weight (kg) BMI (kg/m2) Fasting plasma glucose (mmol/l) Fructosamine (mol/l)*
Lean
Obese
Type 2 diabetes
P
8 (1/7) 50 ⫾ 2 73 ⫾ 3 24.3 ⫾ 0.8 4.8 ⫾ 0.1 152 ⫾ 7
9 (1/8) 45 ⫾ 2 109 ⫾ 6 34.8 ⫾ 1.2 5.0 ⫾ 0.1 154 ⫾ 6
10 (1/9) 51 ⫾ 3 105 ⫾ 7 33.6 ⫾ 2.0 11.1 ⫾ 0.9 247 ⫾ 15
NS NS 0.001 ⬍0.001 ⬍0.001 ⬍0.001
Data are means ⫾ SD. *Normal laboratory range: 160 –260 mol/l.
this protein enhances insulin sensitivity in normal mice, as assessed by the glucose clamp technique (25). Therefore, the goal of this study was to examine the effects of TZD treatment and insulin administration on adiponectin/ ACRP30 levels in humans and rats. RESEARCH DESIGN AND METHODS Ten subjects with type 2 diabetes and 17 nondiabetic control subjects (8 lean, BMI ⬍27 kg/m2 and 9 obese, BMI ⬎27 kg/m2) participated in the study. The clinical characteristics of the subjects are given in Table 1. Studies in subjects with type 2 diabetes were performed after discontinuation of their antihyperglycemic medications for ⬃2 weeks. All participants were in good general health and had normal kidney and liver function. Subjects were excluded if they had active cardiac, hepatic, or renal disease or if they had long-term complications from diabetes. None of the control subjects were taking any medication to alter glucose tolerance. Among the diabetic subjects, five were being treated with sulfonylureas, one with metformin, two with combination sulfonylurea and metformin, and two with diet alone. The diabetic subjects were asked to discontinue taking their medications at least 2 weeks before their baseline studies. Each subject underwent an 80 mU 䡠 m⫺2 䡠 min⫺1 hyperinsulinemic-euglycemic glucose clamp at baseline, and this was repeated after 3 months of treatment with 600 mg/day troglitazone. The study protocol was approved by the Human Subjects Committee of the University of California San Diego. Informed written consent was obtained from each subject. Hyperinsulinemic-euglycemic clamps. Studies were performed in the morning after a 10-h overnight fast. At 0300, an 18-gauge intravenous catheter was inserted in an antecubital vein and a constant infusion of [3-3H]glucose (0.25 ci/min) (New England Nuclear, Boston, MA) was started. At 0700, another intravenous catheter was inserted in a retrograde fashion in a hand vein, with the hand placed in a hand warmer for sampling of arterialized blood. At ⬃0800, four basal blood samples were drawn at 10-min intervals for measurement of plasma glucose concentration and specific activity, insulin, and nonesterified fatty acid (NEFA) concentrations. An intravenous infusion (Humulin; Eli Lilly, Indianapolis, IN) diluted in 0.15 mol/l saline containing 1% wt/vol human albumin was then begun at a rate of 80 mU 䡠 m⫺2 䡠 min⫺1. Potassium and phosphate were given intravenously to compensate for the intracellular movement of these ions and to maintain normal blood levels. Blood samples were taken every 20 –30 min for plasma specific activity, insulin, and NEFA. Additional blood samples were obtained every 5 min with a glucose analyzer (YSI 2700 analyzer; YSI, Yellow Springs, OH) for measurement of plasma glucose. A variable infusion of [3-3H]glucose– enriched 20%
glucose was delivered to maintain a plasma glucose concentration of 5 mmol/l. During the last 40 min of the insulin infusion, blood samples were obtained at 10-min intervals for determination of plasma glucose concentration and specific activity, insulin, and NEFA. Analytical procedures. For determination of [3H]glucose specific activity, 0.65 ml plasma was deproteinized with Ba(OH)2/ZnSo4. After centrifugation, the neutral supernatant was evaporated and the residue dissolved in 1 ml of water. After addition of 10 ml scintillation fluid (Ecoscint, Manville, NJ), 3H disintegrations per minute were determined in an ICN 36014 liquid scintillation counter (Titertek Instruments, Huntsville, AL) with the use of an external standard to correct for quenching. Quadruplicate aliquots of the labeled glucose infusate were added to nonradioactive plasma and processed in parallel with the plasma samples to allow calculation of the [3-3H]glucose infusion rate. Plasma insulin was measured by a double antibody technique (26). The intra- and interassay coefficients of variation were 6.8 and 7.9%, respectively. Plasma NEFA was determined using an Acyl-CoA oxidase– based colorimetric kit (Wako NEFA-C; Wako, Richmond, VA) with intra- and interassay coefficients of variation of 2.4 and 3.3%. Plasma adiponectin was measured by a radioimmunoassay kit (LINCO Research, St. Charles, MO). This kit is based on the double-antibody/ polyethylene glycol technique using 125I-labeled adiponectin and a multispecies adiponectin rabbit antiserum. Calculations. Total glucose appearance rate (Ra) and glucose disposal rate (Rd) were calculated from the [3-3H]glucose data using the non–steady-state equations of Steele (27). A distribution volume of 0.19 l/kg and a pool fraction of 0.5 were used in the calculation (28). The basal Rd for subjects with type 2 diabetes was corrected for urinary glucose excretion. Hepatic glucose output was calculated as the difference between total glucose Ra and the rate of exogenous glucose infusion. Statistical analysis. Results are expressed as means ⫾ SE, unless otherwise indicated. To compare the adiponectin levels among lean, obese, and diabetic subjects before and after TZD treatment, adiponectin plasma level data were modeled by repeated-measures ANOVA using TZD treatment as the repeated variable. The effect of insulin during the clamp and TZD treatment was analyzed by ANOVA using PROC GLM, with insulin as the repeated effect. PROC GLM and PROC MIXED (SAS, Cary, NC) were used for these analyses. A P value ⬍0.05 was considered statistically significant.
RESULTS
Glycemic control. Fasting plasma glucose was significantly lower after 12 weeks of treatment compared with baseline in type 2 diabetic subjects (9.1 ⫾ 0.9 mmol/l vs.
TABLE 2 Fasting plasma insulin and lipid levels before and after 3 months of 600 mg/day troglitazone Lean
Insulin (mU/l) NEFA (mmol/l) Triglyceride mg/dl) Total cholesterol (mg/dl) HDL cholesterol (mg/dl)
Obese
Type 2 diabetes
Before TZD
After TZD
Before TZD
After TZD
Before TZD
After TZD
4.3 ⫾ 0.5 0.4 ⫾ 0.06 102 ⫾ 20 175 ⫾ 8 57 ⫾ 7
4.1 ⫾ 0.8 0.4 ⫾ 0.05 112 ⫾ 27 177 ⫾ 13 54 ⫾ 7
16 ⫾ 2.7* 0.39 ⫾ 0.04 211 ⫾ 48 180 ⫾ 7 36 ⫾ 2†
12.5 ⫾ 2.5 0.37 ⫾ 0.05 173 ⫾ 38‡ 194 ⫾ 7 39 ⫾ 3
20.6 ⫾ 4.6† 0.58 ⫾ 0.06* 271 ⫾ 55† 197 ⫾ 14 37 ⫾ 2§
16.2 ⫾ 5.3 0.51 ⫾ 0.05 169 ⫾ 28‡ 191 ⫾ 12 47 ⫾ 5㛳
Data are means ⫾ SE. *P ⬍ 0.05, †P ⬍ 0.005 compared with lean control subjects before TZD treatment. ‡P ⬍ 0.05 compared with values before TZD treatment within groups. §P ⬍ 0.001 compared with lean control subjects before TZD treatment. 㛳P ⬍ 0.01 compared with values before TZD treatment within groups. DIABETES, VOL. 51, OCTOBER 2002
2969
EFFECT OF THIAZOLIDINEDIONES ON PLASMA ADIPONECTIN
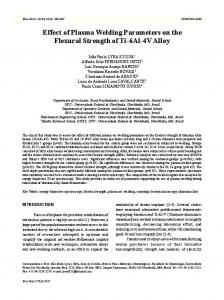
FIG. 1. Rd during the last 40 min of the 80 mU 䡠 mⴚ2 䡠 minⴚ1 hyperinsulinemic glucose clamps before (䡺) and after 3 months of 600 mg/day troglitazone (f) in 8 lean, 9 obese, and 10 type 2 diabetic subjects. Data are means ⴞ SE. ⴙⴙⴙ P < 0.001 compared with lean normal subjects. *P < 0.05, **P < 0.02 compared with levels within the same group before troglitazone treatment.
11.1 ⫾ 0.9 mmol/l, P ⬍ 0.005) but was unchanged in lean (4.8 ⫾ 0.1 vs. 4.8 ⫾ 0.1 mmol/l) and obese subjects (4.9 ⫾ 0.1 vs. 5.0 ⫾ 0.1 mmol/l). Consistent with previous experience, three of the diabetic subjects could be classified as nonresponders, defined as ⬍10% improvement in fasting plasma glucose after TZD treatment (responders 12.1 ⫾ 1.8 vs. 8.1 ⫾ 1.3 mmol/l, P ⬍ 0.005; nonresponders 12.7 ⫾ 1.3 vs. 12.2 ⫾ 0.9 mmol/l, P ⫽ 0.28). HbA1c was not significantly different after treatment in any of the groups (lean 5.4 ⫾ 0.1 vs. 5.8 ⫾ 0.2%, obese 5.4 ⫾ 0.2 vs. 5.8 ⫾ 0.2%, diabetic subjects 8.8 ⫾ 0.5 vs. 9.2 ⫾ 0.6%). Body weight. No significant change in body weight occurred after 12 weeks of TZD treatment in any group. Plasma insulin and lipid levels. Fasting insulin levels were significantly higher in the obese and diabetic subjects than in the lean control subjects (P ⬍ 0.05 and P ⬍ 0.005, respectively) (Table 2). After TZD therapy, insulin levels decreased in both obese and diabetic subjects and remained unchanged in the lean subjects. Taken as a whole group, fasting insulin was significantly lower (P ⫽ 0.02) after treatment.
Plasma triglyceride concentrations were higher in the diabetic subjects than in the lean control subjects (P ⬍ 0.01), as were NEFAs (P ⬍ 0.025) (Table 2). There was no statistically significant difference in total or HDL cholesterol levels between groups. After treatment with TZDs, triglyceride levels improved in the diabetic and obese subjects (P ⬍ 0.02), with an increase in HDL cholesterol in the diabetic group, whereas levels remained unchanged in the lean subjects. Insulin sensitivity. Mean plasma insulin levels during the last 30 min of the glucose clamps were similar before and after TZD treatment and did not differ among groups (baseline: lean 122 ⫾ 10, obese 131 ⫾ 6, diabetic subjects 129 ⫾ 7 mU/l; post-TZD: lean 119 ⫾ 9, obese 132 ⫾ 9, diabetic subjects 118 ⫾ 6 mU/l). As seen in Fig. 1, Rd during the pretreatment euglycemic clamp studies was lower in the diabetic subjects (3.4 ⫾ 0.5 mg 䡠 kg⫺1 䡠 min⫺1) than in the lean (12.3 ⫾ 0.4) or obese subjects (6.7 ⫾ 0.7) (P ⬍ 0.001 for both). After 12 weeks of treatment, Rd was significantly improved in the diabetic and obese groups (P ⬍ 0.05) but remained unchanged in
FIG. 2. Plasma adiponectin levels (g/ml) in 8 lean, 9 obese, and 10 type 2 diabetic subjects at baseline (䡺), 4 weeks (o), 8 weeks (f), and 12 weeks (s) of troglitazone (600 mg/day). *P < 0.0001. 2970
DIABETES, VOL. 51, OCTOBER 2002
J.G. YU AND ASSOCIATES
FIG. 3. Individual plasma adiponectin levels (g/ml) in lean (䡺), obese (E), and type 2 diabetic subjects ( ) at baseline and after 12 weeks of troglitazone (600 mg/day).
the lean subjects. Hepatic glucose output was completely suppressed during the glucose clamps in all groups and was not affected by TZD therapy. Effect of TZD treatment on adiponectin levels. Compared with lean control subjects (16.7 ⫾ 2.7 g/ml), baseline adiponectin levels were lower in the obese group (12.1 ⫾ 1.8) and further decreased in obese diabetic subjects (9.0 ⫾ 1.7), and the differences between the lean and diabetic subjects were highly significant (P ⬍ 0.01) (Fig. 2). After 1, 2, and 3 months of TZD treatment, adiponectin levels increased uniformly in all groups. As can be seen in Fig. 2, the drug effect to increase adiponectin levels was maximal at 1 month and persisted throughout the study. The effect was approximately twofold in all groups, and when all of the subjects were taken together, the average increase was 12.2 ⫾ 2.3 vs. 25.7 ⫾ 2.6 g/ml (P ⬍ 0.0001). Remarkably, adiponectin levels increased in each of the 27 subjects included in the study, indicating the uniformity and consistency of this effect (Fig. 3). It is also of interest that TZD treatment was fully effective at increasing adiponectin levels in the lean control subjects,
despite the fact that no other metabolic effects of TZDs were observed in these subjects. Effect of insulin on circulating adiponectin levels. The glucose clamp studies involve a 5-h infusion of insulin at 80 mU 䡠 m⫺2 䡠 min⫺1, which provided the opportunity to study the effects of insulin administration on adiponectin levels. As shown in Fig. 4, there was an ⬃20% decrease in adiponectin levels after insulin administration before TZD treatment in the lean (16.6 ⫾ 2.7 vs. 13.3 ⫾ 2.0 g/ml, P ⫽ 0.027), obese (11.9 ⫾ 2.3 vs. 9.9 ⫾ 1.8 g/ml, P ⫽ 0.004), and diabetic subjects (9.0 ⫾ 1.7 vs. 7.9 ⫾ 1.6 g/ml, P ⫽ 0.019). Overall, the mean values were 12.2 ⫾ 2.3 compared with 10.2 ⫾ 2.3 g/ml, before and after insulin administration, respectively. Repeated-measures ANOVA revealed that the effect of insulin administration on adiponectin levels was highly significant (P ⬍ 0.01). Interestingly, the insulin-induced decrease in adiponectin levels during the clamp was not observed after the 3-month TZD treatment period (P ⫽ 0.48). Studies in normal rats. To determine whether similar results were seen in normal rats, ACRP30 levels were
FIG. 4. Plasma adiponectin levels (g/ml) at basal (䡺) and at the end of a 5-h 80 mU 䡠 mⴚ2 䡠 minⴚ1 hyperinsulinemic glucose clamp before treatment (o) and plasma adiponectin levels at basal (f) and at the end of a 5-h 80 mU 䡠 mⴚ2 䡠 minⴚ1 hyperinsulinemic glucose clamp (s) after 12 weeks of troglitazone (600 mg/day); *P < 0.05, **P < 0.005. DIABETES, VOL. 51, OCTOBER 2002
2971
EFFECT OF THIAZOLIDINEDIONES ON PLASMA ADIPONECTIN
FIG. 5. A: ACRP30 concentrations in 3-monthold rats before (䡺) and after 2 weeks of troglitazone (f). B: ACRP30 concentrations before (䡺) and after insulin infusion (f) during a glucose clamp. *P < 0.03, **P < 0.05.
measured in 3-month-old male rats before and after 2 weeks of TZD treatment, and as summarized in Fig. 5, a 2.2-fold increase was observed. Glucose clamps were also performed in these animals (Fig. 5B). During the glucose clamp studies, Rd increased from basal values of 11.2 mg 䡠 kg⫺1 䡠 min⫺1 to insulin-stimulated values of 49.1 mg 䡠 kg⫺1 䡠 min⫺1, and this was associated with an ⬃50% reduction in circulating ACRP30 levels (Fig. 5B). Correlations. In the pretreatment state, adiponectin levels were positively correlated with Rd (r ⫽ 0.46, P ⬍ 0.01) and HDL cholesterol levels (r ⫽ 0.59, P ⬍ 0.001) and negatively correlated with fasting insulin (r ⫽ ⫺0.39, P ⬍ 0.05) and plasma triglyceride (r ⫽ ⫺0.61, P ⬍ 0.001). Similar statistically significant correlations were observed after TZD treatment. When the change in fasting adiponectin levels was plotted against the change in insulin sensitivity before and after TZD treatment, no statistically significant relationship was observed. 2972
DISCUSSION
Adiponectin is a member of the adipocytokine family of fat cell–secreted proteins. It is exclusively expressed in adipose tissue and circulates at relatively high (microgram per milliliter) concentrations. It shares sequence homology with human type VIII and X collagen and complement factor C1q and TNF-␣ (8,9,29,30), and the rodent form of this protein is called ACRP30. Although its exact function is not known, adiponectin/ACRP30 and/or the globular head portion of this protein may promote weight loss in mice (31), stimulate free fatty acid oxidation in muscle, enhance insulin sensitivity (32), and possess anti-inflammatory (33) and antiatherogenic properties (34,35). It has been reported that plasma levels of adiponectin are lower in obesity, type 2 diabetes, and coronary artery disease (21–23) and that adipose tissue ACRP30/adiponectin mRNA levels are decreased in obese ob/ob mice and DIABETES, VOL. 51, OCTOBER 2002
J.G. YU AND ASSOCIATES
obese humans (9). Circulating adiponectin levels are also inversely correlated to triglyceride and fasting insulin concentrations as well as the magnitude of insulin resistance (21,23,24). Caloric restriction in humans and mice resulted in higher levels of adiponectin (31), with a similar increase reported after weight loss induced by gastric surgery (36). Conversely, high-fat feeding leads to decreased ACRP30 secretion in rodents (24). Based on the above, it is apparent that ACRP30/adiponectin levels tend to be higher in states of insulin sensitivity and decreased in states of insulin resistance. Coupled with the findings that administration of adiponectin can lead to enhanced insulin action in vitro and in vivo in mice, it is possible that this peptide may play a physiologic role in maintaining normal insulin sensitivity and glucose homeostasis. To explore these ideas, we assessed the effect of TZD treatment in modulating the circulating adiponectin levels in lean, obese, and obese diabetic subjects. Previous reports have shown that TZD treatment can lead to an increase in adiponectin levels in subjects with normal and impaired glucose tolerance and patients with type 2 diabetes (37– 40). Our results confirm this finding and show that TZD treatment led to a uniform increase in adiponectin levels in each subject, and this effect was observed by 1 month of treatment and remained throughout the 3-month treatment period. When taken as a group, the increase in adiponectin levels was about twofold across all subjects. Since we did not obtain measurements before 1 month, our studies do not indicate the time of onset of the TZD effect on adiponectin levels. However, a recent study by Combs et al. (40) demonstrated an increase in adiponectin levels in normal subjects after only 14 days of treatment with rosiglitazone. This is supported by our studies in rats showing a similar increase after 2 weeks of TZD treatment. The uniformity of the effect of TZDs on adiponectin levels was striking. Thus, each individual subject displayed an increase, including the normal subjects, in whom no other metabolic effect of TZD treatment had been observed. Furthermore, it is well known that not all type 2 diabetic subjects respond to TZD therapy; in our studies, we found that three of the diabetic subjects did not show metabolic improvement with TZD treatment, consistent with previous reports (41– 43). Interestingly, in each of these TZD “nonresponders” (arbitrarily defined as subjects with ⬍10% decrease in fasting plasma glucose after treatment), an increase in adiponectin levels was observed. The mean increase was 10.5–22.3 g/ml in the nonresponders compared with 8.5–19.2 g/ml in the responders, indicating that the effect of TZD treatment to increase adiponectin levels was comparable, regardless of whether the subjects showed a glycemic or insulin-sensitizing effect of the drug. Although adiponectin administration has been shown to improve insulin sensitivity and lower glucose levels in mice and to be inversely correlated with the magnitude of insulin resistance, the fact that adiponectin levels increase in normal rats, lean subjects, and nonresponders indicates that adiponectin is unlikely to be the sole cause of TZD-induced insulin sensitivity. Since insulin resistance is associated with hyperinsulinemia, the relationship between adiponectin levels and insulin sensitivity also implies an inverse relationship DIABETES, VOL. 51, OCTOBER 2002
between adiponectin and insulin levels, and this was confirmed in the current studies. This raises the possibility that insulin might have an independent effect to modulate adiponectin production from adipocytes. During the glucose clamp studies in both humans and rats, we found that insulin infusion led to a decrease in adiponectin (or ACRP30) concentrations, consistent with the interpretation that insulin can exert an effect on adipocytes to decrease production and/or secretion of this adipocytokine. Thus, it is possible that the chronic hyperinsulinemia associated with insulin-resistant states leads to downregulation of ACRP30/adiponectin concentrations. This raises the idea that the effect of TZDs on adiponectin/ACRP30 levels are at least partly mediated by TZD-induced changes in insulin levels, which are secondary to the effect of TZDs to enhance insulin sensitivity. Although TZD-induced changes in insulin levels may partly explain the changes in adiponectin/ACRP30 levels observed in the current studies, they are unlikely to represent the complete effect of these agents, since in vitro studies have shown that TZDs can directly increase adipocyte ACRP30 mRNA. It is most likely that the effect of insulin to lower circulating adiponectin/ACRP30 levels involves inhibition of adipocyte secretion. Since blood concentrations fall from 20 to 50% (humans versus rats, respectively) after a few hours of insulin administration, these studies suggest that the circulating half-life of this adipocytokine is in the range of several hours. This rate of turnover would be consistent with a role for this protein as a regulator of metabolic processes. Clearly, it would be of important interest to determine the more detailed pharmacokinetics of this peptide as well as its regulatory controls. Since our results demonstrate a robust effect of TZD administration to increase circulating adiponectin levels, independent of the effects of these agents to produce insulin sensitization or any other metabolic effect, measurement of adiponectin levels in clinical studies may serve as a convenient biomarker for drug administration. It will be important to examine the dose-response effect of TZD administration on adiponectin levels as well as the early time course of this effect. ACKNOWLEDGMENTS
This work was supported by a research grant National Institutes of Health (DK 33651), the Administration San Diego Healthcare System Service, and the Whittier Institute for Diabetes. The authors thank Jacob Rabenstein for his technical assistance.
form the Veterans Research excellent
REFERENCES 1. Mohamed-Ali V, Pinkney JH, Coppack SW: Adipose tissue as an endocrine and paracrine organ. Int J Obes Relat Metab Disord 22:1145–1158, 1998 2. Hotamisligil GS: The role of TNF-␣ and TNF receptors in obesity and insulin resistance. J Intern Med 245:621– 625, 1999 3. White RT, Damm D, Hancock N, Rosen BS, Lowell BB, Usher P, Flier JS, Spiegelman BM: Human adipsin is identical to complement factor D and is expressed at high levels in adipose tissue. J Biol Chem 267:9210 –9213, 1992 4. Shimomura I, Funahashi T, Takahashi M, Maeda K, Kotani K, Nakamura T, Yamashita S, Miura M, Fukuda Y, Takemura K, Tokunaga K, Matsuzawa Y: Enhanced expression of PAI-1 in visceral fat: possible contributor to vascular disease in obesity. Nature Med 2:800 – 803, 1996 5. Friedman JM, Halaas JL: Leptin and the regulation of body weight in mammals. Nature 395:763–770, 1998 2973
EFFECT OF THIAZOLIDINEDIONES ON PLASMA ADIPONECTIN
6. Shimomura I, Hammer R, Ikemoto S, Brown MS, Goldstein JL: Leptin reverses insulin resistance and diabetes mellitus in mice with congenital lipoatrophy. Nature 401:73–76, 1999 7. Steppan CM, Bailey ST, Bhat S, Brown EJ, Banerjee RR, Wright CM, Patel HR, Ahima RS, Lazar MA: The hormone resistin links obesity to diabetes. Nature 409:307–312, 2001 8. Scherer PE, Williams S, Fogliano M, Baldini G, Lodish HF: A novel serum protein similar to C1q, produced exclusively in adipocytes. J Biol Chem 270:26746 –26749, 1995 9. Hu E, Liang P, Spiegelman BM: AdipoQ is a novel adipose-specific gene dysregulated in obesity. J Biol Chem 271:10697–10703, 1996 10. Henry RR: Thiazolidinediones. Endocrinol Metab Clin North Am 26:553– 573, 1997 11. Nagy L, Tontonoz P, Alvarez JGA, Chen H, Evans RM: Oxidized LDL regulates macrophage gene expression through ligand activation of PPAR␥. Cell 93:229 –240, 1998 12. Ricote M, Li AC, Willson TM, Kelly CJ, Glass CK: The peroxisome proliferator-activated receptor-gamma is a negative regulator of macrophage activation. Nature 391:79 – 82, 1998 13. Moore KJ, Rosen ED, Fitzgerald ML, Randow F, Andersson LP, Altshuler D, Milstone DM, Mortensen RM, Spiegelman BM, Freeman MW: The role of PPAR␥ in macrophage differentiation and cholesterol uptake. Nature Med 7:41– 47, 2001 14. Law RE, Goetze S, Xi XP, Jackson S, Kawano Y, Demer L, Fishbein MC, Meehan WP, Hsueh WA: Expression and function of PPAR␥ in rat and human vascular smooth muscle cells. Circulation 101:1311–1318, 2000 15. Clark RB, Bishop-Bailey D, Estrada-Hernandez T, Hla T, Puddington L, Padula SJ: The nuclear receptor PPAR␥ and immunoregulation: PPAR␥ mediates inhibition of helper T-cell responses. J Immunol 164:1364 –1371, 2000 16. Rosen E, Sarraf P, Troy AE, Bradwin G, Moore K, Milstone DS, Spigelman BM, Mortensen M: PPAR␥ is required for the differentiation of adipose tissue in vivo and in vitro. Mol Cell 4:611– 617, 1999 17. Tontonoz P, Hu E, Spigelman BM: Stimulation of adipogenesis in fibroblasts by PPAR␥2, a lipid-activated transcription factor. Cell 79:1147–1156, 1994 18. Olefsky JM: Treatment of insulin resistance with peroxisome proliferatoractivated receptor ␥ agonists. J Clin Invest 106:467– 472, 2000 19. Savage DB, Sewter CP, Klenk ES, Segal DG, Vidal-Puig A, Considine RV, O’Rahilly SO: Resistin/Fizz3 expression in relation to obesity and peroxisome proliferator-activated receptor-␥ action in humans. Diabetes 50: 2199 –2202, 2001 20. Way JM, Gorgun CZ, Tong Q, Uysal KT, Brown KK, Harrington WW, Oliver WR, Willson TM, Kliewer SA, Hotamisligil GS: Adipose tissue resistin expression is severely suppressed in obesity and stimulated by peroxisome proliferator-activated receptor gamma agonists. J Biol Chem 276:25651– 25653, 2001 21. Hotta K, Funahashi T, Arita Y, Takahashi M, Matsuda M, Okamoto Y, Iwahashi H, Kuriyama H, Ouchi N, Maeda K, Nishida K, Kihara S, Sakai N, Nakajima T, Hasegawa K, Muraguchi M, Ohmoto Y, Nakamura T, Yamashita S, Hanafusa T, Matsuzawa Y: Plasma concentrations of a novel, adipose-specific protein, adiponectin in type 2 diabetic patients. Arteriocler Thromb Vasc Biol 20:1595–1599, 2000 22. Arita K, Kihara S, Ouchi N, Takahashi M, Maeda K, Miyagawa J, Hotta K, Shimomura I, Nakamura T, Miyaoka K, Kuriyama H, Nishida M, Yamashita S, Okubo K, Matsubara K, Muraguchi M, Ohmoto Y, Funahashi T, Matzusawa Y: Paradoxical decrease of an adipose-specific protein, adiponectin, in obesity. Biochem Biophy Res Commun 257:79 – 83, 1999 23. Weyer C, Funahashi T, Tanaka S, Hotta K, Matsuzawa Y, Pratley RE, Tataranni A: Hypoadiponectinemia in obesity and type 2 diabetes: close association with insulin resistance and hyperinsulinemia. J Clin Endocrinol Metab 86:1930 –1935, 2001 24. Yamauchi T, Kamon J, Waki H, Terauchi Y, Kubota N, Hara K, Mori Y, Ide T, Murakami K, Tsuboyama-Kasaoka N, Ezaki O, Akanuma Y, Gavrilova O, Vinson C, Reitman ML, Kagechika H, Shudo K, Yoda M, Nakano Y, Tobe K, Nagai R, Kimura S, Tomita M, Froguel P, Kadowaki T: The fat-derived hormone adiponectin reverses insulin resistance associated with both lipoatrophy and obesity. Nature Med 7:941–946, 2001 25. Combs TP, Berg AH, Obici S, Scherer PE, Rosetti L: Endogenous glucose
2974
production is inhibited by the adipose-derived protein Acrp30. J Clin Invest 108:1875–1881, 2001 26. Desbuquois B, Auerbach GD: Use of polyethylene glycol to separate free and antibody bound peptide hormones in radioimmunoassays. J Clin Endocrinol Metab 33:732–738, 1971 27. Steele R: Influences of glucose loading and of injected insulin on hepatic glucose output. Ann N Y Acad Sci 82:420 – 430, 1959 28. Wolfe RR: Tracers in Metabolic Research: Radioisotope/Mass Spectrometry Methods. Alan R. Liss Inc., New York, 1984, p. 81–101 29. Maeda K, Okubo K, Shimomura I, Funahashi T, Matsuzawa Y, Matsubara K: cDNA cloning of a novel adipose-specific collagen-like factor, APM1 (adipose most abundant gene transcript 1). Biochem Biophys Res Commun 221:286 –289, 1996 30. Shapiro L, Scherer P: The crystal structure of a complement-1q family protein suggests an evolutionary link to tumor necrosis factor. Curr Biol 12:335–338, 1996 31. Berg AH, Combs TP, Du X, Brownlee M, Scherer PE: The adipocytesecreted protein Acrp30 enhances hepatic insulin action. Nature Med 7:947–953, 2001 32. Fruebis J, Tsao TS, Javorschi S, Ebbets-Reed D, Erickson MRS, Yen FT, Bihain BE, Lodish HF: Proteolytic cleavage product of 30-kDa adipocyte complement-related protein increases fatty acid oxidation in muscle and causes weight loss in mice. Proc Natl Acad Sci U S A 98:2005–2010, 2001 33. Yokota T, Oritani K, Takahashi I, Ishikawa J, Matsuyama A, Ouchi N, Kihara S, Funahashi T, Tenner AJ, Tomiyama Y, Matsuzawa Y: Adiponectin, a new member of the family of soluble defense collagens, negatively regulates the growth of myelomonocytic progenitors and the functions of macrophages. Blood 96:1723–1732, 2000 34. Ouchi N, Kihara S, Arita Y, Maeda K, Kuriyama H, Okamoto Y, Hotta K, Nishida M, Takahashi M, Nakamura T, Yamashita S, Funahashi T, Matsuzawa Y: Novel modulator of endothelial adhesion molecules: adipocytederived plasma protein adiponectin. Circulation 100:2473–2476, 1999 35. Ouchi N, Kihara S, Arita Y, Okamoto Y, Maeda K, Kuriyama H, Hotta K, Nishida M, Takahashi M, Muraguchi M, Ohmota Y, Nakamura T, Yamashita S, Funahashi T, Matsuzawa Y: Adiponectin, an adipocyte-derived plasma protein, inhibits endothelial NK-B signaling through a camp-dependent pathway. Circulation 102:1296 –1301, 2000 36. Yang WS, Lee WJ, Funahashi T, Tanaka S, Matsuzawa Y, Chao CL, Chen CL, Tai TY, Chuang LM: Weight reduction increases plasma levels of an adipocyte-derived anti-inflammatory protein, adiponectin. J Clin Endocrinol Metab 86:3815–3819, 2001 37. Maeda N, Takahashi M, Funahashi T, Kihara S, Nishizawa H, Kishida K, Nagaretani H, Matsuda M, Komuro R, Ouchi N, Kuriyama H, Hotta K, Nakamura T, Shimomura I, Matsuzawa Y: PPAR␥ ligands increase expression and plasma concentrations of adiponectin, an adipose-derived protein. Diabetes 50:2094 –2099, 2001 38. Hirose H, Kawai T, Yamamoto Y, Taniyama M, Tomita M, Matsubara K, Okazaki Y, Ishii T, Oguma Y, Takei I, Saruta T: Effects of pioglitazone on metabolic parameters, body fat distribution and serum adiponectin levels in Japanese male patients with type 2 diabetes. Metabolism 51:314 –317, 2002 39. Yang WS, Jeng CY, Wu TJ, Tanaka S, Funahashi T, Matsuzawa Y, Wang JP, Chen CL, Tai TY, Chuang LM: Synthetic peroxisome proliferator-activated receptor-␥ agonist, rosiglitazone, increases plasma levels of adiponectin in type 2 diabetic patients. Diabetes Care 25:376 –380, 2002 40. Combs TP, Wagner JA, Berger J, Doebber T, Wang WJ, Zhang BB, Tanen M, Berg AH, O’Rahilly S, Savage DB, Chatterjee K, Weiss S, Larson PJ, Gottesdiener KM, Gertz BJ, Charron MJ, Scherer PE, Moller DE: Induction of adipocyte complement-related protein of 30 kilodaltons by PPAR-␥ agonists: a potential mechanism of insulin sensitization. Endocrinology 143:998 –1007, 2002 41. Suter SL, Nolan JJ, Wallace P, Gumbiner B, Olefsky JM: Metabolic effects of new oral hypoglycemic agent CS-045 in NIDDM subjects. Diabetes Care 15:193–203, 1992 42. Frias JP, Yu JG, Kruszynska YT, Olefsky JM: Metabolic effects of troglitazone therapy in type 2 diabetic, obese and lean normal subjects. Diabetes Care 23:64 – 69, 2000 43. Iwamoto Y, Kosaka K, Kuzuya T, Akanuma Y, Shigeta Y, Kaneko T: Effects of troglitazone. Diabetes Care 19:151–156, 1996
DIABETES, VOL. 51, OCTOBER 2002