The Effects of Filtering Malicious Traffic under DoS Attacks Chinawat Wongvivitkul
Sudsanguan Ngamsuriyaroj
IT Security Department Gosoft (Thailand), CP Tower 1 313 Silom Road, Bangkok 10500 Thailand
Department of Computer Science Faculty of Science, Mahidol University Rama 6 Road, Bangkok 10400 Thailand
chinawatwon@ gosoft.co.th
[email protected]
ABSTRACT Denial-of-Service (DoS) attacks typically generate huge amount of adverse traffic to a target server and make the server unavailable for services. Several works had put lots of efforts to find novel and effective techniques to detect and prevent such attacks. However, most studies were conducted using offline data or via simulation. Only a few studies address the issues of server survivability when under DoS attacks and perform real experiments to measure the effectiveness of filtering such malicious traffic since capturing and analyzing real attacking traffic on the fly would be an enormous task. This paper proposes a model to measure the effectiveness of filtering malicious traffic while actual attacks aim at a target server. The model performs a simple anomaly detection using the rates of input traffic which is classified into normal, suspicious and malicious traffic based on the pre-defined threshold values. If the input traffic is regarded as suspicious or malicious, the model will substantially drop part of the input traffic to an acceptable level so that only the small amount of traffic is allowed to pass and reach the target server. As a result, the server survives the attacks. We implemented the proposed model in Snort In-line on which we modified the traffic analysis module for classifying input traffic. We also added a new traffic control module for dropping malicious traffic. In the experiments, we generated real attacks on a web server with various attacking rates and filtering rates, and measured the timeout of the target server while a normal client periodically accessed the server. The timeout of the server indicates the server survivability and in turn tells us the effectiveness of filtering rates applied. The experimental results show that if the filtering rate is higher, the server will have the longer timeout. In addition, if the attacking rate is higher, the server will crash faster, or have the shorter timeout. In conclusion, the proposed work shows the effectiveness of traffic filtering to the survivability of a target server.
Keywords Server Survivability, DoS Attacks, Traffic Analysis, Intrusion Detection, Intrusion Prevention.
Copyright is held by the authors Asia Pacific Advanced Network 2007, 27-31 August 2007, Xian, China. Network Research Workshop 2007, 27 August 2007, Xian, China.
1. INTRODUCTION The Internet has now brought many good things to our daily life; however, it has been frequently abused by people mostly with hostile intentions, and we have been under various kinds of attacks such as viruses, worms and commonly a bunch of spam mails every day. One well-known example is the 2001 attack of Code Red worm [13] which exploited buffer overflows of IIS web services. As a result, most Internet services are now guarded with several security mechanisms such as firewalls, antivirus software, and anti-spammers. Among all attacks, the denial-of-service (DoS) attack is one of the attacks rather difficult to detect and prevent since they exploit regular services, and overwhelm such services with tremendous malicious traffic. If attacks are simultaneously launched from several sources destined to the same target, they are called Distributed DoS. The software for detecting and preventing DoS attacks is called Intrusion Detection and Prevention system, or IDS/IPS in short. Currently, several commercial IDS/IPS software such as Stonegate [9] and Netscreen [4] have been widely used while some open source IDS/IPS such as Snort In-line [8] and Bro [23] have been developed and mostly adopted in small networks. In general, two common mechanisms used in IDS/IPS software are signature and anomaly detection. Signature detection applies known attacking patterns collected from the past attacks to identify the pattern of incoming traffic. Anomaly detection learns and classifies incoming traffic to be normal or malicious traffic based on specific statistical behavior of the traffic [14, 15, 17, 18, 22], or intelligent techniques such as neural networks [27] or mining [19, 20] are applied. Signature detection performs well for detecting known attacks, but could not recognize unknown attacks. It also works fast as all signatures are kept in memory. On the other hand, anomaly detection could recognize some unknown attacks. But, the techniques are likely complicated and do not perform well since statistics of some specific traffic patterns must be collected and analyzed before such patterns are classified. As a result, the recognition would be delayed, and detecting malicious traffic could not be done on the fly. In addition, most research studies evaluated their detection techniques off-line, via a simulation tool, or replaying traces collected from the real environment. This paper proposes a model to measure the effectiveness of filtering DoS malicious traffic aimed at a target server in real time. To determine whether incoming traffic contains an attack, we implement a simple and fast anomaly detection that computes the arrival rate of incoming traffic on the fly. From the computed arrival rate, the incoming traffic is classified as normal, suspicious
1
or malicious traffic based on predefined thresholds. The model also performs packet filtering on suspicious and malicious traffic in order to reduce attacking traffic reaching at the target server. If the bandwidth of the attacking traffic is decreased at a certain level, the target server will survive the attack. Thus, our interest is to study how much the traffic should be filtered for the server to survive the attack. Initially, we conducted preliminary experiments to measure the response time of a request to the server, and expected that the response time to the server would be greater when the attacking rate was higher. However, we could not measure the response time of a request when the server was under attacks at all since the server had already crashed. Thus, we must find a way to measure how long the server survives an attack since it would be an indicator of the effectiveness of the filtering. Based on our observation, we decide to measure the server timeout since when the server has been incessantly attacked, at some point of time, it can no longer accept any new request due to exhausted resources, and will crash. In our experiments, we measure the server timeout at different attacking rates and filtering rates. Based on the best of our knowledge, no work has been done on conducting real DoS attacks and measuring the server timeout.
3. PROPOSED WORK We propose a model to measure the effectiveness of filtering malicious traffic when the web server is under DoS attacks. The model uses simple anomaly detection for traffic analysis, and a filtering technique for traffic control. Thus, it consists of two phases: detection analysis and traffic control. Detection analysis performs intrusion detection based on the statistics of incoming traffic collected. If the input traffic rate goes beyond some specific threshold, it will be considered as suspicious or malicious, and part of it will be dropped by the traffic control phase. As a result, the amount of attacking traffic reaching the target server will be substantially reduced, and the server is allowed to continue giving services. We measure the effectiveness of the filtering to the survivability of the server via the server timeout with various attacking and filtering rates. The overview of the proposed model is shown in Figure 1, and the details of each phase are explained in the next two sections.
The rest of the paper is organized as follows. Section 2 describes some related work. Section 3 presents the proposed work. Section 4 explains the implementation of the proposed model. Section 5 describes the experiments and discusses the results. Section 6 gives the conclusions as well as the suggestions for future work.
2. RELATED WORK Most IDS mechanisms are relied on network monitoring tools such as tcpdump [10], ethereal [1], MRTG [3], and ntop [6, 12]. They captured all packets and analyzed packet and network statistics. In addition, most patterns are known as signatures or rules as implemented in Snort [7, 24], and Bro [23]. On the contrary, anomaly detection looks for abnormal traffic patterns. Several studies analyzed traffic streams using data mining [19, 20], examined traffic statistical behavior [25], and studied normal traffic profiles [14, 22, 27]. For intrusion prevention, many studies focused on dropping malicious traffic when traffic patterns were matched with some rules [2], the bandwidth was beyond some thresholds [15, 18], or blocking the traffic such that it could not reach to the server at all [26]. Research studies on server survivability have recently gained lots of attentions. A DDoS defense system [28] was designed to protect legitimate traffic from being attack based on the real source IP addresses of packets. It also fairly allocated resources among clients to prevent attackers from consuming resources too much. But, the model was evaluated using the ns-2 simulator [5]. The work in [21] proposed two queuing models to simulate packet delay jitter and packet lost under DoS attacks. It also investigated how the attacks degrade the system performance quantitatively. Finally, the system in [16] was proposed to block, evade and react to various attacks using several security and survivability mechanisms in an automated and coordinated fashion. Their results showed that the ability for successful survival increased substantially when the responses were coordinated.
Figure 1 Overview of the Proposed Model
3.1 Detection Analysis Phase This phase analyzes incoming packets and classifies those packets according to their arrival rates. For packet analysis, the information of all incoming packets is kept in a data structure, called In_packet, which contains five packet attributes: arrival time, source IP, destination IP, source port and destination port. Such packet information is then statistically analyzed and kept in another structure, called Stat_info, having the following attributes: the arrival time of the first packet, the arrival time of the latest packet, source IP, destination IP, service port, total number of packets and packet status. The format and an example of packet statistics kept in Stat_info are given below, while Figure 2 depicts the packet flow within detection analysis. Format : [yyyymmddHHMMss] [yyyymmddHHMMss] [source ip] [destination ip] [service port] [total packet] [status {Normal, Suspicious, Malicious}] Example : 20050301140933 20050301140934 10.22.1.30 10.22.1.1 80 1000 Suspicious (Packets first arrived: 3/1/2005 at 14:09:33; last arrived 3/1/2005 at 14:09:34; from: 10.22.1.30, to: 10.22.1.1, Port: 80, total:1000 packets, status: suspicious.) Based on packet statistics in Stat_info, the traffic arrival rate in packets per second (pps) from one source IP to one service port is computed. Consequently, the traffic status is determined as normal, suspicious, and malicious. The classification uses two threshold values, say x and y, for the following criteria: •
Normal Packet: Packet arrival rate is less than x pps. 2
• •
Suspicious Packet: Packet arrival rate falls between x and y pps. Malicious Packet: Packet arrival rate is more than y pps.
4. IMPLEMENTATION The implementation of the proposed model focuses on HTTP traffic only. The system configuration shown in Figure 4 consists of the modified Snort in-line, a web server, a set of attackers, and one legitimate user to monitor the server. The original Snort In-line [7] has four main modules: packet capture/decode engine, detection engine, output engine, and alerts/log. Our model modifies the packet capture/decode engine module to store packet information. We also modify the detection engine module to classify incoming packets into normal, suspicious and malicious based on the input traffic rate. In addition, the control engine module is inserted between detection engine and output engine to redirect traffic to different paths according to its status. Finally, we modify the output engine module to do traffic shaping by filtering suspicious and malicious traffic. Figure 5 illustrates the traffic flow in our modified Snort In-line.
Figure 2 Packet Flow in Detection Analysis Note that the threshold values are pre-determined by our preliminary experimental results. These thresholds could be varied from one system to another.
3.2 Traffic Control Phase This phase is designed for controlling the amount of outgoing traffic in such a way that the amount of attacking traffic would be reduced before reaching the target server. After packet status is determined, individual packets would be redirected to different paths. Packets with normal status are allowed to reach the target server with unlimited bandwidth. Hence, legitimate users could use the services as usual. Packets with suspicious status are considered as moderate attacks, and part of them are sent to the traffic shaping module to be filtered while others will reach the target server. Thus, the bandwidth of suspicious traffic would be greatly reduced. Finally, all packets with malicious status will be dropped out of the system before having a chance to attack the target server. Filtering traffic in the traffic shaping module is considered as the prevention mechanism since it would reduce the suspicious and malicious traffic substantially to a level that allows the target server to survive the attack. The amount of reduced traffic depends on the applied filtering rate. For example, if the filtering rate is 1/100, only 1 packet is allowed to reach the server while other 99 packets will be dropped. The packet flow within the traffic control phase is illustrated in Figure 3.
Figure 3 Packet Flow in Traffic Control
Figure 4 System Architecture in Our Implementation
Figure 5 Traffic Flow in the Modified Snort In-line The details of the Snort In-line modifications are as follows. (1) The packet capture/decode engine module decodes packets and stores packet information in In_packet structure. We add Input_traffic function in “detect.c” for this purpose. (2) The simple anomaly detection is incorporated into the detection engine module by adding the P_analysis function in “snort.c”. At every 30 packets, this function will compute the average input traffic rate in pps for a particular set of IP addresses and ports. The computed rate is then compared with the three predefined threshold values given in Table 1 below, and the traffic is classified as normal, suspicious or malicious. Finally, the packet statistics is updated in Stat_Info structure. Note that these thresholds are obtained during our preliminary experiments, and only suite to our system configuration. 3
Table 1 Pre-determined Traffic Rate Thresholds Packet Type Normal
Traffic Rate Threshold (pps) < 65
Suspicious
65 - 1500
Malicious
> 1500
(3) The control engine module is added for redirecting the classified traffic to the destination. Normal traffic will be sent to the target server whereas suspicious traffic will be sent to the traffic shaping module. Malicious traffic is dropped by a specific rule in Snort In-line that says to drop any traffic containing a particular port, say 20000. Thus, we do not need to implement a “dropping packets” module. For this purpose, the p_control function is added in “snort.c”. (4) Traffic shaping module is implemented in the output engine module by dropping the number of suspicious packets according to its arrival rate. The remainder of those packets is sent to the target server. Similarly, the dropping rule in Snort In-line is applied by having all suspicious packets’ destination port changed to 40000. For this purpose, drop_suspicious and drop_malicious functions are added in “snort.c”.
5. EXPERIMENTS AND RESULTS Our experiments are conducted on slow machines since when we tried on faster machines, the resulting server timeout does not distinct under different attacking rate, and they are too fast to measure accurately in second. Table 2 displays hardware and software configurations used in our experiments.
Table 2: Hardware and Software Configurations
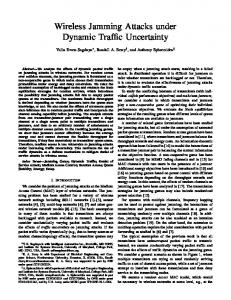
it is converged to nearly a constant when the attacking rate becomes over 400 pps
5.2 Server Timeout with Traffic Control We have two experiments: one with only one attacker and the other with three simultaneous attackers. Each attacker will send DoS traffic to the server at different attacking rates. At the same time, the modified Snort In-line will drop some DoS packets at different filtering rates. Again, the server timeout is measured to see the effects of attacking and filtering.
Figure 6 Server Timeout without Filtering under Different Attacking Rates (a) Under One Attacker In this experiment, the server timeout is measured when the attacker generates various attacking rates while the filtering rate is fixed at 1/1000. The results in Figure 6 are plotted together with the results of this experiment as shown in Figure 7. As we can see that the server survives much longer than the previous experiment. Another significant observation is that the filtering rate must be really high for the server to survive the attack. Moreover, we also apply various filtering rates of 1/100, 1/250, 1/500, 1/750, and 1/1000 for traffic with different attacking rates. The results shown in Figure 9 indicate that, at the same attacking rate, the server survives longer at the high filtering rate than at the low filtering rate. Furthermore, the server timeout decreases faster at high filtering rate than that at low filtering rate. However, they are all converged to some certain values. Thus, these results imply that high filtering rate has a significant impact to the server timeout.
In every experiment, a legitimate user will make a request to a web server at every 3 second while one or more attackers generate attacking traffic to the server until the server is down and becomes unavailable for the legitimate user. The duration of the timeout is from the start of an experiment until the server is down. An attack will last for about five minutes and there is no other traffic in the system. In this paper, we conduct three experiments described in details as follows.
5.1 Server Timeout without Traffic Control This experiment measures the timeout of the target server when it has been under attacks until it becomes unavailable to provide services to the legitimate user. There is no traffic control in this experiment. The server is attacked with different attacking rates as the results are shown in Figure 6. The results show that the server timeout happened very fast when the attacking rate increases, and
Figure 7 Server Timeout with and without Filtering under Different Attacking Rates 4
(b) Under Three Attackers In this experiment, there are three attackers generating simultaneous DoS traffic to the web server at the same rate. The attacking rate generated by each attacker is varied from 50, 100, 150, 200, and 250 pps. In addition, various filtering rates of 1/100, 1/250, 1/500, 1/750, and 1/1000 are applied for each attacking rate. The results shown in Figure 9 are similar to those of one attacker except that the falling rate of server timeout becomes faster with higher attacking rates. Again, the higher filtering rate, the longer the server survives for every attacking rate. In addition, we conducted another experiment having three attackers generating DoS traffic to the web server at different rates. The results are similar to those with the same attacking rate.
mechanism, and illustrates the effectiveness of the intrusion prevention as well. The timeout also shows the effects on the server survivability. Intuitively, the timeout would be shorter when the attacking rates increase. But, our experimental results demonstrate how fast the timeout is quantitatively degraded in real time when the real experiments are conducted. Even though a set of slow machines are used, we believe that similar trends of experimental results for faster machine with large memory would be obtained as well. 120 100 80 60 40 20 0
Timeout (Sec.)
1/45
1/40
1/30
1/20
1/10
Filtering Rate
Figure 10 Server Timeout of One Attacker with New OS
Figure 8 Server Timeout of One Attacker
In addition, this work implements a simple anomaly detection mechanism on the fly by just computing the arrival rate of the input traffic, and the traffic can be easily classified based on a predefined thresholds. Thus, we show that anomaly detection is possible and fast without complicated mechanisms. This work also illustrates simple intrusion prevention by dropping unwanted traffic. We also investigate how much the traffic should be filtered to allow the server survived. The results indicate that the server timeout falls down rapidly when the attacking rate increases, and higher filtering rate always gives the server survive longer than lower filtering rate. In addition, we found that the traffic filtering rate must be very high for the server to survive the attack. In other words, very small percentage, say 0.1 to 1%, of packets are allowed to pass. Interesting issues possible for future work include: (1) implementing adaptive filtering rates within the packet analysis module, and (2) running these experiments on faster machines and using the latest version of Linux. We hope that the results may lead to the implementation of an efficient IDS in a real system.
7. ACKNOWLEDGMENTS
Figure 9 Server Timeout of Three Attackers
5.3 Server Timeout with new OS In this experiment, we use Linux Redhat 7.3 having the kernel version 2.4.18-3 as the operating system at the web server. There is only one attacker generating a fixed attacking rate of 500 pps, but having high filtering rates of 1/45 to 1/10. The results shown in Figure 10 illustrate that the newer version of Linux allows the server to survive the attack longer as the high filtering rate is applied.
6. CONCLUSIONS This paper focuses on measuring the effectiveness of filtering traffic when the server is under DoS attacks. The timeout of the server is an essential indicator to the effectiveness of the filtering
We would like to express our appreciations to Mahidol University Computing Center for providing supporting equipments used in the experiments.
8. REFERENCES [1] [2] [3] [4] [5] [6] [7] [8] [9] [10] [11]
Ethereal. http://www.ethereal.com Honeynet. http://www.honeynet.org MRTG. http://www.mrtg.org/ Netscreen. http://www.juniper.net/ ns-2 Network Simulator. http://www.isi.edu/nsnam/ns/ ntop. http://www.ntop.org/ Snort. http://www.snort.org/ Snort-inline. http://snort-inline.sourceforge.net/ Stonegate. http://www.stonesoft.com/ tcpdump. http://www.tcpdump.org Atighetchi M., el.al., Adaptive Cyberdefense for Survival and Intrusion Tolerance, IEEE Internet Computing, NovDec 2004 5
[12] Deri L., Carbone R., and Suin S., Monitoring Networks Using ntop. Proceeding of the 2001 IEEE/IFIP International Symposium on Integrated Network Management, May 2001. [13] Houle K.J. and Weaver G.M., Trends in Denial of Services Attack Technology. CERT Coordination Center, Camegie Mellon University, October 2001. [14] Hwang K, Chen Y, and Liu H. Defending Distributed Systems Against Malicious Intrusions and Network Anomalies. Proceedings of 19th IEEE International Parallel and Distributed Processing Symposium, April 2005. [15] Kashiwa D, Chen E.Y. and Fuji H. Active Shaping: A Countermeasure Against DDoS Attacks. Proceedings of 2nd European Conference on Universal Multiservice Networks; April 2002. [16] Keromytis A., et.al., A Holistic Approach to Service Survivability, Proceedings of the ACM Workshop on Survivable and Self-Regenerative Systems, October 2003. [17] Lan K., Hussain A. and Dutta D., Effect of Malicious Traffic on the Network, Proceedings of Passive and Active Measurement Workshop, April 2003. [18] Lau F, Rubin S.H., Smith M.H. and Trajkovic L., Distributed Denial of Service Attacks. Proceedings of IEEE International Conference on Systems, Man, and Cybernetics, October 2000. [19] Lee W., Stolfo S.J., and Mok K., Mining in a Data-Flow Environment: Experience in Network Intrusion Detection, Proceedings of the 5th ACM SIGKDD, August 1999. [20] Lee W. and Stolfo S.J., A Framework for Constructing Features and Models for Intrusion Detection Systems, ACM
[21]
[22]
[23]
[24]
[25]
[26]
[27]
[28]
Transactions in Information and System Security, 3(4), November 2000. Long M., Wu C-H, and Hung J.Y., Denial of Service Attacks on Network-Based Control Systems: Impact and Mitigation, IEEE Transactions on Industrial Informatics, 1 (2), May 2005. Mahoney M.V., Network Traffic Anomaly Detection Based on Packet Bytes. Proceedings of ACM Symposium on Applied Computing, March 2003. Paxson V, Bro: A System for Detecting Network Intruders in Real-Time. Proceedings of the 7th USENIX Security Symposium; January 1998. Roesch M, Snort–Lightweight Intrusion Detection for Networks. Proceedings of 13th LISA: Systems Administration Conference; November 1999. Staniford S., Hoagland J.A. and McAlerney J.M., Practical Automated Detection of Stealthy Portscans. Journal of Computer Security, 1(1-2), 2002. Sterne D., et. al., Autonomic Response to Distributed Denial of Service Attacks. Proceedings of the 4th International Symposium on Recent Advances in Intrusion Detection, October 2001. Taylor C. and Alves-Foss J. NATE: Network Analysis of Anomalous Traffic Events – A Low-Cost Approach. Proceedings of the ACM workshop on New Security Paradigms, September 2001. Xu J. and Lee W., Sustaining availability of Web Services under Distributed Denial of Service Attacks, IEEE Transactions on Computers, 52(2), February 2003.
6