The effects of neural synchronization and peripheral compression on the acoustic-reflex thresholda) Matthias Mu¨ller-Wehlaub) Medizinische Physik, Universita¨t Oldenburg, D-26111 Oldenburg, Germany
Manfred Mauermann Medizinische Physik, Universita¨t Oldenburg, D-26111 Oldenburg, Germany
Torsten Dau Centre for Applied Hearing Research, Ørsted•DTU, Technical University of Denmark, DK-2800 Lyngby, Denmark
Birger Kollmeier Medizinische Physik, Universita¨t Oldenburg, D-26111 Oldenburg, Germany
共Received 29 June 2004; revised 14 January 2005; accepted 18 January 2005兲 This study investigates the acoustic reflex threshold 共ART兲 dependency on stimulus phase utilizing low-level reflex audiometry 关Neumann et al., Audiol. Neuro-Otol. 1, 359–369 共1996兲兴. The goal is to obtain optimal broadband stimuli for elicitation of the acoustic reflex and to obtain objective determinations of cochlear hearing loss. Three types of tone complexes with different phase characteristics were investigated: A stimulus that compensates for basilar-membrane dispersion, thus causing a large overall neural synchrony 共basilar-membrane tone complex—BMTC兲, the temporally inversed stimulus 共iBMTC兲, and random-phase tone complexes 共rTC兲. The ARTs were measured in eight normal-hearing and six hearing-impaired subjects. Five different conditions of peak amplitude and stimulus repetition rate were used for each stimulus type. The results of the present study suggest that the ART is influenced by at least two different factors: 共a兲 the degree of synchrony of neural activity across frequency, and 共b兲 the fast-acting compression mechanism in the cochlea that is reduced in the case of a sensorineural hearing loss. The results allow a clear distinction of the two subjects groups based on the different ART for the utilized types and conditions of the stimuli. These differences might be useful for objective recruitment detection in clinical diagnostics. © 2005 Acoustical Society of America. 关DOI: 10.1121/1.1867932兴 PACS numbers: 43.66.Nm, 43.64.Ri, 43.64.Ha, 43.64.Jb 关BLM兴
I. INTRODUCTION
The acoustic reflex is a contraction of the middle-ear muscles induced by an intense auditory stimulus. Stimulation on either the ipsi- or the contralateral side should result in bilateral muscle contraction in a normal system. Investigations indicate that the main purpose of the reflex is to serve as an attenuator for low-frequency body noise 共Simmons, 1964; Katz, 1977; Gelfand, 1998兲. It is believed that, of the two middle-ear muscles in humans, only the stapedius muscle contracts in response to sound as an acoustic reflex 共Borg, 1973; Jerger and Northern, 1980兲. The reflex elicitation is normally measured acoustically by means of the middle ear’s impedance change due to the middle-ear muscle contraction and hence the stiffening of the ossicular chain 共Metz, 1951; Lilly, 1984兲. Detection of the reflex elicitation and assessment of its parameters are commonly used for clinical diagnostics of the hearing system. Deviations of the acoustic reflex threshold, for example, are used as an indicator for neural lesions affecting any portion of the reflex arc a兲
Parts of this study were presented at the 27th Midwinter Research Meeting of the Association for Research in Otolaryngology 2004 in Daytona Beach, Florida 关Mu¨ller-Wehlau et al., Abstract No. 913, p. 309兴. b兲 Author to whom correspondence should be addressed. Electronic mail:
[email protected] 3016
J. Acoust. Soc. Am. 117 (5), May 2005
Pages: 3016 –3027
central to the cochlea 共Clemis, 1984兲. The pure-tone ART remains almost unaffected by sensorineural hearing loss up to 60 dB 共Metz, 1951; Kawase et al., 1997兲. Generally, the ART decreases with increasing bandwidth of the stimulus eliciting the reflex 共Gorga et al., 1980兲, similarly to the effect of loudness summation in perception. In cases of severe sensorineural or conductive hearing loss, the ART often exceeds the maximal stimulus level of 100 dB HL applied by most impedance bridges. Lower detection thresholds would be preferable, e.g., to make ART measurements usable in subjects with acute auditory damage. The main goal of the current study was to find an optimal broadband stimulus for low-level elicitation of the ART. Therefore, we adapted a stimulus that is optimized for the measurement of auditory brainstem responses 共ABR兲. Dau et al. 共2000兲 demonstrated a significant gain of wave-V amplitude of ABR compared to click stimuli by using a phaseoptimized chirp stimulus 共BMchirp兲 that compensates for basilar-membrane travel-time differences across frequency, and thus results in a highly synchronized neural excitation. The gain of neural synchronization is reflected in higher stations of the neuronal pathway like the ventral cochlear nuclei 共VCN兲 and the superior olivary complex 共SO兲, where discharge timing is correlated with cochlear partition motion 共Shore et al., 1987; Scherg and Cramon, 1985兲. A stimulus
0001-4966/2005/117(5)/3016/12/$22.50
© 2005 Acoustical Society of America
Downloaded 29 Jun 2010 to 192.38.67.112. Redistribution subject to ASA license or copyright; see http://asadl.org/journals/doc/ASALIB-home/info/terms.jsp
very similar to the chirp stimulus that was optimized for ABR measurements was tested here to reduce the ART. This seems reasonable since the afferent component of the neural pathway of the acoustic reflex can be assumed to follow almost the same path as the sources of ABR. The reflex arc comprises, among other stations, the auditory nerve 共N. VIII兲, the VCN, and the medial nucleus of the SO, before it turns back via the facial nerve 共N. VII兲 to the ear. Therefore, a larger excitation of certain nuclei involved in ABR measurements due to the use of phase-optimized stimulation may be accompanied by a reduction of the ART. The hypothesis tested in the present study was that the chirp stimulus suggested by Dau et al., or a variant of it, may represent an ideal stimulus also for ART measurement due to the increased synchrony of the neuronal excitation. In the following, we refer to this chirp stimulus as the BMchirp. Instead of using single BMchirps, specifically designed tone complexes were used in the present study. These basilar-membrane tone complexes 共BMTC兲 have essentially the same phase characteristics as the original BMchirps, but allow an easier analysis of the residual signal for reflex detection than the original chirps. In addition to the measurements using the BMTC stimuli, corresponding measurements were done with the temporally inverted BMTC tone complexes 共iBMTC兲. The expectation was that the gain due to neural synchronization using the BMTC stimuli would result in a low ART, while the excitation would be highly desynchronized using the iBMTC stimuli, thus resulting in a much higher ART. As a reference, a set of noise-like stimuli was tested consisting of tone complexes with the same magnitude spectrum as the BMTC and iBMTC but with random phase components. Compared to the former stimuli these random-phase tone complexes 共rTC兲 were expected to produce an ART that lies between those obtained with the BMTC and the iBMTC. However, other aspects besides neural synchronization may also be important for ART determination. For example, effects of peripheral compression due to the different internal representations of the stimuli on the BM may play a role. Kubli et al. 共2000兲 measured the acoustic reflex with positive and negative Schroeder-phase tone complexes 共Schroeder, 1970兲. They explained the differences of ART for these two types of stimuli by the different internal representations at the output of cochlear filtering. The internally stronger modulated positive Schroeder-phase stimuli (S⫹) are supposed to be more affected by fast-acting compression on the BM—thus resulting in increased ARTs—than the negative Schroeder-phase stimuli (S⫺), which produce a flat internal envelope. In several psychoacoustical detection experiments 共e.g., Kohlrausch and Sander, 1995; Lentz and Leek, 2001; Oxenham and Dau, 2001, 2004; Summers and Leek, 1998兲, the differences of internal representations produced by the Schroeder tone complexes with opposing phase have also been investigated. In these studies, modified Schroeder-phase harmonic tone complexes with different phase curvature showed a different efficiency in masking according to their different temporal modulation within the local auditory filters. These different internal representations are presumably also affected by the compressive characteristics of the BM processing and result in perceptional differences 共e.g., CarJ. Acoust. Soc. Am., Vol. 117, No. 5, May 2005
lyon and Datta, 1997; Summers and Leek, 1998; Oxenham and Dau, 2004兲. A further variable affecting the ART could be the influence of temporal integration of the stimulus. Although various studies have investigated factors that act as a trigger that elicit the acoustic reflex 共Kawase et al., 1998; 1997; Gorga et al., 1980兲, it is not entirely clear whether signal information is integrated within a certain time frame, or whether the peak amplitude, power, or loudness of the stimulus is appropriate to describe the internal threshold of ART elicitation. In order to test the role of temporal integration and peripheral compression in the current study, the peak-to-rms ratio was varied within a stimulus time frame of about 100 ms. In addition, experiments were carried out in normal-hearing 共NH兲 and hearing-impaired 共HI兲 subjects to investigate the influence of the compressive mechanisms on the BM. II. MEASUREMENT PARADIGMS AND DATA ANALYSIS A. Low-level reflex audiometry „LLRA…
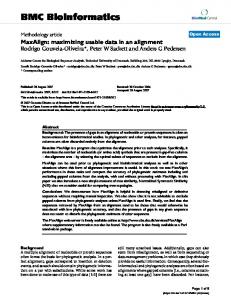
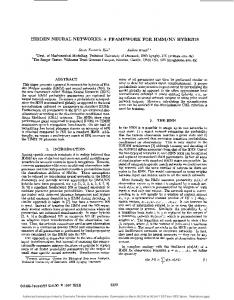
To obtain improved ART measurements, i.e., low ART thresholds, we use a method suggested by Neumann et al. 共1996兲, called low-level-reflex audiometry 共LLRA兲. For tone pulses, this method is more sensitive than the conventional paradigm 共Tolsdorf et al., 2004兲. Also, the short stimulation time used in this method is more comfortable for the subjects than the stimulation used in the common method. This is especially important since the acoustical stimulation in this study was carried out with levels up to 103 dB SPL. The LLRA uses the same measurement paradigm and equipment as typically employed for the recording of otoacoustic emissions. In this method, rather than using two signals at different frequencies 共the evoking stimulus and a continuous test tone—mostly at 226 Hz兲 as commonly used, a stimulus consisting of two identical short pulses is used to elicit and detect the reflex 关see Figs. 1共a兲 and 共d兲兴. The technique is based on the following principles: If the reflex is elicited during the first stimulus pulse and holds, the eardrum impedance has changed during the presentation of the second pulse. This change of impedance causes a difference between the recorded time signal of the first and second pulse within the sealed ear canal. Since the change in impedance due to the acoustic reflex has a latency of some tens of milliseconds, the second tone pulse is presented after a sufficiently long time following the first, thus leading to a maximal difference of the measured ear-canal response between these two pulses. The difference signal, or the residual of the earcanal signal, recorded during the presentation of the two tone pulses, is analyzed to indicate the elicitation of the acoustic reflex. Without an impedance change of the eardrum, i.e., if the first stimulus pulse elicits no reflex, the recorded ear-canal signal is almost the same during both pulses 关Fig. 1共b兲兴. Thus, the spectrum of the difference signal mainly reflects the physiological noise and the noise of the measurement system 关Fig. 1共c兲兴. In the case of an elicited reflex 关Fig. 1共e兲兴, the spectrum of the residual shows the frequency components of the stimulus signal 关Fig. 1共f兲兴. The existence of these Mu¨ller-Wehlau et al.: Acoustic reflex threshold
3017
Downloaded 29 Jun 2010 to 192.38.67.112. Redistribution subject to ASA license or copyright; see http://asadl.org/journals/doc/ASALIB-home/info/terms.jsp
FIG. 1. Illustration of the low-level reflex audiometry 共LLRA兲 method shown for a sinusoidal signal of 500 Hz at two different stimulus levels. The signal consists of two identical pulses of approximately 93 ms 共4096 samples兲 duration, separated by a small gap of 10 ms, and is presented via an OAE probe. The reflex will change the middle ear’s reflective properties during the presentation of the stimulus pair, thus changing the recorded signal 关共a兲 and 共d兲兴. By subtracting the two stimulus pulses from each other, the residual signal is obtained 关panels 共b兲 and 共e兲兴. If the stimulus level is high enough to elicit the acoustic reflex, the residual is constituted by the stimulus signal as seen in the power spectrum 共f兲. Otherwise the residual is dominated by noise components 共g兲. The residual spectra are shown only for better illustration of the residual properties. The reflex elicitation is detected by means of the phase coherence of an appropriate frequency component in successive presentations.
frequency components indicates the elicited reflex. A reliable detection of the stimulus component共s兲 within the residual signal is essential for the correct detection of the acoustic reflex. Further criteria are needed, especially at higher stimulation levels 共close to the limit of the experimental setup兲, to distinguish between difference components due to the acoustic reflex and physiological or system artifacts. The low-level reflex measurement 共Neumann, 1997兲 utilized for this study was supplemented with a different threshold criterion 共see below兲, since the original criterion used was shown not to be sufficiently reliable 共Mu¨ller-Wehlau et al., 2002兲. B. Analysis methods and ART criterion
The analysis method originally suggested by Neumann et al. 共1996兲 is based mainly on a signal-to-noise criterion for the frequency component共s兲 of the stimulus within the magnitude spectrum of the residual signal, and a further rejection criterion to account for system distortion. However, at higher stimulus levels this method sometimes indicated an ipsilateral acoustic reflex due to artifacts such as heartbeat, even in cochear implant 共CI兲 patients with complete hearing loss and the CI turned off 共from our own unpublished data兲. In the current study, the threshold criterion was based on a coherence synchrony measure 共CSM兲, which is a highly ac3018
J. Acoust. Soc. Am., Vol. 117, No. 5, May 2005
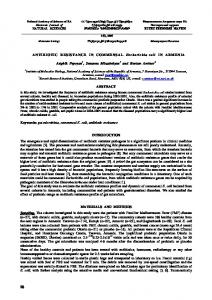
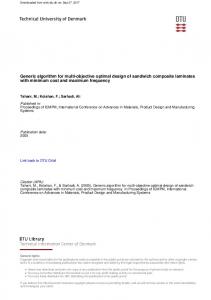
FIG. 2. Phase coherence as a measure of the reflex elicitation: For low stimulus levels the phase of the residual for a number of successive presentations 共gray open arrows兲 is not coherent 关panel 共a兲 at 74-dB SPL stimulus level兴. Thus, the mean phase vector 关black arrow in the panels 共a兲 and 共b兲兴 and hence the mean resultant length are small. If the reflex is present during the stimulation, the phase becomes more coherent 关panel 共b兲兴. The dashed circle with radius 0.8 in 共a兲 and 共b兲 indicates the threshold condition for the reflex detection. If the length of the mean phase vector is larger than the radius of this circle, i.e., if the mean resultant length R is larger than 0.8, the reflex is considered as elicited. The development of the mean resultant length depending on the stimulus level is shown in panel 共c兲 with the threshold value marked by the gray line, which corresponds to the dashed circles in panels 共a兲 and 共b兲.
curate statistical indicator in signal detection 共Valdes et al., 1997兲. The CSM takes the reproducibility of n repetitive measurements 共in this study n⫽16) as the criterion to detect the elicited reflex. The CSM is similar to the Rayleigh test of circular uniformity 共Mardia, 1972兲 and can be considered as a measure of phase coherence calculated only from the phase values of a selected frequency component from n successive measurements without considering the amplitude of the signal spectral component. The threshold criterion is given by the mean resultant length R, i.e., the absolute value of the vectorial mean of the normalized phase vectors for a selected frequency component from n consecutive measurement intervals. This method takes into account that successive stimulations demonstrate fast stabilization of their phase values if the stimulus level is high enough to elicit the reflex, thus resulting in highly coherent phase values. This results in a small vectorial mean of the phase vectors, i.e., a small value of R 关see Fig. 2共a兲兴 if the phases from consecutive measurement intervals of the selected frequency component are randomly distributed. In contrast, similar phase values of consecutive residuals result in a value of R close to 1 关see Fig. 2共b兲兴. The mean resultant length R can be computed from the phase values i ⫽ 1 ,..., n of the selected frequency components by Mu¨ller-Wehlau et al.: Acoustic reflex threshold
Downloaded 29 Jun 2010 to 192.38.67.112. Redistribution subject to ASA license or copyright; see http://asadl.org/journals/doc/ASALIB-home/info/terms.jsp
冏兺冏 n
1 R⫽ r , with r i ⫽cos i ⫹i sin i . n i⫽1 i
共1兲
Depending on the phase coherence, the mean resultant length can take values between 0 and 1. If the resultant length is higher than 共an empirically found value of兲 R⭓0.8, the reflex is assumed to be elicited 共see Fig. 2兲. This value for R is higher than those commonly used for signal detection in noise by the Rayleigh test.1 This higher R value represents therefore a more conservative criterion for the reflex elicitation, and meets the fact that ambient factors give rise to small differences in the recorded microphone signal, thus resulting in the presence of spectral components even if the reflex is not present. Additional artifact suppression was used by rejecting all single measurements whose individual residual amplitude at the selected frequency component was not within a 6-dB margin of the median of all measurements at the respective stimulus level. The statistical evaluation in the present study was based only on the analysis at one frequency 共close to 1000 Hz兲. A detailed examination of the evaluation frequency by using broadband stimuli showed that between 500 and 1500 Hz the reflex detection does not depend on the selected frequency component. Within this frequency band the change in middle-ear impedance is relatively large, resulting in a clear residual signal if the reflex is elicited. At lower frequencies the phase coherence is more affected by ambient lowfrequency noise, while there are broad frequency bands with a strongly reduced change in impedance at higher frequencies.2 C. Stimuli
All stimuli consisted of two identical signal frames 共see Fig. 1兲 with frequency components between 100 and 8000 Hz and 4096 samples in length. Since the sampling frequency was 44.1 kHz, the duration, T, of a single stimulus frame was 92.88 ms. The frequency components were adjusted to the signal length, i.e., the exact frequencies were chosen to be multiples of the fast Fourier transform 共FFT兲 base frequency, 1/T. ARTs were measured for three different types of stimuli. Since our data analysis requires that an appropriate frequency component is presented during the stimulation, all signals used in the experiments were chosen as tone complexes. Twenty samples of Hanning-shaped ramps were added at the beginning and the end of each 4096sample-long stimulus plateau. Two stimulus frames were separated by a 50-ms gap to be used as a stimulus signal by the LLRA method. Presentations of this frame pair were 1.15 s apart to allow the reflex to decay before subsequent stimulations. In optimization measurements for the LLRA, these settings were found to result in largest residual signals 共from our own unpublished data兲. 1. Tone complexes compensating for cochlear delay across frequency
These stimuli, referred to as the basilar-membrane tone complexes 共BMTC兲 in the following, were generated by adding frequency components with phases that hypothetically J. Acoust. Soc. Am., Vol. 117, No. 5, May 2005
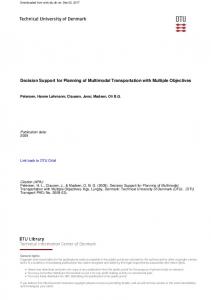
FIG. 3. Stimulus signals: BMTC3 共a兲, iBMTC3 共b兲, BMTC6 共d兲, and rTC6 共e兲. All signals are scaled to the same rms level and exhibit a flat spectral envelope with a varied number of contained frequency components. By adding frequency components that are separated by a multiple of the FFT base frequency apart, the number of chirp periods within the time frame is altered without changing the general temporal shape of the successive chirp. The amplitude spectra shown in panels 共c兲 and 共f兲 correspond to the stimuli shown in panels 共a兲 and 共b兲, and 共d兲 and 共e兲, respectively.
compensate for the BM travel-time differences between the different spectral components contained in the stimulus. The stimulus generation was based on the computation of the ‘‘approximate’’ chirp stimulus as defined in Dau et al. 共2000兲 that was optimized for ABR recordings. According to Dau et al. 共2000兲, the propagation time required for the calculation of the respective phase values was estimated using the cochlea model proposed by de Boer 共1980兲 and the frequency-place transformation suggested by Greenwood 共1990兲. The phase of each frequency component of the tone complex was chosen as follows: The instantaneous phase, inst , of the original BMchirp was calculated for the time t ⫽t fs when the instantaneous frequency of the BMchirp equals the frequency, f s , of the selected tone complex component. The starting phase, 0 , for the frequency component at time t⫽0 was computed such that this component has the phase m at the time t⫽t fs . By superimposing the components with a frequency spacing corresponding to the base frequency of the selected time frame, the respective time signal of a single chirp with flat spectral envelope is achieved 关see Figs. 3共c兲 and 共f兲兴.
2. Temporally inverted tone complexes
The second class of stimuli was generated by temporally inverting the BMTC stimuli. In the following, these stimuli are referred to as the inverted basilar-membrane tone complexes 关iBMTC; see Fig. 3共b兲兴. The expectation was that, by Mu¨ller-Wehlau et al.: Acoustic reflex threshold
3019
Downloaded 29 Jun 2010 to 192.38.67.112. Redistribution subject to ASA license or copyright; see http://asadl.org/journals/doc/ASALIB-home/info/terms.jsp
inverting the BMTC stimulus, the amount of neuronal excitation would be highly desynchronized, thus leading to an increased ART. 3. Random-phase tone complexes
Corresponding measurements were also obtained with a third tone complex with identical magnitude spectrum but random phases of the components, referred to as the random tone complexes 关rTC; Fig. 3共e兲兴. The rTC stimulus for one measurement was generated with respect to one uniformly distributed random phase vector. To exclude incidental compression or synchronization effects due to this certain random phase vector, the measurements were carried out for three rTCs generated with different sets of the random phases. 4. Number of chirp periods per frame—frequency spacing
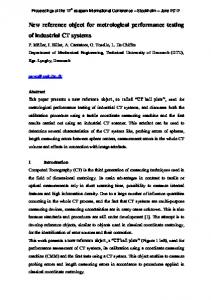
FIG. 4. Average hearing levels for NH subjects 共circles兲 and HI subjects 共triangles兲. The error bars represent the standard deviation of the mean thresholds across subjects.
The BMTC and iBMTC stimuli, comprising frequency components with a spacing equal to the FFT base frequency, exhibit one chirp within the stimulating time frame. Doubling the frequency spacing gives rise to a time signal exhibiting two chirp periods within the time frame of about 100 ms. Further increase of the spacing by a factor N results in an increasing number of N ‘‘overlapping’’ chirps in the time domain. In the following, the number N of the chirps used in a certain stimulus is indicated by an index in the stimulus name 关e.g., BMTC3 for a BMTC stimulus comprising three chirps per recording frame; see Figs. 3共a兲, 共b兲, and 共c兲兴. The same notation is used for the rTC stimuli, although the recurring structure in the time domain is not as clearly seen as for the chirp stimuli. At a fixed rms value, the number of chirp periods (N) and hence the peak-to-rms ratio was varied 关compare Figs. 3共a兲, 共d兲, and 共e兲兴 in order to investigate possible summation and compression effects within one stimulus frame. The duration of the original BMchirp for the frequency range used in the current study is 10.4 ms 共Dau et al., 2000兲. We refer to this chirp length as the effective BMchirp duration. Using a maximum number of N⫽7 successive chirps within a stimulus frame of about 100 ms avoids a significant overlap of the chirps within the effective duration. Therefore, interactions of successive chirp periods in the same BM regions within the stimulation can be mostly excluded.
flat hearing losses of about 50 dB. Even in the NH subjects we expect no relevant effect of the MOC reflex on the residual signal, since the stimuli used here are either noise- or chirp-like with a high sweep rate. Although these types of stimuli are appropriate to elicit the MOC reflex, both are unlikely to generate a sufficiently stable SFOAE to allow the detection of the MOC reflex in the residual signal. This holds especially for the noise-like rTC signals. Guinan et al. 共2003兲 described the detection of MOC/MEM reflexes based on the change of an SFOAE evoked by a continuous sinusoid. They pointed out that, for a residual signal dominated by the MOC reflex, a rotating phase 共i.e., a long group delay兲 is expected, as known from SFOAE, while for a MEMdominated residual signal a short group delay can be assumed. An offline analysis of the phase characteristic of the residual signal was performed at the ART level to test for a relevant influence of the MOC on the residual signal and thus on the acoustic reflex detection. This was done for rTC and BMTC at N⫽3 measurements in normal-hearing subjects. BMTC and rTC showed the lowest thresholds and, for N⫽3, the spacing of the frequency components is sufficiently close 共ca. 30 Hz兲 to allow a reliable phase analysis across frequency.
D. Detection of middle-ear muscle reflex versus detection of medial olivocochlear efferent reflex
In general, we assume that the difference of the recorded signals during the two stimulation intervals is mainly due to a contraction of the middle-ear muscle 共MEM兲. In normalhearing subjects it is conceivable that the residual signal is affected as well by the medial olivocochlear 共MOC兲 efferent reflex. Thereby, the MOC reflex needs to cause a change of a stimulus frequency otoacoustic emission 共SFOAE兲 that is elicited by the probe stimulus 共Guinan et al., 2003兲. Analogous to the difference of the two stimulation intervals due to the MEM, this would result in a residual signal. The residual signals in HI subjects should not be affected by the MOC anyway, since no or only weak SFOAE can be expected for 3020
J. Acoust. Soc. Am., Vol. 117, No. 5, May 2005
III. EXPERIMENTAL METHODS A. Subjects
Eight normal-hearing 共NH兲 subjects 共five female, three male兲 aged between 23 and 32 共average 28 years兲 with hearing thresholds better than 15 dB HL, and six hearingimpaired 共HI兲 subjects 共four female, two male兲 aged between 38 and 67 共average 54 years兲 with flat, sensorineural hearing loss participated in this study 共see Fig. 4兲. The NH subject group had no known history of audiological diseases. The HI subjects were chosen under the assumption that the compressive nonlinearity on the BM will be greatly reduced in these subjects. The ARTs, in response to broadband stimulation, can be expected to be elevated to some degree depending on the hearing loss. The members of the HI subMu¨ller-Wehlau et al.: Acoustic reflex threshold
Downloaded 29 Jun 2010 to 192.38.67.112. Redistribution subject to ASA license or copyright; see http://asadl.org/journals/doc/ASALIB-home/info/terms.jsp
ject group were restricted to subjects with a flat, moderate hearing loss of approximately 50 dB. The subject LP was measured on both sides so that for this group a total of seven measurements was performed. An audiological examination was carried out on all subjects, including reflex audiometry with a standard impedance audiometer 共Grason-Stadler GSI33兲. The reflex threshold was ascertained by a well-established method in order to make sure that the subjects showed ARTs below 100 dB HL. Subjects showing no conventionally measured ARTs within this range were excluded from further measurements since the experimental setup was limited to stimulus levels of 103 dB SPL. The limitation in sound levels was due to both technical reasons and the goal to restrict the exposure of the subjects to high-level sound over the estimated measurement period of up to 2 h for the full range of experiments conducted. Furthermore, subjects with tympanograms showing only small changes (⬍0.3 ml) in compliance were also excluded since the LLRA equipment provides no pressure equalization. No abnormally large changes in compliance (⬎2 ml) have been observed within the subject groups.
FIG. 5. Mean acoustic reflex thresholds 共ART兲 for NH 关Panel 共a兲兴 and HI listeners 关Panel 共b兲兴. The dashed horizontal line at 103 dB SPL indicates the maximal applied stimulus level. The error bars indicate the interindividual standard deviation of the respective ART measurement. For the reason of clarity, no error bars are given for the three rTC-type stimuli.
C. Measurement B. Setup
The whole measurement was PC based and implemented in a customized program. The level of the signal was digitally controlled and varied on the PC. A digital I/O-card 共RME DIGI 96兲 in the PC was used for the replay of the stimulus signal, which was transmitted via an external DA/AD converter 共RME ADI 8 DS兲 to a headphone buffer 共TDT HB6兲 to drive the probe speaker 共Otodynamics ILO BT-type OAE probe兲. The signal in the ear canal was recorded with an inserted probe microphone 共Otodynamics ILO BT-type OAE probe兲 linked via a connection box that provided the required bias voltage. The microphone signal was amplified by an external low-noise amplifier 共Stanford Research SR560兲 and then directed to the AD converter. The microphone chain was calibrated according to Siegel 共2002兲 using a Bruel & Kjaer type 4192 microphone capsule as reference. The output path including the probe’s speakers was calibrated using an artificial ear for insert earphones 共Bruel & Kjaer 4157兲 and a broadband 共150–10 000-Hz兲 calibration signal with flat temporal envelope. The transfer function obtained by this calibration procedure was used to calculate a phase invariant overlap-add filter to correct the stimuli for the frequency response of the output system. No individual correction or in-the-ear calibration was performed. Before each measurement, the fit of the OAE probe in the individual ear was tested online by presenting a broadband signal and recording with the OAE probe in the sealed ear canal. The spectrum of the recorded signal was displayed in comparison to a reference spectrum obtained in the artificial ear 共Bruel & Kjaer 4157兲 with the same procedure. The fitting of the probe in the individual ear canal was altered to obtain a sufficient correspondence between the reference and the current spectrum. J. Acoust. Soc. Am., Vol. 117, No. 5, May 2005
An automatic measurement mode was used to assert the reflex threshold starting at medium stimulus levels and subsequently increasing or decreasing the level depending on the reflex detection. After each reversal, the increment/ decrement was reduced from 6 dB in the beginning down to 1 dB after the final reversal. Depending on the direction of the level change, either the first or the last measured point where the reflex could successfully be detected after the final reversal was taken as the acoustic reflex threshold. The automatic mode utilized a range of 50 to 103 dB SPL. No reflex threshold was recorded if the reflex could not be detected for three successive measurements at the maximal stimulus level of 103 dB SPL. Since the resulting ARTs were expected to depend on the stimulus type, the starting levels of the automatic algorithm were different for the respective stimuli. All measurements took place inside a soundattenuating hearing booth 共IAC 1203兲 where the subjects rested in a chair and were allowed to read. Each stimulus was presented 16 times for each of the measured presentation levels. The measurement took approximately 20 min for each of the five stimuli 共each for N⫽3 to N⫽7兲. Therefore, all measurements in one subject were performed in a single session of about 2-h duration. IV. RESULTS
The results were similar within each of the two subject groups, but differed significantly between the two groups (p⬍0.005). 3 Mean data are shown in Fig. 5. A. ARTs in normal-hearing subjects
The NH subjects all exhibit significantly lower ARTs for the BMTC stimuli compared to the iBMTC stimuli. The acoustic reflex thresholds of these two stimuli show a clear Mu¨ller-Wehlau et al.: Acoustic reflex threshold
3021
Downloaded 29 Jun 2010 to 192.38.67.112. Redistribution subject to ASA license or copyright; see http://asadl.org/journals/doc/ASALIB-home/info/terms.jsp
dependency on the number of chirps, N, within the stimulus time frame. Paired-samples t-tests reveal the significant decrease of the ARTs with increasing N for both stimuli.4 This is the case for the BMTC stimuli, where mean thresholds decrease from 81.5 to 74.3 dB SPL, and more pronounced for the iBMTC stimuli with mean thresholds dropping from 98.6 to 86 dB SPL, thus resulting in a convergence that can be generally observed in the NH group. Surprisingly, the ARTs for the rTC stimuli are equal to or even lower than those obtained for the BMTC signals. Two-sided pairedsamples t-tests show significantly lower ARTs in response to the rTC stimuli for N⫽3 chirp periods within the time frame for rTC1 and rTC3 , but no significant difference between any rTC stimulus and BMTC for N⫽7. It can also be observed that the rTC stimulus type does not show a dependency on N with the mean thresholds nearly constant around 76 dB SPL.5 As expected, all three stimuli of the rTC type with different random phase vectors lead to the same ART. The characteristics of the ARTs for the different stimulus types were similar among all NH subjects, although the absolute ART levels values for the same stimuli varied between the subjects. In some cases, differences of the ART for the respective stimuli between two NH subjects were up to 15 dB. This difference was also observed for acoustic reflex thresholds measured at 500 and 1000 Hz with a standard procedure 共GSI 33 impedance audiometer兲. If the thresholds in response to the BMTC stimuli were elevated, it was not always possible to assert the threshold for the iBMTC signals due to the limitation of the presentation levels. This was the case for three of the eight NH subjects. In cases where the iBMTC threshold could not be determined, the ART was assumed to be 1 dB higher than the maximal tested stimulation level of 103 dB for statistical analysis. Therefore, the mean values of the iBMTC thresholds, as shown in Fig. 5, are most likely underestimated to some extent. This holds especially for stimuli comprising a low number of chirps within the stimulating time frame, where the resulting thresholds were particularly high for this stimulus type. Due to the differences in the absolute ART levels, the interindividual standard deviation seen in Fig. 5 for the BMTC and iBMTC thresholds is quite large. Nevertheless, the key properties exhibited by this subject group, i.e. 共i兲 the large difference between the ARTs for the BMTC and iBMTC stimuli; 共ii兲 the dependency of these ARTs on the frequency spacing; and 共iii兲 the low thresholds resulting from the rTC-stimuli, are the same for all subjects of the NH group. B. ARTs in hearing-impaired subjects
For the HI subjects 共right panel of Fig. 5兲, the ARTs for the BMTC stimuli are also significantly lower than the ARTs obtained by stimulation with iBMTCs. However, the threshold differences between these stimuli are distinctly smaller3 than for the NH subjects, and range from 8 dB for N⫽3 to 5 dB for N⫽7. Second, in contrast to the NH subjects, no significant difference of the mean ARTs can be found as a function of N, either for the BMTC or the iBMTC stimulus.6 The mean difference of ART between N⫽3 and N⫽7 for iBMTC stimuli in the HI group is only 2.5 dB 共98.6 dB for 3022
J. Acoust. Soc. Am., Vol. 117, No. 5, May 2005
N⫽3, and 96.1 dB for N⫽7) compared to 12.6 dB in NH subjects. The mean ART in the HI subjects for the BMTC stimuli are nearly independent of N 共about 91 dB SPL兲, while the NH subject group showed a significant3 decrease of 7.2 dB with increasing N. Even though the BMTC thresholds found in the HI subjects were elevated compared to the NH subjects, it was possible, with one exception, to assert all ARTs for the iBMTC stimuli in this subject group. As for the NH subjects, the three rTC stimuli led to essentially the same ART, independent of the frequency spacing and the random vector used for the generation. However, the BMTC thresholds found for the HI were lower than those found for the rTC stimuli, in contrast to the results of the NH group. For one subject 共LP兲 of the HI group, the pure-tone hearing thresholds for the right ear were about 15 dB lower than for the left ear. A difference of the ARTs for the respective signals can be observed between the two sides, with slightly elevated thresholds for all stimuli on the worse side compared to the thresholds measured in the better ear 关compare Figs. 7共a兲 and 共b兲兴. It can also be observed that the threshold difference between the BMTC and the iBMTC becomes smaller and the dependency on N less pronounced, especially of the iBMTC on the worse ear. Basic ART characteristics for all subjects are summarized in Table I as the ART T of rTC stimuli 共for N⫽3), the difference D between the ART from rTC and iBMTC stimuli 共for N⫽3), and the decrease G of ARTs for iBMTC from N⫽3 to N⫽7 共for illustration, see also Fig. 8兲.
C. Detection of middle-ear muscle reflex versus detection of medial olivocochlear efferent reflex
In order to exclude possible effects of the MOC on the acoustic reflex detection, the phase characteristics of the residual signal across frequency were investigated. All normalhearing subjects exhibited a constant phase across frequency at threshold levels, indicating that the residual signals are clearly dominated by the MEM contraction 共Guinan et al., 2003兲. This corresponds to the findings of Guinan et al. 共2003兲, who found that for elicitor levels of 65 dB SPL or higher, the residual signal is either MEM dominated or a mixture of MEM and MOC. Furthermore, to exclude the possible influence of spontaneous otoacoustic emission 共SOAE兲 that might be triggered by the stimulus and thereby obscure the ART, we conducted an offline examination of the residual signal at several frequencies between 500 and 1500 Hz using the analysis method mentioned above. This examination did not show the frequency specificity that could be expected if the residual signal was caused by SOAE. All frequencies within certain bands were equally appropriate to detect the reflex, indicating that the residual signal was caused by the impedance change resulting from the MEM contraction. Mu¨ller-Wehlau et al.: Acoustic reflex threshold
Downloaded 29 Jun 2010 to 192.38.67.112. Redistribution subject to ASA license or copyright; see http://asadl.org/journals/doc/ASALIB-home/info/terms.jsp
TABLE I. Comparison of the individual difference D between ARTs for rTC and iBMTC stimuli and the difference G of the ARTs for iBMTC stimuli between iBMTC3 and iBMTC7 共see Fig. 8兲. The ART T of the rTC stimuli for each subject were calculated with respect to the mean ART of the three rTC type stimuli. No ART for the iBMTC at N⫽3 could be obtained for the subjects indicated by the asterisk ( * ). In these cases the ART for the iBMTC3 stimulus are approximated from the slope of the remaining iBMTC thresholds. This was not possible for subject JJ, where only the iBMTC7 threshold could be measured. The D value for this subject is estimated from the difference between the mean rTC thresholds and an assumed iBMTC threshold of 104 dB SPL. NH subjects
HI subjects
Subject
D1 共dB兲
D2 共dB兲
G 共dB兲
T 共dB兲
NJ MM OM* SA JJ* KA* BS
23 34 26 21 18 18 16
⫺4 ⫺7 ⫺4 1 ⫺4 ⫺11 ⫺1
16 32 12 14 ¯ 16 14
68 67 78 73 86 86 82
LA
22
⫺9
10
74
V. DISCUSSION A. Mechanisms affecting the acoustic reflex thresholds
The idea behind the generation of the stimuli used in the present study was based on the hypothesis that the reflex threshold is related to the amount of synchronized neural excitation produced by the respective activating stimulus. The experimental results found in the current study partially support this hypothesis. The data also suggest that peripheral compression strongly influences the results for the different stimuli. In all HI subjects, the ‘‘optimized’’ BMTC produced the lowest ARTs 关see Figs. 6共c兲 and 共d兲兴. The ARTs obtained with the noise-like rTC stimuli decreased with decreasing hearing loss 关Figs. 7共b兲 and 共a兲兴 and obtained values slightly below those for the BMTC stimuli 关Figs. 6共a兲 and 共b兲兴 in the NH subjects. This effect and several of the other key observations in the data are discussed in the following. A detailed modeling of the effects was beyond the scope of the study. However, we have attempted to at least qualitatively explain the results based on the different aspects associated with cochlear processing.
Subject FR BU FD FW* WW LP 共better ear兲 LP 共worse ear兲
D1 共dB兲
D2 共dB兲
G 共dB兲
T 共dB兲
0 2 1 10 ⫺1 8 4
4 13 5 ⫺2 8 2 2
2 ⫺1 ⫺3 7 2 7 4
91 100 92 94 97 94 99
least at medium to high frequencies 共see, e.g., Smith et al., 1986; Shera, 2001; Oxenham and Dau, 2001, 2004兲. The temporally inversed iBMTC are trains of down-chirps. A relatively narrow-band BM excitation can be expected at each point in time for a single chirp that moves apically in time, similar to the excitation of a click but moving slower in the apical direction. The spectral summation across frequency will result in a flat response as a function of time 共only shaped by the spectral sensitivity of the cochlea and the frequency characteristic of ear canal and middle ear兲. In contrast to the stimulation with BMTC, not all filters contribute simultaneously; instead, only a few adjacent filters will
1. Excitation characteristics of the different stimuli
The BMTC were designed to compensate for BM dispersion. Ideally, these stimuli produce a maximum amount of excitation across frequency at a particular point in time. In a nonideal case, e.g., if the sweep rate of the chirp does not exactly compensate the delay line characteristic of the cochlea, a relatively broadband synchronized excitation still can be expected that moves in the apical or basal direction. The summation of excitation for the BMTC across all frequency bands as a function of time results in a peaky, i.e., temporally highly modulated ‘‘spectral summation response,’’ with the maximum at the time when each auditory filter reaches its maximal excitation. The BMTC are trains of up-chirps, with the instantaneous frequency of each single chirp moving from low to high frequencies. A relatively flat temporal response 共slowly increasing and decreasing in time兲 in each single 共local兲 auditory filter can be expected for upchirps since the stimulus phase curvature has the same sign as the curvature of the phase transfer function of the BM, at J. Acoust. Soc. Am., Vol. 117, No. 5, May 2005
FIG. 6. Examples of ARTs measured for two individual NH 关panels 共a兲 and 共b兲兴 and two individual HI subjects 关panels 共c兲 and 共d兲兴. Mu¨ller-Wehlau et al.: Acoustic reflex threshold
3023
Downloaded 29 Jun 2010 to 192.38.67.112. Redistribution subject to ASA license or copyright; see http://asadl.org/journals/doc/ASALIB-home/info/terms.jsp
nal threshold at lower stimulus levels than the iBMTC and rTC with their flat temporal envelope of the spectral summation response. However, since the relative amount of excitation that is cut off by the internal threshold increases with decreasing stimulus amplitudes, and since the stimulus amplitude decreases with increasing N while keeping the rms level constant, this model would lead to the prediction of slightly increasing ARTs with N. Thus, for a more detailed model further aspects of processing have to be taken into account. 3. The influence of neural synchronization on the acoustic reflex
FIG. 7. Examples of the ART characteristic for different degrees of hearing loss. Subject LP showed a general difference in hearing thresholds of about 15 dB between the left 共a兲 and right ear 共b兲. Accordingly, the ART characteristics are different for both ears, with the better ear 共a兲 showing attributes that can also be found in NH listeners. This indicates sufficient sensitivity to utilize this method as an indicator for the loss of BM compression that is associated with OHC damage.
contribute significantly to the spectral summation response at each point in time. From the perspective of the individual auditory filters, a relatively peaky, temporally more modulated response can be expected at the output, since the phase curvature of the down-chirps has the opposite sign as the curvature of 共most of兲 the cochlear phase transfer functions 共see, e.g., Oxenham and Dau, 2001兲. Finally, the rTC stimuli are tone complexes with random phases. These noise-like stimuli are expected to produce a spectrally flat response during the whole stimulation period. 2. Spectral summation and temporal integration
Overall, the acoustic reflex elicitation seems related to the overall spectrally summed cochlear 共neural兲 excitation within a certain time window.7 The observation that the ARTs in response to BMTC3 and BMTC6 in hearingimpaired subjects are at the same rms level allows a rough estimation of the minimal integration time constant, assuming that nonlinear effects are strongly reduced or absent in the HI subjects. The spectrally summed excitation for BMTC6 comprises two smaller peaks for every peak in the BMTC3 output signal. In order to obtain the same reflex threshold for BMTC3 and BMTC6 共as seen in the HI subjects兲, the temporally integrated activity/excitation must be the same for the two stimuli. This would be achieved by an integration time window of at least 30 ms, sufficient to include a full chirp of the BMTC3 stimulus and at least two peaks of the spectrally summed cochlear excitation related to two consecutive chirps of the BMTC6 stimulus. However, the criterion for reflex elicitation is not clear. A simple energy summation cannot explain the ART differences between BMTC and iBMTC stimuli. Instead, the differences could possibly be explained by assuming a peak integrator that sums up only contributions of the spectral summation response that exceed an internal threshold. The peaks in the spectral summation response of the BMTCs due to their higher synchronized excitation on the BM exceed this inter3024
J. Acoust. Soc. Am., Vol. 117, No. 5, May 2005
Nevertheless, it is reasonable to assume that the ‘‘gain’’ obtained with the BMTCs in the HI subjects, reflected in their lower ARTs relative to iBMTC and rTC stimulation 关Fig. 5共b兲兴, can be ascribed mainly to the higher neural synchronization. Similar to the explanations for the higher responses in ABR and MEG measurements using BM chirps 共Dau, 2003; Rupp et al., 2002兲, this can be explained by the higher peakiness of the spectral summation response as a function of time. Although derived from a passive BM model, BMTC or BM chirps have so far been tested only in NH subjects 共e.g., Dau, 2003兲. It is not clear whether the improvement obtained with the BM chirp in NH subjects can be expected to hold for HI subjects. A broadening of the BM filters, i.e., a loss of tuning of the BM filters in the HI subjects, may cause a reduction in BM travel time and thus a change of the neural synchronization effect by the stimuli. In turn, it might be that the greater differences between the ARTs for BMTC and iBMTC stimuli, as observed in the NH subjects compared to the HI group 关compare Figs. 5共a兲 and 共b兲兴, might reflect the better suitability of the stimuli for compensating the travel-time differences in the healthy cochlea. 4. The influence of cochlear compression on acoustic reflex thresholds
However, with increasing hearing loss the ARTs for the rTC stimuli show a stronger reduction than for the BMTC/ iBMTC stimuli. This observation can hardly be explained by a change of the dispersive properties of the BM. Timing effects should not strongly affect these noise-like rTC stimuli, whereas the gain of the spectrally summed activity for the other stimuli is probably influenced strongly by the fast-acting compression in the peripheral auditory system. As is known, e.g., from models of loudness, it is generally assumed that the input from a broadband stimulus to each auditory filter is compressed separately before being summed up across frequencies. Thus, a broadband BM excitation will lead to a higher overall output in comparison to a narrowband excitation. Zwicker and Fastl 共1999兲 describe spectral loudness summation of up to 20 dB in NH subjects for broadband noises centered at 4 kHz, while nearly no loudness summation was found in HI subjects. Thus, the difference of loudness summation between NH and HI subjects is in the order of the gain observed here for the ARTs from the noise-like rTC stimuli in NH subjects in comparison to HI subjects. Although BMTC, iBMTC, and rTC show the same Mu¨ller-Wehlau et al.: Acoustic reflex threshold
Downloaded 29 Jun 2010 to 192.38.67.112. Redistribution subject to ASA license or copyright; see http://asadl.org/journals/doc/ASALIB-home/info/terms.jsp
long-term spectrum, they possess different BM excitations in time. The iBMTC is assumed to produce a high local excitation at each point in time and therefore obtain less gain 共maybe almost no gain兲 from a fast-acting compressive nonlinearity in comparison to the excitation caused by BMTC or rTC which is spread across multiple auditory filters at each time. In each auditory filter, the iBMTCs are expected to produce the peakiest response in time, the BMTCs are assumed to show only a slightly modulated temporal excitation, and the excitation of the rTCs in each local filter will be almost flat in time as well. Assuming an almost instantaneous compression, this will lead to a further gain of the rTC from nonlinear compression in comparison to BMTC and especially iBMTC, since a series of instantaneously compressed low-amplitude excitations will result in a higher integrated output than the respective excitation with only a few higher peaks. Another observation, the decrease of the ARTs for BMTC and iBMTC with N that can be observed in the NH subject group, also cannot be associated with a change in neural synchronization, since the phase characteristics for the single chirps are kept constant with increasing N. 8 Similar to the decrease in the absolute rTC thresholds, this observation might also be explained by the effects of peripheral compression. Both BMTC and iBMTC produce a temporally defined excitation in each local BM filter. Assuming a static powerlaw compression in the local cochlear filters, the sum of the compressed output for three excitations with a given amplitude resulting from a BMTC3 elicitor would be smaller than that of six excitations evoked by a BMTC6 stimulus at the same overall rms level.9 Furthermore, the decrease of ARTs with N might be related to an interaction of successive stimuli on the BM. Especially for the narrow-band excitation of the iBMTC, slowly moving along the cochlear partition, it can be assumed that, for higher N, the excitation of the preceding chirp is still moving towards the apex while the excitation of the current chirp is starting at the base of the cochlea. In the case of a compressive cochlear nonlinearity, the output for lower-level inputs to many filters will exceed the output from a single filter with a respectively higher input, and thus result in lower ARTs. This effect would be more pronounced for the iBMTCs than for the BMTCs, since the iBMTCs are expected to produce a narrow-band excitation slowly moving from the base to the apex in contrast to a synchronized 共already兲 broadband BM excitation from the BMTC. A presumed reduction in travel time on the BM for the damaged cochlear might result in a reduced effect in the HI subject group, leading to no or only a slight dependency on N for these subjects. Overall, assuming a different gain of neural synchronization for the different stimuli in combination with a major effect of a fast-acting cochlear nonlinearity 共in NH subjects兲 on the observed effects of ART for the different stimuli gives the qualitatively most consistent view on the data. Most HI subjects with severe hearing loss have a strongly reduced compression. In these subjects 关see Figs. 6共c兲 and 共d兲兴, the observed effects are dominated by the gain of neural synchronization. There is no ART decrease with increasing N, and the ART from the rTC stimuli is similar to or slightly J. Acoust. Soc. Am., Vol. 117, No. 5, May 2005
FIG. 8. Illustration of ART characteristics T, D1, D2, G as given in Table I for all subjects obtained from ART measurements at only four different stimulus conditions 共a,b,c,d兲. T is the ART for an rTC stimulus at N⫽3 given by measurement point a. D1 共b–a兲 is given by the ART difference for an rTC and the iBMTC stimulus at N⫽3 and D2 共d–a兲 as the difference for an rTC and the BMTC, respectively. Finally, G 共b–c兲 gives the ART difference for iBMTC stimuli at N⫽3 and N⫽7.
below the iBMTC stimuli. The peakier overall excitation of the BMTC might be used by a mechanism based on a peak integrator to obtain lower ARTs. With decreasing hearing loss and increasing influence of a nonlinear compression, the ARTs of the rTC stimuli are shifted towards the ARTs of the BMTC stimuli, which are also reduced 关see Fig. 7共b兲兴, and even the decrease of the ARTs with increasing N becomes observable for the iBMTC stimuli 关see Fig. 7共a兲 and Figs. 6共b兲 and 共a兲兴. Thus, besides the absolute ARTs, the differences between the ARTs for different stimuli might be used to improve the value of ART measurements as a screening tool in clinical diagnostics. For example, the difference G for ART from iBMTC stimuli at N⫽3 and N⫽6 or the differences D1 and D2 between the ARTs of iBMTC, BMTC, and rTC might be useful to indicate a loss of compression. B. Prediction of hearing status and clinical applications
Besides the absolute thresholds like the threshold T for the rTC 共see Fig. 8, Table I兲, other characteristics of the ART allow for a clear distinction between NH and HI subjects, such as 共1兲 the decrease for ART especially for iBMTC, but also for BMTC, stimulation in NH subjects with increasing N 共indicated by G—see Fig. 8, Table I兲, while no dependency was found for the HI subjects, and 共2兲 larger ART differences between diverse stimuli types. Thus, appropriate criteria to distinguish between NH and HI subjects may be given by the ART differences D1 and D2 共see Fig. 8 and Table I兲. D1 is the difference between an rTC3 and the iBMTC3 stimulus, which shows a significant reduction from 22.3 dB in NH subjects to 3.5 dB in the HI subjects.10 The difference D2 between rTC3 and BMTC3 is negative for most NH subjects and is positive for most HI subjects— probably closely related to an increasing loss of compression. Additionally, the difference G between ARTs from iBMTC stimuli for N⫽3 and N⫽7 allows a clear distinction between NH and HI subjects 共see Fig. 8 and Table I兲. A high sensitivity of the ART differences, e.g., D1, with respect to hearing loss and loss of compression may be indicated by the Mu¨ller-Wehlau et al.: Acoustic reflex threshold
3025
Downloaded 29 Jun 2010 to 192.38.67.112. Redistribution subject to ASA license or copyright; see http://asadl.org/journals/doc/ASALIB-home/info/terms.jsp
results from subject LP 共see Fig. 7兲. This subject showed an almost parallel shift of hearing thresholds across frequency of about 15 dB between the two ears that is clearly reflected in different values of T, D1, D2, and G 共see Table I兲. Therefore, the additional consideration of ART differences for different stimuli beside the evaluation of absolute thresholds may allow a more reliable prediction of hearing impairment than using absolute ARTs alone. Overall, based on the data from this limited group of subjects, the differences of D1, D2, G, or T in NH and HI subjects for the specially designed stimuli in this study may offer the opportunity to utilize the measurement of ARTs for the objective prediction of hearing loss and recruitment or for hearing-aid fitting in young or uncooperative patients. Earlier studies showed that a close relationship of the mean ART and the uncomfortable level 共UCL兲 might exist. However, the prediction of the UCL based on the ART measurement will be inaccurate because of the high intersubject variability 共review in Olsen, 1999a; Olsen 1999b, c, Margolis and Popelka, 1975; Kawase et al., 1997兲. As opposed to these studies where loudness and ART were compared directly, the present results suggest a comparison of the differences of ARTs for appropriate stimuli 共e.g., BMTC, rTC vs iBMTC兲 that are differently affected by cochlear compression. Thus, the large intersubject variability might be reduced if the ART differences for special stimuli are considered, rather than the absolute thresholds alone. Based on this limited group of subjects, the derived measures D1, D2, G, and the ART T for the rTC stimuli give at least a set of highly significant screening indicators to distinguish between NH and HI subjects 共see Table I兲. Further studies will have to investigate if a classification of the individual hearing loss or even a quantitative prediction can be obtained by combining the different indicators in a larger group of subjects with different shapes and types of hearing loss. Another point of interest is to find stimuli with similar properties but higher frequency specificity than the ones used here. VI. SUMMARY AND OUTLOOK
共i兲
共ii兲
3026
A clear effect of neural synchronization on acoustic reflex threshold 关using the low-level reflex audiometry according to Neumann et al. 共1996兲兴 can be observed when comparing results obtained from BMTC and iBMTC stimuli. Therefore, the acoustic reflex threshold is strongly affected by the phase properties of the stimulus and thus by the dispersive characteristics of the cochlea. The results suggest that the ART depends on the amount of synchronized neural excitation integrated across frequency. The large difference in ART obtained with the different stimuli used here 共BMTC, iBMTC, and rTC stimuli兲 as well as the large difference between normal and hearing-impaired subjects can be explained qualitatively by assuming a compressive nonlinearity as typically found in BM input–output functions of normally functioning cochleae. However, in order to obtain a more quantitative understanding of the cochlear mechanisms that contribute to elicitation of the ART, modeling work is needed in future studies. J. Acoust. Soc. Am., Vol. 117, No. 5, May 2005
共iii兲
共iv兲
Besides the absolute ART values, there are several other indicators of hearing loss in our 共limited兲 group of subjects like the differences (D1 and D2) of the acoustic-reflex thresholds for rTC3 and iBMTC3 or BMTC3 stimuli, respectively. The clear distinctions between the two subject groups by the derived measures D1, D2, and G in combination with absolute ART may improve the use of acoustic reflex threshold measurements as an objective predictor of a loss of cochlear compression. Further studies are required to validate these measures as a clinical tool. The online-analysis method might be improved in future studies by incorporating a multifrequency evaluation. This might be useful to reduce the total number of consecutive stimulus presentations and consequently in measurement time without a decrease in statistical significance. Furthermore, this approach can provide additional artifact suppression with regard to the MOC efferent reflex by considering the change in group delay across frequencies. However, utilizing more than one frequency for the evaluation corresponds with an increase of the number, n, of phase values as long as all used frequencies are equally appropriate. Therefore, no relevant difference in the detection threshold, i.e., in the sensitivity of the method, can be expected.
ACKNOWLEDGMENTS
This study was supported by Deutsche Forschungsgemeinschaft, DFG Ko 942/11-3. We want to thank Jesko Verhey for fruitful discussions about compression. We gratefully acknowledge the two anonymous reviewers for their valuable comments on the manuscript. 1
The critical value typically used for the detection of a sinusoid in noise for 16 repetitions R 0 (16,0.001) is 0.63 共Mardia, 1972兲. Here, we use the more conservative empirically established reflex elicition threshold value of R 0 ⫽0.8. 2 In some subjects at higher frequencies, the ART would have been detected even at lower levels while no reflex would have been detected in other subjects at these frequencies. Around 1000 Hz appears to be a frequency region of a reliable impedance change across all subjects. 3 The comparison of the iBMTC/BMTC difference for both subject groups using the Wilcoxon, Mann, and Whitney U-test for independent samples (U⫽3.5⬍6⫽U 8;7;.005). 4 The single-sided paired-samples t-test revealed significant ART differences for both stimuli under all conditions except for the ARTs in response to BMTC6 compared to BMTC7 . 5 Paired-samples t-tests reveal no significant differences between N⫽3 and N⫽7 for any of the rTC-type stimuli. 6 A paired-sample t-test between the thresholds in response to iBMTC3 /iBMTC7 and BMTC3 /BMTC7 revealed no significant difference between these ART pairs. Therefore, a systematic dependency of the ARTs on N can be rejected for these stimuli in the HI subject group. However, a complete pair comparison reveals single deviations from a constant threshold across N. The ART for iBMTC3 , for example, are significantly higher compared to iBMTC4,5 and 6 . For the BMTC stimuli, the ART in response to BMTC5 was significantly lower compared to BMTC6 and 7 . 7 This might be some kind of leaky integrator. However, this is subject to a more detailed modeling and will not be discussed here. 8 This is different from the characteristic known for Schroeder-phase tone complexes. An increase of the repetition rate, i.e., of the fundamental frequency f 0 in Schroeder-phase tone complexes, means by definition a Mu¨ller-Wehlau et al.: Acoustic reflex threshold
Downloaded 29 Jun 2010 to 192.38.67.112. Redistribution subject to ASA license or copyright; see http://asadl.org/journals/doc/ASALIB-home/info/terms.jsp
change in sweep rate or phase curvature as well. This is not the case for the BMTC and iBMTC. An increase of f 0 results simply in an increasing number of consecutive chirps within the stimulus duration. Thus, for the BMTC/iBMTC the phase characteristic of each chirp is kept almost constant as long as 1/f 0 does not exceed an ‘‘effective chirp duration’’ of about 10 ms. For higher f 0 the chirps are shifted into one another. 9 For example, with an amplitude reduced by a factor of 0.71. Thus, a reduction of approximately 2 dB from N⫽3 to N⫽6 could be expected for an exponent of 0.3, while no effect can be expected for the HI subject assuming negligible compression and therefore an exponent close to 1. 10 The comparison of the iBMTC/mean共rTC兲 difference for both subject groups using the Willcoxon, Mann, and Whitney U-test for independent samples demonstrates a significant reduction of this difference in the HI listeners (p⬍0.001:U⫽0⬍2⫽U 8;7;0.001). Borg, E. 共1973兲. ‘‘On the neural organization of the acoustic middle ear reflex. A physiological and anatomical study,’’ Brain Res. 49, 101–123. Carlyon, R. P., and Datta, A. J. 共1997兲. ‘‘Masking period patterns of Schroeder-phase complexes: Effects of level, number of components, and phase of flanking components,’’ J. Acoust. Soc. Am. 101„6…, 3648 –3657. Clemis, J. D. 共1984兲. ‘‘Acoustic reflex testing in otoneurology,’’ Otolaryngol.-Head Neck Surg. 92, 141–144. Dau, T., Wegner, O., Mellert, V., and Kollmeier, B. 共2000兲. ‘‘Auditory brainstem responses with optimized chirp signals compensating basilarmembrane dispersion,’’ J. Acoust. Soc. Am. 107, 1530–1540. Dau, T. 共2003兲. ‘‘The importance of cochlear processing for the formation of auditory brainstem and frequency following responses,’’ J. Acoust. Soc. Am. 113, 936 –50. de Boer, E. 共1980兲. ‘‘Auditory physics. Physical principles in hearing theory I,’’ Phys. Rep. 62, 87–174. Gelfand, S. A. 共1998兲. Hearing—An Introduction to Psychological and Physiological Acoustics 共Dekker, New York兲. Gorga, M. P., Lilly, D. J., and Lenth, R. V. 共1980兲. ‘‘Effect of signal bandwidth upon threshold of the acoustic reflex and upon loudness,’’ Audiology 19, 277–292. Greenwood, D. D. 共1990兲. ‘‘A cochlear frequency position function for several species—29 years later,’’ J. Acoust. Soc. Am. 87, 2592–2605. Guinan, J. J. J., Bradford, C. B., Lilaonitkul, W., and Aharonson, V. 共2003兲. ‘‘Medial olivocochlear efferent reflex in humans: Otoacoustic emission 共OAE兲 measurement issues and the advantage of stimulus frequency OAEs,’’ J. Assoc. Res. Otolaryng 4, 521–540. Jerger, J., and Northern, J. L. 共1980兲. Clinical Impedance Audiometry 共Thieme, Stuttgart, New York兲. Katz, J. 共1977兲. Handbook of Clinical Audiology 共Lippincott Williams & Wilkins, Philadelphia兲. Kawase, T., Hidaka, H., Ikeda, K., Hashimoto, S., and Takasaka, T. 共1998兲. ‘‘Acoustic reflex thresholds and loudness in patients with unilateral hearing losses,’’ Eur. Arch. Otorhinolaryngol. 255, 7–11. Kawase, T., Hidaka, H., and Takasaka, T. 共1997兲. ‘‘Frequency summation observed in the human acoustic reflex,’’ Hear. Res. 108, 37– 45. Kohlrausch, A., and Sander, A. 共1995兲. ‘‘Phase effects in masking related to dispersion in the inner ear II. Masking period patterns of short targets,’’ J. Acoust. Soc. Am. 97, 1817–1829. Kubli, L., Dreisbach, L., Leek, M., and Lentz, J. 共2000兲. ‘‘Acoustic reflexes to Schroeder-phase harmonic complexes in normal-hearing and hearingimpaired individuals,’’ Assoc. Res. Otolaryngol. Abs. 599, 173共A兲. Lentz, J. J., and Leek, M. R. 共2001兲. ‘‘Psychophysical estimates of cochlear phase response: Masking by harmonic complexes,’’ J. Assoc. Res. Otolaryng. 2, 408 – 422. Lilly, D. J. 共1984兲. Evaluation of the Response Time of Acoustic-immittance Instruments. The Acoustic Reflex, edited by S. Silman 共Academic, New York兲, pp. 102–135. Mardia, K. V. 共1972兲. Statistics of Directional Data 共Academic, London, New York兲. Margolis, R. H., and Popelka, G. R.. 共1975兲. ‘‘Loudness and the acoustic reflex,’’ J. Acoust. Soc. Am. 58, 1330–1332.
J. Acoust. Soc. Am., Vol. 117, No. 5, May 2005
Metz, O. 共1951兲. ‘‘Studies on the contraction of the tympanic muscles as indicated by changes in the impedance of the ear,’’ Acta Oto-Laryngol. 39, 397– 405. Mu¨ller-Wehlau, M., Mauermann, M., and Kollmeier, B. 共2002兲. ‘‘Auswertealgorithmen zur Niedrigpegel-Reflexaudiometrie’’ 关Evaluation algorithm for the low level reflex audiometry兴. Fortschr. Akustik-DAGA 2002 共Ed兲 52–53. Neumann, J. 共1997兲. Recording Techniques, Theory and Audiological Application of Otoacoustic Emissions. 共BIS-Verlag Oldenburg兲. Neumann, J., Uppenkamp, S., and Kollmeier, B. 共1996兲. ‘‘Detection of the acoustic reflex below 80 dB HL,’’ Audiol. Neuro-Otol. 1, 359–369. Olsen, S. Ø. 共1999a兲. ‘‘The relationship between the uncomfortable loudness level and the acoustic reflex threshold for pure tones in normally hearing and impaired listeners—A meta-analysis,’’ Audiology 38, 61– 68. Olsen, S. Ø, Rassmussen, A. N., Nielsen, L.H., and Borgkvist, B. V. 共1999b兲. ‘‘The acoustic reflex threshold: not predictive for loudness perception in normally-hearing subjects,’’ Audiology 38, 303–307 Olsen, S. Ø, Rassmussen, A. N., Nielsen, L. H., and Borgkvist, B. V. 共1999c兲. ‘‘The relationship between the acoustic reflex threshold and levels of loudness categories in hearing-impaired listeners,’’ Audiology 38, 308 –311. Oxenham, A., and Dau, T. 共2001兲. ‘‘Phase effects in masking in normalhearing and hearing-impaired listeners,’’ J. Acoust. Soc. Am. 110, 3169– 3177. Oxenham, A., and Dau, T. 共2004兲. ‘‘Masker phase effects in normal-hearing and hearing-impaired listeners: Evidence for peripheral compression at low signal frequencies,’’ J. Acoust. Soc. Am. 116„4…, 2248 –2257. Rupp, A., Uppenkamp, S., Gutschalk, A., Beucker, R., Patterson, R. D., Dau, T., and Scherg, M. 共2002兲. ‘‘The representation of peripheral neural activity in the middle-latency evoked field of primary auditory cortex in humans,’’ Hear. Res. 174, 19–31. Scherg, M., and von Cramon, D. 共1985兲. ‘‘A new interpretation of the generators of BAEP waves I–V: Results of a spatio-temporal dipole model,’’ Electroencephalogr. Clin. Neurophysiol. 62„4…, 290–299. Schroeder, M. R. 共1970兲. ‘‘Synthesis of low-peak-factor and binary sequences with low autocorrelation,’’ IEEE Trans. Inf. Theory IT-16, 85–95. Shera, C. A. 共2001兲. ‘‘Frequency glides in click responses of the basilar membrane and auditory nerve: Their scaling behavior and origin in traveling-wave dispersion,’’ J. Acoust. Soc. Am. 109„5…, 2023–2034. Shore, S. E., Clopton, B. M., and Au, Y. N. 共1987兲. ‘‘Unit response in ventral cochlear nucleus reflect cochlear coding of rapid frequency sweeps,’’ J. Acoust. Soc. Am. 82, 471– 478. Siegel, J. H. 共2002兲. ‘‘Calibrating otoacoustic emission probes,’’ in Otoacoustic Emissions—Clinical Applications, edited by M. S. Robinette and T. J. Glattke 共Thieme, New York, Stuttgart兲, pp. 416 – 441. Simmons, F. B. 共1964兲. ‘‘Perceptual theories of middle ear muscle function,’’ Ann. Otol. Rhinol. Laryngol. 73, 724 –739. Smith, B. K., Sieben, U. K., Kohlrausch, A., and Schroeder, M. R. 共1986兲. ‘‘Phase effects in masking related to dispersion in the inner ear,’’ J. Acoust. Soc. Am. 80„6…, 1631–1637. Summers, V., and Leek, M. R. 共1998兲. ‘‘Masking of tones and speech by Schroeder-phase harmonic complexes in normally hearing and hearing impaired listeners,’’ Hear. Res. 118, 139–150. Tolsdorf, B., Mu¨nscher, A., Maier, H., Plotz, K., Mu¨ller-Wehlau, M., Mauermann, M., Baumann, U., and Leuwer, R. 共2004兲. ‘‘Clinical evaluation of low level acoustic reflex audiometry,’’ Assoc. Res. Otolaryngol. Abs. 27, 34共A兲. Valdes, J. L., Perez-Abalo, M. C., Martin, V., Savio, G., Sierra, C., Rodriguez, E., and Lins, O. 共1997兲. ‘‘Comparison of Statistical Indicators for the Automatic Detection of 80 Hz Auditory Steady State Responses,’’ Ear Hear. 18„5…, 420– 429. Zwicker, E., and Fastl, H. 共1999兲. Psychoacoustics: Facts and Models 共Springer, Berlin兲.
Mu¨ller-Wehlau et al.: Acoustic reflex threshold
3027
Downloaded 29 Jun 2010 to 192.38.67.112. Redistribution subject to ASA license or copyright; see http://asadl.org/journals/doc/ASALIB-home/info/terms.jsp