VIGILANCE PERFORMANCE, WORKLOAD, AND STRESS ... affirmed the utility of the cognitive-sensory task distinction of the vigilance taxonomy, although in ...
PROCEEDINGS of the HUMAN FACTORS and ERGONOMICS SOCIETY 55th ANNUAL MEETING - 2011
1180
THE EFFECTS OF TASK TYPE AND SOURCE COMPLEXITY ON VIGILANCE PERFORMANCE, WORKLOAD, AND STRESS Grace Teo & James L Szalma University of Central Florida, Orlando, FL The present study investigated the effects of task type (cognitive vs. sensory) and source complexity (number of displays to be monitored) of the performance, workload, and stress associated with vigilance. Results affirmed the utility of the cognitive-sensory task distinction of the vigilance taxonomy, although in contrast to previous research the cognitive task was associated with lower performance and higher levels of perceived workload and stress. The results also indicated that both task type and source complexity exhibited the typical performance-workload associations previously reported in research on sustained attention.
Copyright 2011 by Human Factors and Ergonomics Society, Inc. All rights reserved DOI 10.1177/1071181311551246
INTRODUCTION Vigilance, or sustained attention, remains a critical demand in modern operational environments, due in part to the advances made in automation and technology (Sheridan, 1987). Over sixty years of vigilance research has revealed that performance varies as a function several task characteristics, which are defined in the vigilance taxonomy of Parasuraman & Davies (1977). Two categories of task properties are task type (cognitive or sensory), and source complexity (number of sources to be monitored). With respect to task type, vigilance tasks can be divided into those that require differentiating signals from nonsignals based on symbol manipulation. A cognitive signal (e.g. detect the odd number amidst even numbers) typically requires some symbolic processing than compared to a sensory signal (e.g. detect the longer line). Previous investigations of task type effects showed that an increment in the complexity of the calculations required to perform the task resulted in a more stable, and in some cases, improved performance over time (Dember, Warm, Bowers, & Lanzetta, 1984; Warm, Howe, Fishbein, Dember, & Sprague, 1984). This runs counter to the typical decrement observed in vigilance studies employing sensory stimuli. A meta-analysis by See, Howe, Warm, and Dember (1995) has also affirmed the value of this distinction, and they reported that vigilance decrements were more likely to occur with sensory tasks than with cognitive vigilance tasks requiring comparative judgments, although this pattern was reversed for tasks requiring absolute judgments and was dependent on event rate. However, a decrement has been observed in a cognitive task when the complexity of the calculations was increased (Noonan, Karwowski, & Loeb, 1985). It therefore appears that there may be other factors in play in determining the function of this decrement. Another dimension of the vigilance taxonomy is source complexity, defined as the number of sources to be monitored. Greater source complexity (which can also be conceptualized as display uncertainty; cf., Grubb, Warm, Dember, 7 Berch, 1995) is presumably associated with greater demands on resource capacity. This reduces the ability to focus attention, which is detrimental to vigilance performance (Milosevic, 1974). Source complexity has also been implicated in stress literature, specifically in the Maximal Adaptability Model which posits the importance of information structure together
with information rate in affecting the level of stress and task performance (Hancock & Warm, 1989). Information structure connotes the meaning sought by the individual from his/her environment, and in a vigilance task this can be related to the spatial uncertainty related to signal detection, which directly correlates to the number of sources through which signals may come (e.g., Teo & Szalma, 2010). In a previous study, Grubb et al. (1995) reported that performance declined as display uncertainty increased, but that this effect was moderated by task type, defined in this case as simultaneous (requiring comparative judgment) versus successive (requiring absolute judgments) tasks. Specifically, Grubb et al. (1995) reported that the negative effect of source complexity was larger in the simultaneous condition, and that workload scores increased as a function of display uncertainty more for the simultaneous than the successive task. However, to date no studies have examined the interactive effects of source complexity and task type. In addition to the objective measures of vigilance performance, there are a number of studies that have shown that vigilance imposes high workload and is stressful (Warm, Parasuraman, & Matthews, 2008), and that the workload and stress of vigilance is moderated by the psychophysical properties of the task and the categories described in the taxonomy (Warm, Dember, & Hancock, 1996). Hence, the present study also sought to determine the effects of these task characteristics on the perceived workload and stress of observers. Note that the present study also examined the relationships between cognitive and affective traits and the dependent measures, and the interactions between task and person characteristics. However, due to space constraints, these effects are reported elsewhere in these proceedings (Teo & Szalma, in press). The general hypotheses of this task variables portion of the study are as follows: Hypothesis 1: Performance (i.e. proportion of signals detected over time on watch) would be highest in the condition with lower source complexity and that the lowest performance would be associated with the highest source complexity condition. Hypothesis 2: Workload in the condition with lower source complexity would be lowest, and workload in the condition with the highest source complexity would be highest.
PROCEEDINGS of the HUMAN FACTORS and ERGONOMICS SOCIETY 55th ANNUAL MEETING - 2011
Hypothesis 3: The function of the vigilance decrement over time will differ between sensory and cognitive tasks, such that the sensory task would be associated with the steeper decrement.
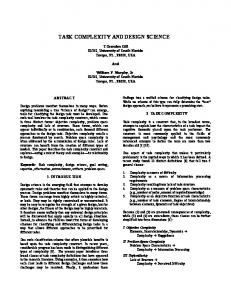
Trial with Cognitive signal (signal in lower left cell)
1181
Trial with Sensory signal (signal in upper right cell)
METHOD Participants Participants were from a large southeastern U.S. university, aged between 17 to 44 years (M=19.15 yrs, SD=12.26 yrs). There were one hundred and forty participants (68 males, 72 females). Course credit was awarded in exchange for participation. Task The present study employed a modified version of the visual adaptation of the cognitive Bakan (1959) task developed by Warm et al. (1984). It comprised the presentation of four two-digit numbers in a 2X2 matrix was used in the study (See Figure 1). The entire vigil comprised four consecutive blocks of trials (i.e. periods of watch), each 8 minutes in duration. Stimuli were presented on a computer screen at a rate of 16 events/min, and each presentation was 2500ms in duration. This yielded a total of 128 events in each period on watch. Of these 128 events, 5 were critical signals, and 123 were neutral events. The 5 critical signals appeared at random positions throughout each block, but the schedule of signal presentation was held constant across conditions and participants. Manipulations The manipulation of source complexity was achieved by instructing participants to monitor 1, 2, or all 4 cells (displays) in the matrix for stimulus events (see Figure 1; c.f., Grubb, Warm, Dember, & Berch, 1995). Source complexity was the lowest in the 1-display condition and highest in the 4display condition. The locations of the displays to be monitored were randomized for each participant in the 1- and 2display conditions, and a red outline around the displays at the start of the vigil notified them of which displays they were to monitor. Task type (cognitive vs. sensory) was manipulated by modifying the definition of critical signal. For the cognitive task, critical signals were defined as cases in which the two digits in a pair are identical or differ by ± 1, while for the sensory task critical signals were defined as cases in which one of a pair of digits is larger than the standard font size (see Figure 1). To ensure that the cognitive and sensory conditions were psychophysically equivalent in terms of the detectability of the signals, a pilot study using the two-alternative forced choice task was conducted to determine the appropriate size difference to use for the sensory condition.
Figure 1: Examples of critical signals Measures Workload. Perceived workload was assessed by the NASATLX (Hart & Staveland, 1988) which tapped six sources of workload, namely, Mental Demand, Physical Demand, Temporal Demand, Performance, Effort, and Frustration. A Global Workload measure was obtained by computing the average of the subscale scores. Stress. Perceived stress was measured using a short version of the Dundee Subjective State Questionnaire (DSSQ; Matthews et al., 1999; 2002). It consists of the subscales of pre and post Task Engagement, Distress and Worry. Participants rated the 20 items of the DSSQ on a 5-point rating scale. Procedure Participants completed the study in two sessions. After giving their informed consent in the first session, participants completed several of the individual differences measures (see Teo & Szalma, in press; these proceedings). When they returned for the second session, they filled out the remaining of the trait inventories and the pre-task DSSQ. They then completed the two-alternative forced choice task which provided an indication of their level of discriminability under alerted conditions for each task. This was subsequently entered as a covariate in the statistical analyses. On each of the twenty trials of the two-alternative-forced-choice task a neutral event and a critical signal were presented one after the other. Participants were required to decide whether the critical signal was presented first or second. The critical signal was presented first on half the trials, and trial order was randomized. After the two-alternative-forced-choice task, participants were given the instructions for the vigilance task which included a description of the critical signal. They were also told that they were to monitor a given number of displays in the 2X2 matrix (1, 2, or 4 displays). In addition, they were informed that the location of these displays to be monitored would be shown by a red outline presented immediately before the task, and that this would not be visible during the vigil. Participants were instructed to press the spacebar to indicate their detection of a critical signal. After a brief practice session, participants experienced the vigilance task. At the termination of the vigil they completed the post-task DSSQ and the NASA-TLX.
PROCEEDINGS of the HUMAN FACTORS and ERGONOMICS SOCIETY 55th ANNUAL MEETING - 2011
RESULTS A 2 (task type) x 3 (source complexity) x 4 (periods of watch) mixed factorial Analysis of Covariance (ANCOVA) was computed, with accuracy on the two-alternative forced choice task entered as the covariate,. Proportion of Signals detected The covariate, accuracy on the two-alternative forced choice task was statistically significant, F(1,133) =7.69, p=.006. Significant effects were also observed for task type, F(1, 133)=96.21, p< .001, and display (source complexity), F(2, 133)=4.67, p=.011. Performance accuracy in the sensory condition (M=.90, SE=.02) was significantly higher than that in the cognitive condition (M=.57, SE=.02), and across task types and periods, performance was significantly higher in the 1-display condition (M=.81, SE=.03), than in the 2-display (M=.72, SE=.03) or 4-display (M=.68, SE=.03) conditions. There was no main effect of period on watch (p>.05). There was also a statistically significant task type by period interaction, F(3,399)=5.23, p=.001. Subsequent analyses revealed that for the sensory condition, performance was the best during the 1st period of watch, and was worst either the 3rd or 4th period, whereas for the cognitive task conditions, the best performance was also in the 1st period, but the worst performance was always in the 2nd period (see Figure 2). All other sources of variance failed to reach statistical significance (p>.05).
1182
Sensitivity (A’) The ANCOVA revealed statistically significant effects for the covariate, F(1,133)=153.92, p