Original Article
http://mjiri.iums.ac.ir
Medical Journal of the Islamic Republic of Iran (MJIRI) Iran University of Medical Sciences
The examination of relationship between socioeconomic factors and number of tuberculosis using quantile regression model for count data in Iran 2010-2011 Fatemeh Sarvi1, Somayeh Momenian2, Mahmoud Khodadost*3 Bagher Pahlavanzadeh4, Mahshid Nasehi5, Eghbal Sekhavati6 Received: 28 October 2015
Accepted: 16 March 2016
Published: 17 July 2016
Abstract
Background: Poverty and low socioeconomic status are the most important reasons of increasing the global burden of tuberculosis, not only in developing countries but also in developed countries for particular groups. The purpose of this study was to assess the association between socioeconomic factors and the number of tuberculosis patients using quantile regression for count data. Methods: This cross-sectional study was conducted on 11,320 tuberculosis patients from March 2010 to March 201 in Iran. Data was gathered from the 345 sections of Iran by Ministry of Health and Medical Education and Statistical Center of Iran. The jittering method was applied for smoothing, and then, the quantile regression for count data was fitted. The AIC was used to compare the fitness of quantile regression for count data model and Poisson log-linear model. The R (3.0.1) software and Quantreg and AER packages were used for all analysis and modeling of the data. Results: The results of fitting the quantile regression for count data showed that in all percentiles, the more increase in immigration rate, illiteracy rate, unemployment and urbanization rates, the more tuberculosis morbidity rate was increased. The maximum increase of tuberculosis due to immigration rate, urbanization rate, unemployment rate, and illiteracy rate was in 95th percentile (β ̂=0.315), 85'Th percentile (β ̂=0.162), 75'Th percentile (β ̂=0.114), and 95'Th percentile (β ̂=0.304), respectively. For 50th percentiles and higher percentiles, with increasing the sum of physicians to the number of population, the tuberculosis morbidity rate was decreased, and the maximum decrease was in 95'Th percentile (β ̂=-0.1). For all percentiles, the AIC showed that quantile regression for count data had been a better fit to data. Conclusion: With respect to the relationship between socioeconomic factors and TB rate, health care observers should pay close attention to improving these factors in Iran to reduce the TB mortality and morbidity. Keywords: Quantile regression, Poisson regression, Tuberculosis, Iran. Cite this article as: Sarvi F, Momenian S, Khodadost M, Pahlavanzadeh B, Nasehi M, Sekhavati E. The examination of relationship between socioeconomic factors and number of tuberculosis using quantile regression model for count data in Iran 2010-2011. Med J Islam Repub Iran 2016 (17 July). Vol. 30:399.
Introduction TB that is caused by the bacillus Mycobacterium tuberculosis is an infectious disease. It can affect the lungs (pulmonary
TB) and also other sites of the body (extrapulmonary TB). Tuberculosis is a most important global health problem, According to the report of WHO, “In 2012, an
____________________________________________________________________________________________________________________ 1 . PhD student of Biostatistics, Department of Epidemiology and Biostatistics, school of public health, Hamadan University of Medical science, Hamadan, Iran.
[email protected] 2 . PhD student of Biostatistics, Faculty Member, Epidemiology and Biostatistics Department, Qom University of Medical Sciences, Iran.
[email protected] 3 . (Corresponding author) PhD student of Epidemiology, Gastroenterology and Liver Diseases research Center, Baqiyatallah University of Medical Science, & Department of Epidemiology and Biostatistics, Iran University of Medical Sciences, Tehran, Iran.
[email protected] 4 . PhD student of Biostatistics, Department of Biostatistics, Shahid Beheshti University of Medical Science, Tehran, Iran.
[email protected] 5 . Assistant Professor of Epidemiology, Department of Epidemiology and Biostatistics, Iran University of Medical Sciences, Tehran, Iran.
[email protected] 6 . PHD student of Environmental Engineering, Faculty member, Larestan school of medical sciences, Larestan, Iran.
[email protected]
The relationship between socioeconomic factors and tuberculosis
estimated 8.6 million people developed TB and 1.3 million died from the disease” (1). In developing countries that have lower socioeconomic status, TB is one of the most killer diseases and also in developed countries TB has historically been correlated with poverty and low socioeconomic status (2,3). Families with lower socioeconomic status have more children and frequently reside in more crowed quarters and usually live in undesirable environmental conditions (poor environmental sanitation and poor hygienic training). These factors may increase the probability of exposure to infection among poorer and less educated groups too because they have lack information about vaccination and lack access to the medical care (4,5). With increased urbanization, the rate of TB is increased too, because there are more risk factors for TB in cities like overcrowded housing, high contacts (6). Bhunu et al. studied the effects of poverty on TB transmission. The results showed that transmission rate is higher in poor communities than in the rich ones due to overcrowding, poor nutrition, reduced treatment uptake and lower socioeconomic status (7). Santos M, et al. evaluated the epidemiological status of Tuberculosis concerning to the socioeconomic characteristics of Sao Jose between 1998 and 2004. The socioeconomic factors that were studied were Schooling, Income, and Number of Residents. The results showed that in poorest areas the disease prevalence was higher (8). The higher rate of this disease is among migrant groups. If migrant groups move from areas with low TB rates to one of the high rates, the risk of the face of primary infections is increased. If migration was occurred from areas with high rate of TB to areas with a low rate of TB, the migrant group transmissions this high rate of TB to those areas. Even if the migration occurs between areas with similar incidence, due to the change in the living environment, and exposure to undesirable situations, the probability of contact with TB for the first time increases, so it is likely that TB is prevalent among http://mjiri.iums.ac.ir
migrant groups (9). Jose Leopold et al. investigated the relationship between TB with several population characteristics in Sao Paulo, Brazil, from 1994 to 1998. In their study, the relationship between immigration rate for foreigners and mortality rate of TB and also the relationship between immigration rates for the other Brazilian States with a mortality rate of TB was significant (10). The counts data are typically modeling with log-linear Poisson model. With this model, the relationship between covariates and the mean of the response can be estimated (11). However, this model cannot be applied to evaluate the effects of covariates on the other aspects of the response distribution, such as the quartiles. Therefore based on the log-linear model the picture of the relationship is incomplete, on the other hand, the assumption of the log-linear model is the equality of mean and variance of the response distribution, whereas in real, the variance of the data may be bigger than the mean. This issue is named overdispersion. The overdispersion may lead to the significant relationship between a response variable and covariates that is not significant in fact and also with overdispersion the variance of the data may be an underestimate (12). To solve this problem of the log-linear model, we can use the quantile regression for count data that investigate how covariates affect the entire distribution of the count responses and also unlike the log-linear model, quantile regression model for count data, has a separate scale parameter, and overdispersion does not occur (13). The aim of this study was to investigate the relationship between the socioeconomic factors such as immigration rate, unemployment rate, urbanization rate, the sum of physicians to the number of population points and illiteracy rate with the number of tuberculosis patients. Methods This cross-sectional study was conducted on 11,320 TB Patients from March 2010 to 2
Med J Islam Repub Iran 2016 (17 July). Vol. 30:399.
F. Sarvi, et al. March 2011 in 345 cities of Iran. Data was gathered from the Ministry of Health and Medical Education and Statistical Center of Iran for every city. We used the Quantile regression for count data for the skewness nature of response variable and to study the effect of socioeconomic factors on entire distribution, The estimation of quantile regression that studied by Koenker and Bassett (1978) was offered to continuous data (14). Since the count data have not continuous Quantiles, to fit the model, Machado and Santos Silva (2005) offered the jittering approach for smoothing (15). Using this approach, the response variable becomes continuous, and we can fit the quantile regression for data, so we produced data from uniform distribution form (0,1) and replace the response variable Y with “jittered” responses Y + U where U ~uniform (0,1). These jittered responses have continuous real quantiles. The form of model for these data (τ|x ) = τ + exp (x β(τ)), is Q where x is explanatory variable and k is the number of city, τ is the quantile that we fitted the model for them, β is the estimated coefficient for urbanization and T is the transpose of the explanatory vector. We can implement this model as the equivalent model with this form Q ∗ (τ|x) = x β(τ) where Y ∗ = log(Y + U − τ), these two models are equivalent because we applied a monotonic transformation (15). So to apply the quantile regression for count data, we first jittered the response data that was the number of TB patients in 345 cities. The quantile regression model for count data was fitted after jittered the data and applied the transformation. The quantiles that fitted the model was 0.05, 0.1, 0.15, 0.25, 0.5, 0.75, 0.85, 0.9 and 0.95. Since the number of TB patients in every city is dependent on population of the city, we used the population of the city as an offset term. The AIC (Akaike Information Criterion) was used to compare the fitness of quantile regression for count data model and Poisson log-linear model. As the Med J Islam Repub Iran 2016 (17 July). Vol. 30:399.
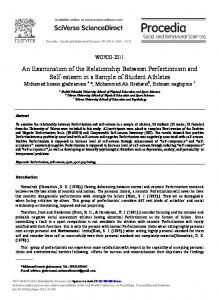
part of the information may be loosed due to fitting the model, we must apply the model that have a lower loss of information. One of the criterions for considering this issue is AIC. The lower AIC shows, the better model. We used R(3.0.1) software for all computations. We applied the Quantreg and AER packages to fitting the quantile regression for count data and testing the existence of overdispersion, respectively. For all computations, the P value less than 0.05 were considered significant. Results The total number of 11320 TB patients from 345 cities of Iran during March 2010 to March 2011 were enrolled in this study. The mean±SD age of patients was 47.7 ± 14.25 (Years), and the mean±SD for the number of TB patients were 32.8 ± 79.11. Figure 1 shows the histogram graph of TB patients in every city. This figure displayed the right skewed of the data, and the value of skewness was yield 7.28 with a standard error of 0.13. Descriptive statistics of variables are shown in Table 1. For every quantile, the quantile regression model for count data was fitted, and the parameters were estimated. The poisson regression model was fitted to data. The results of estimation using fitting the poisson regression model and quantile regression model for count data was shown in Table 2, 3.
Fig. 1. Histogram graph for number of TB patients in every city
3
http://mjiri.iums.ac.ir
The relationship between socioeconomic factors and tuberculosis Table 1. Descriptive statistics of study subjects Variable Mean (Std. Deviation) Immigration rate -0.03 (6.68) Urbanization rate 0.52 (.20) Unemployment rate 14.72 (9.84) Illiteracy rate 19.41 (6.17) Sum of physicians to number of population points 4.25(58.5)
Maximum -17.8 0.99 59.50 47.46 1081.200
Minimum 33.70 0.08 1.05 3.96 0.005
Table 2. The results of Poisson regression model for assessing the associations between socio-economic factors and tuberculosis morbidity Variable Std. Error p ( ) ( ) intercept -0.914 0.401 1.558 0.713 Immigration rate 0.153 1.165 0.0096