Modern Topics in Raman Spectroscopy July 24-28, IQUSP, São Paulo, Brazil
THE FARADAIC BEHAVIOR OF FORMILFERROCENE THIOSEMICARBAZONE (TFF) MONITORED BY IN-SITU SERS, UV-VIS SPECTROSCOPY AND DFT CALCULATIONS Gustavo F.S. Andrade1, and Marcia L.A. Temperini1,* - Lab de Espectroscopia Molecular – I.Q. – USP – C.P.: 26077 – CEP: 05513-970 – São Paulo, SP, Brasil.
[email protected]
The characterization of thiosemicarbazone derivatives’ faradaic behavior is very important to help understanding of structure/properties of these important class of surface modifiers.1 In recent work, it was verified by SERS and UV-VIS spectroscopies that the 2formylpyridine thiosemicarbazone (PATS2) have a reduction process with 2-picolilamine and thiourea (TU) as products.2 IDISCUSSION AND RESULTS
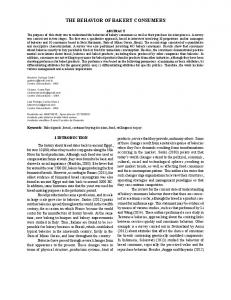
The cyclic voltammograms of TFF in 0.1 mol.L-1 NaClO4 acetonitrile solution present a reversible wave with E1/2= 0.53 V vs. Ag, assigned to the FeII/FeIII redox process. It is also observed a broad and irreversible wave at -1.4 V, assigned to the reduction of the thiosemicarbazone moiety. In Figure 1 SERS spectra of TFF in 0.1 mol L1 NaClO4 acetonitrile solution adsorbed on Au electrode are presented. In this spectrum it can be noted that the bands assigned to the thiosemicarbazone moiety at 1292 and 1592 cm1 are enhanced in relation to the ferrocenyl bands at 307 and 1105 cm-1 when compared to the Raman spectrum of the solid compound. The enhancement of the thiosemicarbazone bands indicates that this moiety adsorbs strongly on the gold surface, and the ferrocenyl moiety stands on the surface without strong chemical interaction. In the SERS spectra for more negative potentials, one can see that the TFF bands loose their intensity, and for potentials more negative than -1.0 V only solvent and amorphous carbon bands are observed. However, when -1.4 V is applied during 40 min, a new spectra is observed, different from the TFF spectra. This spectrum should be assigned to aminometilferrocene (AMeFe) adsorbed on the metallic surface, because it presents the characteristics bands of ferrocenyl and primary amine groups,3 as confirmed by the calculation of the vibrational frequencies by DFT approach. The in-situ UV-VIS spectra, not shown, indicate the formation of TU in solution, by the
appearance of a band at 240 nm for potentials more negative than -1.0 V. 0.0 V
*
*
*
-0.4 V
-1.0 V
Intensity / Arbitr. Un.
INTRODUCTION
-1.4 V
1592
After applying –1.4 V for 40 minutes 307
*
636
*
1460
991
*
Back to –0.2 V
400
600
800
1000
1200
1400
1600
Wavenumber / cm-1
Fig. 1: SERS spectra of TFF on Au electrode.
Neither the SERS nor the in-situ UV-VIS spectra in the anodic region allowed us to identify a spectroscopic signature of the oxidation products. CONCLUSIONS The reduction of TFF was characterized by SERS and UU-VIS spectroscopies and TU and AMeFe were identified as reduction products. ACKNOWLEDGEMENTS CNPq; FAPESP (03/00411-9). REFERENCES 1 Hill, H.A.O.; Page, D.J.; Walton, N.J. J. Electroanal. Chem. 1987, 217, 129. 2 Pessôa, M.M.B.; Andrade, G.F.S.; dos Santos, M.R.; Temperini, M.L.A. J. Electroanal. Chem. 2003, 545, 117. 3 Dollish, F.R.; Fateley, W.G.; Bentley, F.F. Characteristic Raman Frequencies of Organic Compounds; John Wiley & Sons; New York, 1974, p. 35.
Instituto de Química Universidade de São Paulo