Florida Institute of Technology. PAUL E. LEVY AND ... In the past, the feedback environment has been defined as the type of job performance information that ...
EDUCATIONAL AND PSYCHOLOGICAL MEASUREMENT
ARTICLE
10.1177/0013164403258440 STEELMAN ET AL.
THE FEEDBACK ENVIRONMENT SCALE: CONSTRUCT DEFINITION, MEASUREMENT, AND VALIDATION LISA A. STEELMAN Florida Institute of Technology PAUL E. LEVY AND ANDREA F. SNELL University of Akron
Managers are increasingly being held accountable for providing resources that support employee development, particularly in the form of feedback and coaching. To support managers as trainers and coaches, organizations must provide managers with the tools they need to succeed in this area. This article presents a new tool to assist in the diagnosis and training of managers in the area of feedback and coaching: the Feedback Environment Scale. This article also discusses the theoretically based definition of this new construct and the development and validation evidence for the scale that measures this construct. Confirmatory factor analyses supported the a priori measurement model, and assessment of relationships proposed in a preliminary nomological network provide initial support for the construct validity of the scale. Results also show evidence for the internal consistency, test-retest reliability, and discriminant validity of the facet scores of the Feedback Environment Scale. Keywords: feedback; feedback environment; construct validation
In a recent review and meta-analysis, Kluger and DeNisi (1996) found that feedback typically has only a moderately positive effect on performance and that more than 38% of the effects were negative. This suggests that the mechanisms of feedback are not as well understood as we would like to think. This article provides a research-based solution for diagnosing the feedback process in organizations. First, we discuss the conceptual basis for a new construct called the feedback environment. Following this, we present the systematic development and validation of a new multifaceted instrument, the Educational and Psychological Measurement, Vol. 64 No. 1, February 2004 165-184 DOI: 10.1177/0013164403258440 © 2004 Sage Publications
165
166
EDUCATIONAL AND PSYCHOLOGICAL MEASUREMENT
Feedback Environment Scale (FES), which will help inform the feedback process in organizations.
FES To better understand and diagnose feedback processes in organizations and train managers and others to give more meaningful feedback, we must first understand the contextual or situational characteristics of the feedback process, referred to here as the feedback environment. The feedback environment refers to the contextual aspects of day-to-day supervisor-subordinate and coworker-coworker feedback processes rather than to the formal performance appraisal feedback session. In the past, context effects have been identified solely as nuisance factors to be ignored or explained away. However, a unified theory of the variables that combine to shape the feedback environment is completely lacking in the feedback literature and yet is what largely defines the feedback process (Murphy & Cleveland, 1995). Common problems subordinates cite about managers and performance management include the following: Managers need training in how to give negative feedback and make it constructive, managers do not explain the performance rating process, and managers are not rewarded for developing subordinates (London, 1997). We need to better understand the mechanisms that support feedback to ensure it is a worthwhile pursuit and to target those areas where coaches need additional training or development. In the past, the feedback environment has been defined as the type of job performance information that employees perceive as being available to them (Herold & Parsons, 1985). Herold and Parsons (1985) developed a set of scales to measure the feedback environment that asked respondents to indicate the availability of different types of feedback information. Respondents indicated how frequently items such as “My supervisor compliments me on something I have done” occur in their workplaces. This scale has not been validated and is seldom used in research or practice, and the few published studies describe inconsistent results (Ashford, 1993; Greller & Parsons, 1992). Consequently, up to now, an organization’s feedback environment has been defined as the amount and availability of positive and negative feedback from different sources. Although we call our new construct “feedback environment,” it bears almost no resemblance to previous definitions of feedback environment. This new instrument measures a much more comprehensive view of the feedback environment and is more relevant to the organizations of today and the responsibilities of 21st-century managers. The facets of the feedback environment were derived based on the extant feedback literature and will be defined in the following sections.
STEELMAN ET AL.
167
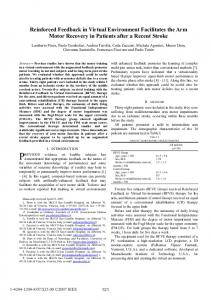
Supervisor source and coworker source. It is clear that employees receive feedback information from various sources (Greller, 1980; Morrison, 1993); however, we have limited our theoretical definition to two sources, supervisor and coworker, as some authors suggest that supervisor and coworker feedback sources are the most practical and relevant from the feedback recipient’s point of view (Ashford, 1989). We expect additional source factors such as subordinates will be added as research and practice deem necessary. Thus, the FES postulates two factors called Supervisor Source and Coworker Source and the following seven specific facets within each of those source factors: source credibility, feedback quality, feedback delivery, frequency of favorable feedback, frequency of unfavorable feedback, source availability, and promoting feedback seeking (see Figure 1). Source credibility. Credibility is conceptualized as the feedback source’s expertise and trustworthiness (Giffin, 1967). Source expertise includes knowledge of the feedback recipient’s job requirements, knowledge of the recipient’s actual job performance, and the ability to accurately judge that job performance. Trustworthiness represents whether an individual trusts the feedback source to provide accurate performance information (Giffin, 1967; Ilgen, Fisher, & Taylor, 1979). Feedback from sources who (a) have observed the recipient’s behavior, (b) are in a position to evaluate it, and (c) have motives for providing feedback that can be trusted will likely have more influence on behavior than will feedback from sources who are not perceived to be competent in evaluating recipient job behavior (Albright & Levy, 1995; Ilgen et al., 1979; Makiney & Levy, 1998). Feedback quality. Consistency and usefulness have been demonstrated to be important aspects of feedback quality (Greller, 1980; Hanser & Muchinsky, 1978; Herold, Liden, & Leatherwood, 1987). High-quality feedback is consistent across time, specific, and perceived as more useful than low-quality feedback, which varies with the feedback source’s mood, his or her liking of the feedback target, or observational opportunity (London, 1997). The informational value of feedback, assessed from the recipient’s point of view, is an important factor in whether the recipient accepts and is willing to respond to the feedback (Ilgen et al., 1979). Feedback delivery. A feedback recipient’s perceptions of the source’s intentions in giving feedback will affect reactions and responses to the feedback (Fedor, Eder, & Buckley, 1989). The more considerate the feedback source is when providing feedback, the more likely an individual is to accept and respond to the feedback. In fact, Ilgen, Peterson, Martin, and Boeschen (1981) demonstrated that consideration in giving feedback was positively
168
EDUCATIONAL AND PSYCHOLOGICAL MEASUREMENT
Feedback Environment
Co-worker Factor
Supervisor Factor
Source Credibility
Feedback Quality
Feedback Delivery
Promotes Favorable Unfavorable Source Feedback Feedback Feedback Availability Seeking
Source Credibility
Feedback Quality
Feedback Delivery
Promotes Favorable Unfavorable Source Feedback Feedback Feedback Availability Seeking
Figure 1. The a priori model of the feedback environment as operationalized by the Feedback Environment Scale.
related to perceptions of the feedback session atmosphere, helpfulness of the performance feedback, and satisfaction with the feedback itself. The person providing feedback needs to learn not only about what message to deliver but also the intentions he or she is conveying in his or her delivery process and demeanor. Favorable and unfavorable feedback. Research commonly finds that positive and negative feedback occur relatively independently (Greller & Parsons, 1992). Favorable feedback is conceptualized as the perceived frequency of positive feedback such as compliments from supervisors and/or coworkers when from the feedback recipient’s view, his or her performance does in fact warrant positive feedback. Correspondingly, unfavorable feedback is conceptualized as the perceived frequency of negative feedback such as expressions of dissatisfaction and criticism from supervisors and/or coworkers when from the feedback recipient’s view, his or her performance warrants such feedback. Note that our definitions of favorable and unfavorable feedback are more complex than simply whether the recipient likes the feedback. Our definitions take into account the extent to which the feedback recipient receives positive and negative feedback that upon reflection is believed to accurately reflect performance.
STEELMAN ET AL.
169
Source availability. Formal performance appraisal reviews are generally conducted only once a year (Meyer, 1991). Thus, to meet his or her goals throughout the year, an individual must turn to information available during informal day-to-day communications at work (Ashford & Cummings, 1983). Supervisor and/or coworker source availability is operationalized as the perceived amount of contact an employee has with his or her supervisor and/or coworkers and the ease with which feedback can be obtained. Promotes feedback seeking. In the feedback area, perhaps the most dominant theme of the past several years has been the perspective introduced by Ashford and Cummings (1983), which suggests that individuals are active seekers of feedback information. Research in this area has found that employees frequently report a desire for feedback (Ashford, 1989). However, for ego maintenance and other reasons, they are often reluctant to take that extra step and actually ask for feedback (Levy, Albright, Cawley, & Williams, 1995). Williams, Miller, Steelman, and Levy (1999) argued that one potentially important determinant of the frequency of feedback seeking is the extent to which managers promote feedback seeking. Feedback-seeking promotion is defined as the extent to which the environment is supportive or unsupportive of feedback seeking. It is the extent to which employees are encouraged or rewarded for seeking feedback and the degree to which employees feel comfortable asking for performance feedback. In sum, the feedback environment is defined as a multifaceted construct with two major factors (Supervisor and Coworker) manifested in seven facets. Together, these seven facets reflect the contextual aspects surrounding the transmission of job performance feedback on a recurrent or daily basis (see Figure 1). Relations With External Variables Based on the extant feedback literature, correlates and outcomes of the feedback process were identified (cf. Ilgen et al., 1979; Taylor, Fisher, & Ilgen, 1984). Finding that these variables relate to the facets of the FES in consistent and predictable ways will provide support for the convergent validity of the FES. The external variables of interest are discussed in the following sections. Satisfaction with feedback. Feedback is valuable in that it assists individuals in reaching a desired performance goal. Research suggests that individuals are satisfied with feedback when it provides information they perceive as useful for performing a task they want to perform well and when it is not redundant with information they already have available (Ilgen & Moore,
170
EDUCATIONAL AND PSYCHOLOGICAL MEASUREMENT
1987). In addition, others have found that the more favorable the feedback message, the more satisfied the recipients were with the feedback (Ilgen & Hamstra, 1972). Motivation to use feedback. Motivation to use feedback represents an individuals’ desire to perform better based on the feedback received. The source of the feedback and the associated facets of the feedback environment may be among the most important influences on the extent to which recipients are motivated to use feedback to improve their work performance (Ilgen et al., 1979). For instance, Fedor et al. (1989) found that employees were more motivated to use the feedback if the feedback source was seen as competent. Feedback-seeking frequency. Feedback seeking is the active elicitation or indirect monitoring of performance feedback from various sources (Ashford & Cummings, 1983). It is likely that the nature of the feedback environment affects individuals’desire for additional performance information and subsequent pursuit of feedback (Williams et al., 1999); thus, a relationship between the FES and feedback-seeking behavior is expected. Leader-member exchange (LMX) quality. LMX theory suggests that leaders differentiate among their subordinates. LMX is part of the social context of feedback because feedback often involves the interaction between a supervisor and a subordinate (Duarte, Goodson, & Klich, 1994); thus, LMX should be related to the facets of the FES. A supervisor who establishes a higher quality dyadic relationship with certain subordinates should also encourage and support an open feedback-seeking environment; thus, a relationship between the supervisor component of the FES and LMX is expected.
Method Respondents Total sample. A total of 698 surveys were mailed to employees at two companies. In all, 405 completed surveys were returned for an overall response rate of 58.0%. Respondents’ organizational tenure ranged from 1 year to 42 years, with an average of 18 years. Respondents’ job tenure ranged from 1 year to 30 years, with an average of 10 years. There were 343 male respondents (87.5%) and 49 (12.5%) female respondents. Survey respondents ranged in age from 22 to 64 years, with an average age of 45 years. A series of multiple-group LISREL analyses indicated there were no differences in the data from each company so they were combined for all analyses.
STEELMAN ET AL.
171
Measures All constructs were measured on a 7-point Likert-type scale ranging from strongly disagree to strongly agree. Survey booklets were sent to employees that provided specific instructions for each scale. The measures were presented in the following order. FES. Parallel items were created for the seven FES facets to reflect the supervisor and coworker referents. For example, an item in the supervisor credibility facet reads, “My supervisor is generally familiar with my performance on the job.” The parallel coworker credibility item reads, “My coworkers are generally familiar with my performance on the job.” Thus, employees responded to items measuring the seven FES facets for both their coworkers and their supervisor. Based on the results of two pilot studies, 63 items (32 for the supervisor referent and 31 for the coworker referent) were developed for use in this study (see the appendix for FES items). Motivation to use feedback. Four items adapted from Dorfman, Stephan, and Loveland (1986) were employed to measure employees’ motivation to use the feedback provided for performance improvement. Two items measured motivation to use supervisor feedback, and two items assessed motivation to use coworker feedback. A sample item is “I want to improve my job performance based on the feedback my supervisor (or coworkers) provides.” Feedback-seeking frequency. Individuals’ frequency of feedback seeking from their supervisor and coworkers was each measured with two items adapted from Levy and Steelman (1994). A sample item is “I often ask my supervisor (or coworkers) how well he or she thinks I am performing.” Satisfaction with feedback. Satisfaction with the day-to-day feedback provided by individuals’ supervisor and coworkers was measured with three items for each referent group. A sample item is “In general, how satisfied are you with the feedback you receive from your supervisor (or coworkers)?” LMX quality. Seven items were adapted from Scandura and Graen (1984) and Liden, Wayne, and Stilwell (1993) to measure the quality of the exchange relationship between supervisors and subordinates. A sample item states, “I can count on my supervisor to bail me out even at his or her own expense, when I really need it.” Demographics. Employee organizational tenure, job tenure, gender, age, and education level were also collected.
172
EDUCATIONAL AND PSYCHOLOGICAL MEASUREMENT
Procedure Employees were provided with survey booklets and stamped return envelopes. All respondents (N = 405) filled out the demographic form, the FES, and the feedback outcome measures: motivation to use feedback, feedbackseeking frequency, and satisfaction with feedback. Due to time constraints, the LMX measure was only given to employees from one organization. Approximately 4 to 5 months following the first administration, the FES was readministered to a random sample of 102 employees from the first organization to examine the test-retest scores for this sample. To evaluate the predictive validity of the FES, satisfaction with feedback, feedback-seeking behavior, and motivation to use feedback were also reassessed at this time. Completed retest surveys were obtained for 98 employees resulting in a 96% response rate.
Results Descriptive statistics and reliabilities for the FES scores for this sample are reported in Table 1. For the Supervisor factor, the scores in our study have a range of internal consistency reliability of .82 to .92. For the Coworker factors, the scores in our study have a range of internal consistency reliability of .74 to .92. Overall, for the current sample, the scores for the Supervisor factor have an internal consistency reliability of .96 and the scores for the Coworker factor are .95. In addition, employees report receiving more unfavorable feedback from their supervisor than from their coworkers, t(386) = 10.24, p < .001 (d = 1.04) but perceive coworkers to be more available to provide feedback than their supervisor, t(397) = 7.37, p < .001 (d = .74). Classical theory test-retest reliability (see Table 1) for the scores in this study ranges from .61 to .77 for the Supervisor factor and .26 to .63 for the Coworker factor. Overall, the test-retest reliability for the scores in this study for the Coworker factor is lower than is the test-retest reliability for the Supervisor factor scores in this study (.60 and .85, respectively). No significant organizational changes were reported by the organization in the 5 months between administrations of the FES. As shown in Table 2, the FES facet correlations across source factors are quite low, indicating respondents are able to discriminate between the two sources. For instance, the correlation between ratings of coworker credibility and ratings of supervisor credibility is .03. Although this pattern was expected, the strength and consistency of the pattern supports our a priori contention that individuals perceive their supervisor and coworkers as relatively separate elements of the overall feedback environment.
STEELMAN ET AL.
173
Table 1 Descriptive Statistics and Reliability Coefficients for the Feedback Environment Scale (FES) Facets Mean (SD)
Internal Consistency Reliability
Test-Retest Reliability
FES Facet
Supervisor Coworker Supervisor Coworker
Supervisor Coworker
Source credibility Feedback quality Feedback delivery Feedback favorability Feedback unfavorability Source availability Promotes feedback seeking
5.07 (1.30) 5.09 (0.99) 4.76 (1.40) 4.95 (1.11) 4.74 (1.33) 4.64 (1.07)
.88 .92 .86
.85 .92 .84
.70 .64 .71
.55 .51 .50
4.19 (1.51) 4.23 (1.20)
.88
.86
.73
.63
5.20 (1.11) 4.45 (1.18)
.85
.85
.61
.33
4.45 (1.36) 5.03 (1.01)
.82
.74
.77
.26
4.59 (1.28) 4.43 (1.06)
.84
.85
.70
.53
Confirmatory Factor Analysis (CFA) of a Priori FES Model The hypothesized seven-facet structure for both the Supervisor and Coworker Source factors of the FES was assessed with CFA using a maximum likelihood estimation procedure. Separate models were estimated for the Supervisor and Coworker Source factors. As can be seen in Table 3, the a priori FES model (see Figure 1) fit the data within acceptable parameters for both the Supervisor and the Coworker Source factors. Although there is not a single measure of overall fit that is generally accepted as the best, Hu and Bentler (1999) suggested models that yield a standardized root mean square residual value of .08 or lower and a Comparative Fit Index of .97 or more represent relatively good-fitting models. As can be seen in Table 3, the a priori model for the supervisor referent meets this two-index criteria of fit. Although the Coworker factor does not meet the relatively conservative rules of thumb suggested by Hu and Bentler, it does demonstrate acceptable fit with more traditional guidelines. For instance, Carmines and McIver (1981) suggested that a χ2 / df ratio of 2 to 3 is an adequate indicator of good fit. Based on this indicator, the Coworker factor (χ2 / df ratio = 2.53) demonstrates a sufficient fit to data. CFA of Alternative Models In the past, the feedback environment has largely been conceptualized as having one or two facets (Herold & Parsons, 1985) or has emerged empiri-
174
EDUCATIONAL AND PSYCHOLOGICAL MEASUREMENT
Table 2 Correlations Between the Feedback Environment Scale (FES) Facets Across Coworker and Supervisor Source Factors Supervisor Source Coworker Source 1. Credibility 2. Quality 3. Delivery 4. Favorability 5. Unfavorability 6. Availability 7. Promotes feedback seeking
1
2
3
.03 –.01 .05 –.02 .04 .09 .08
.08 .09 .13* .07 .12* .11 .15
.07 .04 .12* .02 .06 .11* .05
4
5
.06 .05 .12* .16** .09 .10* .14**
.08 .09 .07 .05 .20** .12* .16**
6 .07 .03 .13** .09 .06 .17** .13**
7 .11* .13** .13** .14** .14** .12* .36**
*p < .05. **p < .01.
Table 3 Fit Indices of Confirmatory Factor Analysis Models χ2 (df) Supervisor Source factor A priori FES model Single-factor model Two-factor model Coworker Source factor A priori FES model Single-factor model Two-factor model
χ2 / df
CFI
SRMSR
χ2diff (dfdiff)
101.48 (56) 595.82 (104) 303.51 (71)
1.81 5.73 4.27
.97 .91 .95
.04 .28 .25
494.34 (48) 202.03 (15)
141.48 (56) 718.01 (104) 306.96 (71)
2.53 6.90 4.32
.93 .87 .94
.05 .30 .15
576.53 (48) 165.48 (15)
Note. All χ2 and χ2diff tests are significant at p < .001. CFI = comparative fit index; SRMSR = standardized root mean square residual.
cally as a single dimension (Larson, Glynn, Fleenor, & Scontrino, 1986). To determine whether the seven facets comprising the FES demonstrate sufficient discriminant validity to warrant the multifaceted structure, a one-factor and a two-factor model for both the Coworker and the Supervisor Source factors were tested. Following from the previous literature (e.g., Herold & Parsons, 1985), in the two-factor model, the unfavorable feedback facet served as one factor and the six remaining FES facets, which are largely positive aspects of the feedback environment, were constrained to be the second factor. Because both of these reduced-factor models are nested within the larger a priori seven-factor model, a χ2diff test was used to determine whether the a priori model resulted in a significantly better fit to the data. To obtain a strictly nested model, the single-factor model was estimated by constraining all
STEELMAN ET AL.
175
seven facets of the a priori model to be perfectly correlated. Similarly, for the two-factor model, the six positive FES dimensions were constrained to be perfectly correlated with each other but were allowed to freely correlate with the second factor, the unfavorable feedback facet. All of the fit indices indicate that the a priori model of the FES for both the Supervisor and the Coworker Source factors fit the data better than did either the single-factor or the two-factor model (see Table 3). Evidence for External Validity To provide additional evidence of the construct validity of the FES, the following four external variables were predicted to be related to employees’ perceptions of the feedback environment: satisfaction with feedback, motivation to use feedback, feedback seeking, and LMX. The concurrent relationship between these external variables and the FES and the ability of the FES to predict these external variables 5 months later were assessed. Table 4 presents concurrent validity coefficients with predictive validity coefficients in parentheses. The pattern of relationships supports predictions that the FES facets associated with a particular source factor are more strongly related to external variables for that particular source than for the other source. For instance, supervisor credibility is more strongly related to satisfaction with supervisor feedback (r = .73) than it is to satisfaction with coworker feedback (r = .01), and coworker credibility is more strongly related to satisfaction with coworker feedback (r = .64) than it is to satisfaction with supervisor feedback (r = .15). Table 4 also indicates that the majority of the predictive validity coefficients were statistically significant. Although generally smaller in magnitude than the concurrent validity coefficients, the pattern of results is very similar. In all, with respect to concurrent and predictive validity, there are 98 correlations among the seven facets of the FES (within each of the two source factors) and the four external variables. Only 17 of these were not statistically significant and in the expected direction. To control for experiment-wise error, the critical probability level was adjusted using a Bonferroni adjustment. This adjustment does not affect the results. Furthermore, 12 out of the 17 nonsignificant effects were associated with one FES facet: unfavorable feedback. Based on the literature, unfavorable feedback was expected to be negatively related to the external variables. Results indicated it was positively related to these variables.
Discussion This research takes an initial step toward defining, developing, and validating a multifaceted measure of the feedback environment. To assess the
176 .73* .76* .69* .68* .33* .69* .67* .15* .12* .16* .12* .15* .18* .16*
.16* .12 .13* .16* .10 .11 .15*
(.65*) (.67*) (.64*) (.55*) (.37*) (.66*) (.59*)
Satisfaction With Feedback
.74* .74* .71* .67* .37* .70* .68*
LMX
.25* .30* .22* .20* .20* .18* .15*
.36* .40* .34* .31* .21* .35* .27*
(.23*) (.25*) (.24*) (.31*) (.07) (.33*) (.23*)
Motivation to Use Feedback
–.01 .07 .01 .08 .10 .05 .22*
.20* .25* .25* .37* .19* .28* .45*
(.25*) (.30*) (.19) (.35*) (.02) (.28*) (.28*)
Feedback Seeking
.64* .63* .56* .56* .42* .58* .55*
.01 .10* .09 .05 .08 .08 .13* (.36*) (.26*) (.33*) (.25*) (.20*) (.33*) (.20*)
Satisfaction With Feedback
.50* .54* .46* .38* .39* .37* .41*
.10 .17* .14* .10* .04 .09 .11* (.39*) (.36*) (.27*) (.28*) (.29*) (.40*) (.36*)
Motivation to Use Feedback
Coworker Referent
.24*(–.07) .29* (.05) .17*(–.09) .35* (.23*) .37* (.13) .22* (.02) .52* (.23*)
.00 .05 .25 .09 .00 .06 .25*
Feedback Seeking
Note. Correlations in parentheses are predictive validity coefficients; all other correlations are concurrent validity coefficients. Sample size for LMX is 274. Sample size for predictive coefficients is 98. Sample size for all other correlations is 405. LMX = leader-member exchange. *p < .01.
Supervisor Credibility Quality Delivery Favorable feedback Unfavorable feedback Availability Promotes feedback seeking Coworker Credibility Quality Delivery Favorable feedback Unfavorable feedback Availability Promotes feedback seeking
FES Facet by Source
Supervisor Referent
Table 4 Validity Coefficients Between Supervisor and Coworker Feedback Environment Scale (FES) Facets and External Variables
STEELMAN ET AL.
177
facets defined as part of the context of the feedback environment, subscales were developed for two feedback sources, supervisor and coworker. The results regarding the measurement and validation of the FES supported the a priori model; however, a number of surprising results also emerged. For instance, CFA results indicated that the Coworker factor fit the data less well than did the Supervisor factor. The Coworker factor scores in this study also demonstrated less temporal stability than did the Supervisor factor. There are at least two potential explanations for this. First, the group of individuals an employee calls “coworkers” is open to some interpretation. Employees may more easily identify their supervisor than their coworkers, which might result in more consistent results for the supervisor source facets than for the coworker source facets. A second potential explanation revolves around the dynamic nature of the work environment. Coworkers come and go; task forces and work teams are often short-term entities based on business need. Supervisors, however, tend to be more stable. More research is needed to further delineate the feedback environment of well-defined work teams. Another unexpected set of findings emerged with respect to the unfavorable feedback facet. This facet was designed to assess instances of veridical unfavorable feedback or the extent to which employees perceive they receive unfavorable feedback from their supervisor or coworkers that is justified. This measure is distinguished from other Feedback scales (e.g., Herold & Parsons, 1985), which have traditionally measured feedback sign in a way that simply tapped whether employees were provided with feedback that they were performing well or not performing well (i.e., positive or negative sign); the accuracy or merit of this feedback information was not explored. In the past, these Negative Feedback subscales have been inversely related to outcome variables such as satisfaction with feedback (Fedor et al., 1989; Ilgen & Hamstra, 1972). Contrary to expectations, the data in this study indicate that veridical unfavorable feedback is positively associated with satisfaction with feedback, desire to use feedback to improve performance, and motivation to ask for additional feedback. Larson (1986) has suggested that part of the problem in feedback processes is that supervisors are uncomfortable providing negative feedback because they believe negative feedback will engender unpleasant reactions and defensiveness from feedback recipients. The data indicate that contrary to these commonly accepted expectations, employees may be more satisfied with, motivated to use, and willing to seek out additional feedback when that negative feedback accurately reflects performance. These results, considered alongside the results of Kluger and DeNisi (1996), indicate that negative feedback may in fact be operating in unanticipated ways and is an area that warrants further attention. The FES was designed to provide diagnostic information in the area of coaching and development. For illustrative purposes, Table 5 presents FES
178 Mean 5.70 5.61 5.67 5.38 5.47 5.54 4.62
Facet
Credibility Quality Delivery Favorable feedback Unfavorable feedback Source availability Promotes feedback seeking
(1.06) (1.30) (1.24) (1.35) (1.11) (0.94) (1.14)
(SD) .48 .58 .72 .76 .03 .66 .42
z
Supervisor 1 (N = 16)
Table 5 Illustrative Comparison Across Supervisor
4.16 3.84 3.73 3.13 4.73 3.70 3.54
Mean (1.65) (1.58) (1.44) (1.62) (1.29) (1.50) (1.17)
(SD) –.70 –.71 –.75 –.70 –.69 –.72 –.51
z
Supervisor 2 (N = 31)
4.17 3.91 4.65 3.20 5.12 4.21 3.45
Mean (1.53) (1.32) (1.36 (1.04) (1.10) (1.13) (0.64)
(SD)
–.68 –.66 –.05 –.66 –.31 –.34 –.59
z
Supervisor 3 (N = 15)
5.54 5.25 4.65 3.95 5.90 5.00 4.20
Mean
(1.00) (1.05) (1.33) (1.59) (0.69) (1.05) (1.02)
(SD)
z .36 .32 –.05 –.16 .46 .23 .05
Supervisor 4 (N = 30)
STEELMAN ET AL.
179
data collected from the subordinates of four supervisors. The table presents the mean and standard deviation for each FES facet for each supervisor as well as its z score (i.e., a discrepancy score from the mean of that facet across all supervisors). Reading across the rows indicates that the various facets of the feedback environment created by supervisors differ. For instance, the employees working for Supervisor 1 feel this supervisor provides a great deal of positive feedback (M = 5.38, z = .76), whereas those employees working for Supervisor 2 report they receive very little positive feedback from this supervisor (M = 3.13, z = –.70). These data indicate that some supervisors could benefit from training on the value and appropriate use of positive feedback, whereas others do not seem to need development in this area. Similar kinds of comparisons can be made along other facets between different supervisors. Examining each supervisor separately (i.e., reading down the columns) provides information about how effective a given supervisor is on each of the feedback facets. For instance, Supervisor 3 could be targeted for some training regarding the use of feedback as a coaching tool because he or she provides relatively little favorable or unfavorable feedback. However, he or she may not need extensive training on how to constructively deliver feedback because employees provided average ratings for this facet (M = 4.65, z = –.05). Supervisor 4 has facets on which he or she seems to do well (credibility and quality) and other facets on which he or she does not do so well (delivery and favorable feedback). This supervisor also appears to provide a great deal of unfavorable feedback (M = 5.90, z = .46) and little favorable feedback (M = 3.95, z = –.16). Using these supervisor-focused data as an example, it is clear that supervisors possess various strengths and weaknesses that can best be understood and targeted through a multifaceted look at the feedback environment. The strongest predictor of feedback-seeking behavior from individuals’ supervisors was the extent to which the supervisors promote an environment supportive of feedback seeking (r = .45). Similarly, the strongest predictor of feedback-seeking behavior from individuals’ coworkers was the extent to which the coworkers promote an environment supportive of feedback seeking (r = .52). This supports the research findings of Ashford and Northcraft (1992) and Williams et al. (1999). Future research should now look at how the feedback environment develops over time as well as its impact on work habits, development, and communication. Future research should also begin to explore how this instrument can be used to formulate individual-based interventions focused on developing managers’ skills and approaches to providing feedback. The instrument could also be used as a follow-up device to investigate whether the interventions had their intended effect.
180
EDUCATIONAL AND PSYCHOLOGICAL MEASUREMENT
Conclusion The purpose of the research study reported here was twofold: (a) to define and measure the various aspects of a new construct, the feedback environment, and (b) to develop and validate an instrument that can be used to assess these aspects of the feedback environment for individual managers and for coworker groups. This instrument may be put to several uses, such as a training needs assessment for managers and others and a readiness index for the implementation of multirater feedback programs. There has been surprisingly little empirical work conducted with an eye toward training managers to give better feedback. One reason for this may be the lack of a validated instrument to assess coaching and other aspects of the feedback process. Use of this instrument is an ideal way to diagnose organizations and improve the “coaching of coaches” that is instrumental to employee success and development. Appendix Feedback Environment Scale (FES) Supervisor Source Source credibility
My supervisor is generally familiar with my performance on the job. In general, I respect my supervisor’s opinions about my job performance.
Coworker Source My coworkers are generally familiar with my performance on the job. In general, I respect my coworkers’ opinions about my job performance.
With respect to job perforWith respect to job performance mance feedback, I usually do feedback, I usually do not trust my coworkers. not trust my supervisor.
Feedback quality
My supervisor is fair when evaluating my job performance.
My coworkers are fair when evaluating my job performance.
I have confidence in the feedback my supervisor gives me.
I have confidence in the feedback my coworkers give me.
My supervisor gives me useful feedback about my job performance.
My coworkers give me useful feedback about my job performance.
The performance feedback I receive from my supervisor is helpful.
The performance feedback I receive from my coworkers is helpful.
I value the feedback I receive from my supervisor.
I value the feedback I receive from my coworkers.
STEELMAN ET AL.
181
Appendix (continued) The feedback I receive from my supervisor helps me do my job.
The feedback I receive from my coworkers helps me do my job.
The performance information I The performance information I receive from my supervisor receive from my coworkers is is generally not very generally not very meaningful. meaningful. Feedback delivery
My supervisor is supportive when giving me feedback about my job performance.
My coworkers are supportive when giving me feedback about my job performance.
When my supervisor gives me performance feedback, he or she is considerate of my feelings.
When my coworkers give me performance feedback, they are usually considerate of my feelings.
My supervisor generally provides feedback in a thoughtless manner.
My coworkers generally provide feedback in a thoughtless manner.
My supervisor does not treat people very well when providing performance feedback.
In general, my coworkers do not treat people very well when providing performance feedback.
My supervisor is tactful when giving me performance feedback.
In general, my coworkers are tactful when giving me performance feedback.
Favorable feedback When I do a good job at work, my supervisor praises my performance.
Unfavorable feedback
When I do a good job at work, my coworkers praise my performance.
I seldom receive praise from my supervisor.
I seldom receive praise from my coworkers.
My supervisor generally lets me know when I do a good job at work.
My coworkers generally let me know when I do a good job at work.
I frequently receive positive feedback from my supervisor.
I frequently receive positive feedback from my coworkers.
When I don’t meet deadlines, my supervisor lets me know.
When I don’t meet deadlines, my coworkers let me know.
My supervisor tells me when my work performance does not meet organizational standards.
My coworkers tell me when my work performance does not meet organizational standards. (continued)
182
EDUCATIONAL AND PSYCHOLOGICAL MEASUREMENT
Appendix (continued)
Source availability
On those occasions when my job performance falls below what is expected, my supervisor lets me know.
On those occasions when my job performance falls below what is expected, my coworkers let me know.
On those occasions when I make a mistake at work, my supervisor tells me.
On those occasions when I make a mistake at work, my coworkers tell me.
My supervisor is usually available when I want performance information.
My coworkers are usually available when I want performance information.
My supervisor is too busy to give me feedback.
My coworkers are too busy to give me feedback.
I have little contact with my supervisor.
I have little contact with my coworkers.
I interact with my supervisor on a daily basis.
I interact with my coworkers on a daily basis.
The only time I receive performance feedback from my supervisor is during my performance review. Promotes feedback seeking
My supervisor is often annoyed My coworkers are often annoyed when I directly ask for perwhen I directly ask them for performance feedback. formance feedback. When I ask for performance When I ask for performance feedfeedback, my supervisor genback, my coworkers generally do erally does not give me the not give me the information right information right away. away. I feel comfortable asking my I feel comfortable asking my supervisor for feedback coworkers for feedback about my about my work performance. work performance. My supervisor encourages me My coworkers encourage me to ask to ask for feedback whenever for feedback whenever I am I am uncertain about my job uncertain about my job performance. performance.
References Albright, M. D., & Levy, P. E. (1995). The effects of source credibility and performance rating discrepancy on reactions to multiple raters. Journal of Applied Social Psychology, 25, 577600.
STEELMAN ET AL.
183
Ashford, S. J. (1989). Self assessments in organizations: A literature review and integrative model. In B. M. Staw & C. C. Cummings (Eds.), Research in organizational behavior (Vol. 11, pp. 133-174). Greenwich, CT: JAI. Ashford, S. J. (1993). The feedback environment: An exploratory study of cue use. Journal of Organizational Behavior, 14, 201-224. Ashford, S. J., & Cummings, L. L. (1983). Feedback as an individual resource: Personal strategies of creating information. Organizational Behavior and Human Performance, 32, 370398. Ashford, S. J., & Northcraft, G. B. (1992). Conveying more (or less) than we realize: The role of impression management in feedback seeking. Organizational Behavior and Human Decision Processes, 53, 310-334. Carmines, E. G., & McIver, J. P. (1981). Analyzing models with unobservable variables. In G. W. Bohrnstedt & E. F. Borgotta (Eds.), Social measurement: Current issues (pp. 65-115). Beverly Hills, CA: Sage. Dorfman, P. W., Stephan, W. G., & Loveland, J. (1986). Performance appraisal behaviors: Supervisor perceptions and subordinate reactions. Personnel Psychology, 39, 579-597. Duarte, N. T., Goodson, J. R., & Klich, N. R. (1994). Effects of dyadic quality and duration on performance appraisal. Academy of Management Journal, 37, 499-521. Fedor, D. B., Eder, R. W., & Buckley, M. R. (1989). The contributory effects of supervisor intentions on subordinate feedback responses. Organizational Behavior and Human Decision Processes, 44, 396-414. Giffin, K. (1967). The contribution of studies of source credibility to a theory of interpersonal trust in the communication process. Psychological Bulletin, 68, 104-120. Greller, M. M. (1980). Evaluation of feedback sources as a function of role and organizational level. Journal of Applied Psychology, 65, 24-27. Greller, M. M., & Parsons, C. K. (1992). Feedback and feedback inconsistency as sources of strain and self-evaluation. Human Relations, 45, 601-620. Hanser, L. M., & Muchinsky, P. M. (1978). Work as an information environment. Organizational Behavior and Human Performance, 21, 47-60. Herold, D. M., Liden, R. C., & Leatherwood, M. L. (1987). Using multiple attributes to assess sources of performance feedback. Academy of Management Journal, 4, 826-835. Herold, D. M., & Parsons, C. K. (1985). Assessing the feedback environment in work organizations: Development of the job feedback survey. Journal of Applied Psychology, 70, 290-305. Hu, L., & Bentler, P. M. (1999). Cutoff criteria for fit indexes in covariance structure analysis: Conventional criteria versus new alternatives. Structural Equation Modeling, 6, 1-55. Ilgen, D. R., Fisher, C. D., & Taylor, M. S. (1979). Consequences of individual feedback on behavior in organizations. Journal of Applied Psychology, 64, 349-371. Ilgen, D. R., & Hamstra, B. W. (1972). Performance satisfaction as a function of the difference between expected and reported performance at five levels of reported performance. Organizational Behavior and Human Performance, 7, 359-370. Ilgen, D. R., & Moore, C. F. (1987). Types and choices of performance feedback. Journal of Applied Psychology, 72, 401-406. Ilgen, D. R., Peterson, R. B., Martin, B. A., & Boeschen, D. A. (1981). Supervisor and subordinate reactions to performance appraisal sessions. Organizational Behavior and Human Performance, 28, 311-330. Kluger, A. N., & DeNisi, A. (1996). The effects of feedback interventions on performance: A historical review, a meta-analysis, and a preliminary feedback intervention theory. Psychological Bulletin, 119, 254-284. Larson, J. R. (1986). Supervisors’performance feedback to subordinates: The impact of subordinate performance valence and outcome dependence. Organizational Behavior and Human Decision Processes, 37, 391-408.
184
EDUCATIONAL AND PSYCHOLOGICAL MEASUREMENT
Larson, J. R., Glynn, M. A., Fleenor, C. P., & Scontrino, M. P. (1986). Exploring the dimensionality of managers’ performance feedback to subordinates. Human Relations, 39, 1083-1102. Levy, P. E., Albright, M. D., Cawley, B. D., & Williams, J. R. (1995). Situational and individual determinants of feedback seeking: A closer look at the process. Organizational Behavior and Human Decision Processes, 62, 23-37. Levy, P. E., & Steelman, L. A. (1994, April). Feedback seeking climate and performance appraisal. Paper presented at the ninth annual meeting of the Society for Industrial and Organizational Psychology, Nashville, Tennessee. Liden, R. C., Wayne, S. J., & Stilwell, D. (1993). A longitudinal study on the early development of leader-member exchanges. Journal of Applied Psychology, 78, 662-674. London, M. (1997). Job feedback: Giving, seeking, and using feedback for performance improvement. Hillsdale, NJ: Lawrence Erlbaum. Makiney, J. D., & Levy, P. E. (1998). The influence of self-ratings versus peer ratings on supervisors’performance judgments. Organizational Behavior and Human Decision Processes, 74, 212-228. Meyer, H. H. (1991). A solution to the performance appraisal feedback enigma. Academy of Management Executive, 5, 68-76. Morrison, E. W. (1993). Longitudinal study of the effects of information seeking on newcomer socialization. Journal of Applied Psychology, 78, 173-183. Murphy, K. R., & Cleveland, J. (1995). Understanding performance appraisal. Thousand Oaks, CA: Sage. Scandura, T. A., & Graen, G. B. (1984). Moderating effects of initial leader-member exchange status an the effects of a leadership intervention. Journal of Applied Psychology, 69, 428-436. Taylor, M. S., Fisher, C., & Ilgen, D. (1984). Individuals reactions to performance feedback in organizations: Control theory perspective. In K. Rowland & G. Ferris (Eds.), Research in personnel and human resource management (pp. 81-124). Greenwich, CT: JAI. Williams, J. R., Miller, C., Steelman, L. A., & Levy, P. E. (1999). Increasing feedback seeking in public contexts: It takes two (or more) to tango. Journal of Applied Psychology, 84, 969-976.
Request Permission or Order Reprints Instantly Interested in copying, sharing, or the repurposing of this article? U.S. copyright law, in most cases, directs you to first get permission from the article’s rightsholder before using their content. To lawfully obtain permission to reuse, or to order reprints of this article quickly and efficiently, click on the “Request Permission/ Order Reprints” link below and follow the instructions. For information on Fair Use limitations of U.S. copyright law, please visit Stamford University Libraries, or for guidelines on Fair Use in the Classroom, please refer to The Association of American Publishers’ (AAP).
All information and materials related to SAGE Publications are protected by the copyright laws of the United States and other countries. SAGE Publications and the SAGE logo are registered trademarks of SAGE Publications. Copyright © 2003, Sage Publications, all rights reserved. Mention of other publishers, titles or services may be registered trademarks of their respective companies. Please refer to our user help pages for more details: http://www.sagepub.com/cc/faq/SageFAQ.htm
Request Permissions / Order Reprints