THE VENUSIAN ENVIRONMENT F. W. Taylor, P.L. Read, and S.R. Lewis Atmospheric, Oceanic and Planetary Physics, Clarendon Laboratory, Parks Road, Oxford, UK, OX1 3PU, England. Tel 44 1865 272933 Fax 44 1865 272923 Email:
[email protected],
[email protected],
[email protected] F. Hourdin, F. Forget and O. Talagrand Laboratoire de M'et'eorologie Dynamique du CNRS, Ecole Normale Sup'erieure, 24 rue L’homond, 75 231, Paris Cedex 05, France. Tel 33 1 44 32 22 47 Fax 33 1 43 36 83 92 Email:
[email protected],
[email protected],
[email protected] M.A. Lopez-Valverde, M. Lopez-Puertas Instituto de Astrofisica de Andalucia (CSIC) Apdo. 3004, 18080 Granada, Spain Phone: +34-958-121311 Fax: +34-958-814530 Email:
[email protected],
[email protected]
Page 2 of 45
CONTENTS THE VENUSIAN ENVIRONMENT...................................................................................... 1 CONTENTS ........................................................................................................................... 3 1 INTRODUCTION............................................................................................................... 5 2 SPACECRAFT ENVIRONMENTAL FACTORS ............................................................. 5 2.1 ENTRY PROBES and LANDERS ................................................................................. 5 Entry And Descent Phase ............................................................................................... 6 Landing And Surface Operation .................................................................................... 9 2.2 ORBITERS .................................................................................................................. 10 Orbit Insertion By Aerocapture .................................................................................... 10 Orbit Optimization By Aerobraking ............................................................................ 11 3 GLOBAL CHARACTERISTICS OF VENUS ................................................................. 11 3.1 INTRODUCTION ....................................................................................................... 11 3.2 Energy Balance .......................................................................................................... 12 3.3 Composition. ............................................................................................................. 13 4 SURFACE PROPERTIES ................................................................................................ 15 4.1 TOPOGRAPHY .......................................................................................................... 15 Volcanic Features ......................................................................................................... 18 Tectonic Features ......................................................................................................... 19 Impact Craters .............................................................................................................. 19 4.2 Magellan Datsets........................................................................................................ 20 5 ATMOSPHERIC PROPERTIES ...................................................................................... 20 5.1 Thermal structure....................................................................................................... 20 5.2 Clouds......................................................................................................................... 23 5.3 Radiative Transfer In The Upper Atmosphere ........................................................... 25 Cooling rates ................................................................................................................ 28 Heating rates................................................................................................................. 28 Radiative equilibrium temperature ............................................................................... 29 5.4 Aeronomy ................................................................................................................... 30 Processes related to the physical separation and escape of atmospheric constituents. 30 Non-LTE radiative transfer processes. ......................................................................... 31 Dissociation, ionisation, and photochemistry. ............................................................. 31 6 THE GLOBAL CIRCULATION AND DYNAMICS..................................................... 31 7 MODEL ATMOSPHERES ............................................................................................... 34 7.1 A VENUS REFERENCE ATMOSPHERIC MODEL.................................................. 34 7.2 GLOBAL CIRCULATION MODELS ......................................................................... 34 Basic Concept............................................................................................................... 34 Dynamical formulations and discretization.................................................................. 34 Parameterizations ......................................................................................................... 36 Application to planetary atmospheres.......................................................................... 36 7.3 SIMULATING ATMOSPHERIC SUPER-ROTATION WITH GCMS ........................ 37 Recent simulations of atmospheric super-rotation....................................................... 37 7.4 DEVELOPING A NEW GLOBAL CIRCULATION MODELS FOR VENUS ........... 39 General requirements ................................................................................................... 39 Radiative transfer ......................................................................................................... 40 8 A VENUS CLIMATE DATABASE................................................................................. 41 9 CONCLUSIONS............................................................................................................... 42 10 REFERENCES ................................................................................................................ 42
Page 3 of 45
Page 4 of 45
1 INTRODUCTION This report presents the first stage of results of a study of the atmospheric environment on Venus. The purpose of the study is to combine existing knowledge derived from measurements, theoretical studies and numerical general circulation models into a single model which can be used to specify conditions such as temperature, pressure, wind, humidity, and dust loading over a wide altitude range at any location, time of year, and time of day on Venus. This environmental model is intended for use in the design of future missions to Venus. The European Space Agency has already studied three such projects, ‘Venus Express’ orbiter, ‘Lavoisier’ entry probe, and ‘Venus Sample Return’. The actual implementation of these or something similar is an increasingly likely prospect in the next decade. The physical and dynamical properties of the atmosphere clearly are a major factor to be taken into account in designing hardware which can enter the atmosphere of Venus and perform properly under the extreme conditions which are known to prevail there. Other aspects to be studied with the aid of the model include the accuracy with which a particular design of vehicle can optimise its orbit using aerobraking, again taking into account factors such as the large day- night density variations in Venus’ upper atmosphere. The model therefore has to include not only the most probable description of the key atmospheric parameters, but also reliable estimates of the uncertainty in, and natural variance of, these quantities. The following sections contain a review of the existing knowledge of Venus and its atmosphere, and of how this knowledge was acquired. Section 2 provides, by way of introduction, some discussion of the main factors which design engineers need to take into account in planning a mission to enter Venus orbit safely and to operate inside the atmosphere and on the surface. The gross properties of the Venusian system are reviewed in Section 3, making appropriate comparisons with the other terrestrial planets, while sections 4-6 review in more detail the surface environment, atmospheric properties and global circulation respectively. Some background information on model formulation and presentation of outputs is also presented in Section 7 as a basis for the next stage of the study, the production of a new and improved model. The type of database which could result, and its applications, are covered in section 8 and the prospects for a successful European Venus modelling project are summarised in section 9. Finally, a comprehensive set of references to previous work is presented in section 10. 2 SPACECRAFT ENVIRONMENTAL FACTORS This section discusses environmental factors which may be of importance in planning a spacecraft mission which involves entering the atmosphere of Venus. The factors which affect the design of an entry probe fall into the following main categories: deployment variables, such as entry angle and parachute size, etc.; factors which affect the descent and landing site, such as pressure and wind speed; and factors which affect survival and the implementation of scientific experiments on the surface, such as temperature and pressure. The factors of importance for aerobraking into Venus orbit are principally the density, temperature and winds above 100 km altitude. These are considered in turn in the following sections. 2.1 ENTRY PROBES and LANDERS
Page 5 of 45
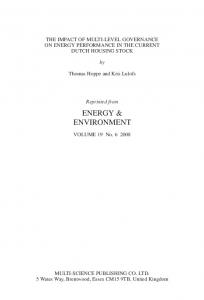
Figure 1. The Pioneer Venus Multiprobe spacecraft, showing the positioning of the coneshaped probes on the platform of the multiprobe bus (NASA). Entry And Desce nt Phase To perform a detailed entry and descent trajectory analysis will require vertical profiles of atmospheric temperature, pressure and wind as a function of height at all geographical locations under consideration for landing. During the entry, an entry probe experiences hypersonic, transonic and subsonic flight, starting out at a velocity likely to be in the range 5 to 15 km/s (the velocity was 11.6 km/s for the Pioneer Venus probes). A key parameter in designing the entry trajectory is determining the sonic altitude, or height above the surface where the entry vehicle decelerates through the sound barrier. This is likely to be in the range from 70 to 100 km. The primary factors controlling behaviour on entry for a given set of conditions are the shape of the module, factors such as its mass distribution, and the design of the parachutes. The former is likely to be a basic sphere-cone configuration with a cone angle in the region of 45 to 60 degrees, for maximum drag and high stability against tilting or tumbling during descent. The detailed design of the entry module must also take into account factors such as the heating effects of atmospheric drag, which affects the amount of insulation and ablative material which must be carried, and the constraints imposed by the accommodation available for the landers on the launch and interplanetary cruise vehicles. The flow field around the module must be known in order to compute the heating rates and the pressure distributions, which are needed to design the heat shield and the structure. In studies carried out for the NASA Pioneer project, entry was assumed to commence at a height of 200 km. The initial deceleration was accomplished using an aeroshell with an ablative heat shield of carbon phenolic bonded to its front face. A peak deceleration of 280g occurred soon after entry. At an altitude, which was not measured but can be estimated to be approximately 70km, the parachute was deployed. A pilot chute was mortar- fired from a compartment in the aeroshell at the same time as a pyrotechnic device was fired to release the main parachute cover. The pilot chute then pulled the main chute from its compartment; as soon as
Page 6 of 45
deployment was complete and stability obtained the aeroshell was released and allowed to fall away. Testing of the Pioneer entry system in the mid-1970s, was mainly empirical, using wind tunnels and drop-tests from aircraft. The most recent missions to enter Venus’ atmosphere were VEGA 1 and 2 in 1985. Each of these identical spacecraft included a balloon station for atmospheric measurements, as well as a lander similar in design to earlier Venera missions. The lander separated from the Vega spacecraft two days before arrival at Venus and entered the planet's atmosphere on a ballistic path. (The flyby spacecraft was then retargetted using Venus gravity assistance to intercept Comet Halley in March 1986.) Vega 2 entered the atmosphere on 15 June 1985 at 01:59:30 UT at 10.80 km/s with an entry angle of 19.08 degrees. The pilot parachute was deployed at 02:00:05 UT at an altitude of 65 km and the braking parachute opened 11 seconds later at 64.5 km. The upper heat protection hemisphere was released at this time and the lower hemisphere 4 seconds later at 64.2 km. The upper hemisphere contained the deployment system for the balloon aerostat, which was deployed at an altitude of 54 km. The parachute was released at 02:09:15 at 47 km. After this the lander was allowed to aerobrake through the thick Venus atmosphere, with drag devices minimizing vibrations and spin and providing stability. The lander touched down at 03:00:50 UT on 15 June 1985 at 8.5 S, 164.5 E, in eastern Aphrodite Terra.
Page 7 of 45
Fig.2. (a) The sequence of events in the descent of the Pioneer Venus probes. (b) Estimated height versus time for the Pioneer large and small probes; both took the same total time to reach the surface. After release from the heat protection hemisphere, the balloon deployed a two-stage parachute, and then unfolded and inflated. The 3.4 meter diameter balloon supported a total mass of 25-kg. A 5-kg payload hung suspended 12 meters below the balloon. It floated at approximately 50 km altitude in the middle, most active layer of the Venus three-tiered cloud system. Data from the balloon instruments were transmitted directly to Earth for the 47- hr lifetime of the mission. (The batteries had a lifetime of 60 hrs.) Very long baseline interferometry was used to track the motion of the balloon to provide the wind velocity in the clouds. The tracking was to be done by a 6-station network on Soviet territory and by a
Page 8 of 45
network of 12 stations distributed world-wide (organized by France and the NASA Deep Space Network). After two days the balloon entered the dayside of Venus and expanded and burst due to solar heating. The most recent design of an entry system for Venus was that undertaken by ESA in 1988 as part of a feasibility study for a Venus Sample Return Mission. This adopted the basic Pioneer Venus aerobraking design, with a 45 deg conical heat shield 4m in diameter and an entry mass of 4000kg, and a parachute system adapted from Huygens. A light cross-canopy drogue chute 1.7 m in diameter is deployed at Mach 0.8 to extract the back cover and the main chute, the latter 4.6m in diameter. A total entry time of 4000 s was calculated, of which just under 1 hr is spent below a height of 50 km. Landing And Surface Operation The Pioneer Venus probes were not designed for a soft landing on Venus, although one of them did continue to transmit for over an hour following impact. The Venera and VEGA landers used a toroidal system designed to absorb shock on landing. The most recent (sample return) study envisaged the deployment of a balloon (later to be used for the first stage of the ascent) during the final stages of the descent, to reduce the impact velocity to approximately 8 m/s. The lower part of the lander structure, exposed after release of the heatshield, is designed to be collapsible in order to absorb any remaining landing shock. It was calculated that 10 cm of crushable hone ycomb material would be sufficient for the low impact velocity anticipated. Once landed, the vehicle will need to survive the ambient conditions, in particular the very high temperature and pressure environment (720 k and 92 bar respectively). Depending on the operations to be performed at the surface, providing a suitable pressure vessel is not expected to be a major problem, although the mass implications are important. Winds are thought to be slight, at about 1/ms typically. Temperature is the most serious problem; in particular the effect on electronic subsystems inside the spacecraft. Although hightemperature electronics have been under development for some time, it is still likely that any mission to the surface of Venus in the foreseeable future will be restricted to the use of semiconductors with a maximum tolerance of about 40 C. Any kind of active refrigeration on the surface of Venus is similarly impractical at present and the only reasonable solution is temporary protection from the environment using insulating and heat-absorbing materials. The ESA study envisioned a cocoon of high-temperature multi- insulation, manufactured by stacking and sewing together crinkled reflective foils separated by ceramic fabric. In the more external part metallic, ceramic or PBO (Poly-Benzobis-Oxazole) films can be used directly, kapton, aramid or other polymers need to be combined with, for example, silica fabrics. A computation based on a selected blanket 47 Kg/m3 density gives a maximum internal temperature of 65 °C after 5 hours exposition to an environment with constant temperature of 450 °C. The other element of the thermal protection system is the cooling system of the external gas injected into the cocoon. This is designed to take advantage of the presence of the helium, needed to inflate the balloon to cool down the incoming gas through a heat exchanger set in correspondence of the cocoon opening. As the internal space is filled by the external CO2, during the descent time, the mass flow rate coming inside is low and so is the heat power to be removed. This permits utilisation of a compact and relatively lightweight heat exchanger with the helium flowing between the tanks and the balloon and the CO2 being injected in the cocoon after cooling. Electronics survival can be further enhanced by increasing the thermal inertia by the use of Phase Change Materials (PCM) in order to absorb the additional heat dissipated when the
Page 9 of 45
components are in operation. Materials are available that have high transformation temperatures, high latent heat and low density, combined with low volumetric change, although the last criterion limits the choice to solid to liquid and solid to solid (chemical transitions) transformations. The material with the best performance is phosphonium chloride but very few data are available on it; on the other hand, Lithium Nitrate Trihydrate (density 1550 Kg/m3) is well known and experimental data is available in the open literature. Disregarding the thermal ballast effect of the PCM itself, to keep within its temperature limits each component during the descent/surface/ascent phases, 0.036 Kg of material for each watt dissipated by the electronics are needed for 5 hours survival time. The total mass is then 9 Kg. Many configurations are possible. The simplest one is to directly attach a PCM metallic container to each electronic box by means of high conductance devices. Another possibility is to use a honeycomb support plate filled with PCM. Thermal control of the balloon is not a major concern if a high temperature resistant material is used for the hermetically sealed envelope. Options involve the use of layers of heat resistant silica fabric wrapped around a conventional envelope, but these are less efficient in terms of mass. Elements for the selection of the envelope material are density, mechanical properties at high temperature and the possibility to manufacture thin tight films. The most promising candidate is PBO (Polyphenylene-Benzobis-Oxazole), which gives a safety factor of about ten for temperatures up to 920 K. Although the material is commercially available, technological feasibility has to be verified and a complete characterisation in a simulated Venus environment has to be carried out. Also, the inflation and the characteristics (strength, tightness, etc...) of a densely packed PBO balloon envelope, after the long duration storage in space environment of the several months cruise to Venus has to be demonstrated. 2.2 ORBITERS In order to place a substantial mass in Venus orbit, without using a very large launch vehicle, two techniques involving interaction with the atmosphere are now available. The first is aerocapture, in which the spacecraft is targeted accurately to the level where atmospheric drag reduced its velocity relative to the planet to the point where it is captured in orbit. Obviously, erroneous targeting, or poor knowledge of the atmospheric conditions, can result in the spacecraft crashing into the planet, or missing it altogether. In either case the margin available is not great. The second, related technique is aerobraking, where the spacecraft achieves initial orbit by conventional means, i.e. using a retro- motor, and the orbit is subsequently adjusted by allowing small amounts of drag to occur near periapsis. By using many orbits over an extended period of time, aerobraking can be gradually increased and the risk is thereby reduced. Orbit Insertion By Aerocapture The aerocapture manoeuvre begins with a shallow approach angle to the planet, followed by a descent to relatively dense layers of the atmosphere. Once most of the needed deceleration is reached, the vehicle manoeuvres to exit the atmosphere. To account for the inaccuracies of the atmospheric entering conditions and for the atmospheric uncertainties, the vehicle needs to have guidance and control as well as manoeuvring capabilities. Most of the manoeuvring is done using the lift vector that the vehicle's aerodynamic shape (i.e., lift-to-drag ratio, L/D) provides. Upon exit, the heat shield is jettisoned to minimize heat soak and a short propellant burn is accomplished to raise the orbit periapsis. The entire operation requires the vehicle to operate autonomously while in the planet's atmosphere. Generally, because aerocapture entry velocities are very high, the integrated heat loads are higher than a direct entry and landing. Leading to requirements for new light-weight thermal protection materials for use on the aeroshell. Page 10 of 45
Aerocapture will be attempted for the first time at Mars, with the Mars Surveyor 2001 orbiter mission. In this case the entry vehicle is a 70° half-angle cone with a 2.4 m diameter base, providing an L/D of 0.18 at an angle of attack of 11.1°. Several aspects make aerocapture at Mars more challenging than at Venus. On Mars, random variations in density can occur rapidly due to the effects of a dust storm, and Mars rotates much faster than Venus and has gravitational "bumps" that create time- varying perturbations. Orbit Optimization By Aerobraking Aerobraking has been successfully implemented on the Magellan mission to Venus. In this case, the aerobraking surfaces were the spacecraft itself and the solar arrays. No special coating or thermal protection systems were added to the spacecraft, although the spacecraft was configured before atmospheric entry to have an aerodynamically stable shape. The orbit of
Figure 3. Aerobraking At Venus With Magellan Magellan was circularized during a 70 day aerobraking phase which ended in August 1993. The orbit apoapsis was lowered from an altitude of 8400 km down to 541 km, providing a ? V of about 1.2 km/s. This manoeuvre would have required an order of magnitude more propellant than Magellan was carrying at the time if done with a chemical burn. The surface temperatures measured on the solar panels did not exceed 84°C. Several small manoeuvres had to be executed to keep the atmospheric trajectory of the spacecraft within the acceptable corridor. 3 GLOBAL CHARACTERISTICS OF VENUS As a prelude to the more detailed discussion of the Venusian atmospheric and surface environment, we present in this section a brief review of the main planetary parameters and characteristics of Venus and the other terrestrial planets. 3.1 INTRODUCTION Venus is the nearest planet to the Earth, both in terms of distance and in overall size and mass (Table 1). However, Venus has lost most of its atmospheric and surface water, probably as an indirect consequence of its greater proximity to the Sun. A further result is that much of the carbon doxide which on the Earth has been processed by the oceans to produce carbonates is still free in the atmosphere on Venus. This in turn means that Venus’ atmosphere is very massive by terrestrial standards, with a surface pressure of almost 100 bars and a searingly high surface temperature in excess of 730 K. The basic physical characteristics of the planet are summarised in the following table, where the second column shows the ratio with the Earth:
Page 11 of 45
Venus
Venus Earth
Mass Radius Density
4.87 x 1027 g 6051 km 5.2 g/cm3
0.815 0.95 0.943
Equatorial gravity
887 cm/s2 243 days (retrograde) 224.7 days 2.70 0.007 108.2 x 10⁶ km
0.907
Rotation period Orbital period Obliquity Orbital eccentricity Mean distance from Sun
243 0.615 0.115 0.407 0.723
Table 1. Basic data for Venus, and the ratio to the value of the same parameter for the Earth The rotational axis of Venus is nearly perpendicular to the ecliptic, and the orbit is nearly circular, so seasonal changes in the climate are probably very small. The Venusian year is 224.7 Earth days, longer than the time for Venus to rotate on its axis, which is 243 Earth days. The solar day, defined as the time for the Sun to go from noon to noon as seen from the surface of Venus, is about 117 Earth days. This very slow rotation of the solid body of Venus is retrograde, i.e. backwards compared to the other planets, a curious state of affairs which is difficult to explain in terms of presently accepted models of the evolution of the Solar System (q.v.). The resulting absence of a strong Coriolis force, near the surface at least, is a major factor in determining the structure and dynamics of the atmosphere. Persistent high winds of the order of 100 metres per second are observed near the cloud tops, 50 or 60 km above the surface, where the density of the air is similar to that near the ground on the Earth. It is not known reliably how these are produced. The surface of Venus is obscured at visible wavelengths by planet-wide cloud cover, the upper layers at least consisting of sulphate aerosol similar to the much thinner layers of volcanic origin found in the terrestrial stratosphere. On Venus, the clouds have complex layered structure and, although never completely absent, very variable coverage. They play an even larger rôle in the energy balance of the planet than clouds do on Earth, through their contribution to the atmospheric ‘greenhouse effect’. Localised dynamical or ‘weather’ activity on Venus, so far as is known at present, is dominated by four main phenomena: the cloud-top zonal super-rotation, the ultraviolet markings and associated planetary waves, cumulus dynamics in the deeper layers, and the double vortex structures at the poles. These and other types of activity, such as atmospheric tides, are no doubt linked to each other and to the general circulation, but all remain poorly understood (see §5). 3.2 Energy Balance At a distance of 108.2 million km, Venus is closer to the Sun than the Earth by a factor of about √2, and so has about twice the incidence of solar energy. It is also much hotter at the 1 surface, nearly 2 times more than the terrestrial mean of about 300 K. These facts are not 2 simple to reconcile, however, because the ubiquitous and highly reflective cloud cover on Venus reflects 76% of the incoming solar flux and this results in a smaller net solar constant Page 12 of 45
for Venus than for Earth. The high surface temperature must, therefore, be due to ‘greenhouse’ warming produced by the thick, cloudy atmosphere, possibly augmented by a contribution from the interna l heat of the planet. It is not simple to prove that the observed atmospheric conditions can in fact generate such a large ‘greenhouse’ effect. The problem is that the massive amounts of carbon dioxide are very effective at blocking the emission of therma l infrared radiation, but only at those wavelengths where the gas has absorption bands, which are far from covering the entire spectrum. Moderate amounts of water vapour are also required, and even then considerable spectral gaps or ‘windows’ remain. These could be blocked by the clouds, since liquid or solid absorbers present some opacity at every wavelength, the details depending on composition and particle size. The problem for early theorists was that using clouds to ‘close’ the greenhouse also tended to block the incoming sunlight, so that the calculated equilibrium temperature of the surface remained well below that observed. This problem began to be resolved when it was realised that the clouds are made of sulphuric acid droplets, at least in the higher, most easily measured layers. These have the property of being highly absorbing at thermal infrared wavelengths, while being nearly conservative scatterers in the visible and near infrared. Thus, the clouds tend to diffuse downwards those of the incoming solar photon that they do not reflect to space, while blocking thermal emission from the lower atmosphere and surface. This explains the result, surprising at the time, that the Venera landers in the 1970s were able to photograph the surface in natural light. It also means that radiative transfer models, involving weak as well as strong bands of CO2 and H2O, plus those of the minor constituents CO, HCl and SO2, can account for the high surface temperatures by careful incorporation of the scattering and absorbing properties of the clouds. The total solar energy diffusing through the cloud cover on Venus corresponds to about 17 watts per cm2 of surface insolation on the average, about 12% of the total absorbed by the planet and the atmosphere. The high opacity of the gaseous atmosphere and cloud at longer wavelengths requires the surface to reach temperatures high enough to melt zinc before the upwelling flux is intense enough, and at shorter wavelengths, so that equilibrium is attained. An airless body with the same albedo and at the same distance from the Sun as Venus would reach equilibrium for a mean surface temperature of only about 230 K. This 500K greenhouse enhancement of the surface temperature compares with only about 30K on Earth and 10K on Mars. 3.3 Composition. The primordial atmosphere of Venus which originally formed with the solid body, like those of the other terrestrial planets, was likely to have been lost in the distant past as the young Sun went through phases of high activity. The present atmosphere would have been produced much later by outgassing from the crust, a process which we observe today as active volcanism, and by the influx of cometary and meteoritic material, which is also still going on. The relative contributions of these distinct sources can, to some extent, be deduced from the data which is gradually being accrued on the composition, and in particular the isotopic ratios, in the contemporary terrestrial planet atmospheres, and in comets and meteorites.
Carbon dioxide Nitrogen
Page 13 of 45
Venus
Earth
Mars
.96 .035
.0003 .770
.95 .027
Argon Water vapour Oxygen Sulphur dioxide Carbon monoxide Neon
.00007 ~.0001(?) .0013 .00015 .00004 5 ppm
.0093 ~.01 .21 .2 ppb .12 ppm 18 ppm
.016 ~.0003 ~0 .0007 2.5 ppm
Table 2. Composition of the Terrestrial Planet Atmospheres, as fractional abundances except where ppm (parts per million) is stated. Comets are a rich source of volatile compounds such as carbon dioxide, water vapour, methane, and ammonia. If the last of these was the source of the nitrogen now present, and we allow for processes such as the production of argon by the decay of radioactive potassium in the crust, the contemporary atmosphere could all be of external origin. On the other hand, the high abundance of sulphur in Venus’ clouds is strongly suggestive of extensive volcanic activity and volcanoes are also prolific sources of carbon dioxide, nitrogen and the other gases required to explain present-day Venus. Apart from carbon dioxide and water vapour, Venus' atmosphere consists primarily of inert gases, particularly nitrogen and argon (Table 2). The amount of water present as gas and bound up with sulphuric acid and other compounds in the clouds is between ten and one hundred thousand times less than exists in the oceans and atmosphere of the Earth. Thus Venus is overall very dry compared to the Earth while, at the same time, deuterium is about one hundred times more abundant on Venus than Earth. This suggests that Venus had much more water initially, but that most of it has been lost. Loss takes place by dissociation of the water in the upper atmosphere by solar ultraviolet radiation, and the subsequent escape of the hydrogen. Both deuterium and normal hydrogen escape from the atmosphere while there is free water on the surface, but the heavier isotope escapes less efficiently, leading to the observed fractionation. The loss rate of the water depends strongly on its abundance in the relatively cool middle atmosphere, as well as the intensity of the solar ultraviolet flux. Models of the process suggest that Venus could have lost an ocean of present-day terrestrial proportions in only a few hundred million years. The oxygen produced at the same time is too massive to escape at any significant rate, according to Jeans’ formula, and must remain on the planet, presumably most of it bound chemically within the crust, mainly as carbonate rocks. As on the Earth, this process would remove atmospheric carbon dioxide efficiently so long as liquid water was available. Once the free water was all used up, the mixing ratio of water vapour in the upper atmosphere would fall sharply and the loss rates of both forms of hydrogen, and the take up of oxygen into minerals, have also declined to the present relatively low levels. In the modern atmosphere of Venus, chemical reactions coupled with transport and radiative processes regulate the abundances of the most important minor constituents. The most important are the cycles involving water vapour, sulphuric acid and their products, which maintain the cloud layers, and which probably also involve reactions between the atmosphere and the surface. Another is that which gives rise to the observed distribution of carbon monoxide. CO is very abundant (mixing ratios of the order of a few parts per thousand by volume) in the upper atmosphere of Venus, as would be expected from the action of solar ultraviolet radiation on carbon dioxide. It is strongly depleted in the cloud layers (50 hours at this altitude) Venus night. 5.3 Radiative Transfer In The Upper Atmosphere Page 25 of 45
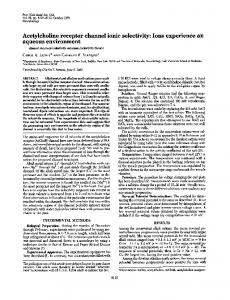
Radiative transfer models for Mars can also be applied to the upper atmosphere of Venus, with only a few modifications, because both have a nearly pure CO2 atmosphere. In the lower atmosphere of Venus, however, the prevailing temperatures and pressures are much higher and the codes have to be modified and extended to take this extended regime into account. Less work has been done on radiative transfer models for Venus in recent years, partly because the studies are generally stimulated by plans for space experiments intended to make relevant measurements, and Mars is now the centre of attention in this respect. A decade or two ago, the situation was reversed, and a great deal of what is now known about radiative conditions on Venus still depends on pioneering work done then, especially by Dickinson. His approach was first to calculate a global mean radiative equilibrium temperature profile, including all processes thought to be of importance for the global heat budget between 65 and 135 km, including non-LTE, with a simple treatment of other aspects like overlapping between lines. (LTE stands for local thermodynamic equilibrium, the condition which applies in general when the populations of molecular energy levels are determined by collisions rather than radiative exchange). He pointed out the particular importance of including the combination and, especially, the isotopic bands of co2. As for the case of Mars, these weaker bands have a disproportionate effect because radiative transfer of energy can take place over much longer distances than in the strong fundamentals of the commonest isotope. Only bands with a strength at least five orders of magnitude less than the strongest bands can be neglected. This effect is illustrated in Fig.10, which shows the contribution of a single spectral line to the cooling rate from the 10µm level. Even at this low pressure, the core of a strong line is completely absorbing and cooling to space is negligible, except in the line wings. A weak line, on the other hand, emits strongly to space from its Doppler core.
Page 26 of 45
Figure 10. The outer line is the emission profile of a 15µm band line at the 10µmbar level on Venus. The other lines are the angle--integrated contributions to the net cooling from that level of a line with the strength k indicated. The abscissa is in units of the Doppler width (after Dickinson, (1976). Dickinson refined some aspects of his original work in later revisio ns, like the collisional coupling in his non-LTE model. For more than a decade his radiative studies have remained unmodified, and guided the work of the group at NCAR and Arizona University that developed the most complete thermospheric global circulatio n model of Venus to date. In particular he studied the susceptibility to non-LTE of temperature sounding experiments which were at that time (1975) in preparation for space missions to Venus. He showed that the 15µm fundamental band could be considered to be in LTE up to pressures as low as 1µbar, but that at lower altitudes most of the photons escaping to space originated in the hot and isotopic bands. This meant basically that `wide-band' measurements centred in the fundamental could sound the Venusian mesosphere without taking account of non- LTE, but the use of pressure modulators to sound the lower thermosphere would require a more complex interpretation. Only recently new and more complete non-LTE models developed at the Instituto de Astrofisica de Andalucia in Granada have been applied to the Mars and Venus atmospheres. They improved upon previous codes like Dickinson's in the incorporation of the most recent rate coefficients and spectroscopic data, and by extending the number of CO2 levels and transitions studied simultaneously. These models represent useful tools to help in the interpretation of satellite data and the design of radiative parameterizations for global circulation models.
Page 27 of 45
Cooling rates All previous studies which computed the cooling and heating rates for the Venusian and Martian atmospheres stress the important role of atomic oxygen: the thermal collision between CO2 and O is a key process in the cooling of the upper layers of a CO2 atmosphere. A typical cooling rate profile produced by the co2 15µm emission on Venus is shown in Fig.11. The maximum cooling of about 130K/day occurs between 120 and 130km and shows a double peak, caused by the fact that the contributions of the main and minor isotopes peak at different altitudes. This large radiative cooling keeps the thermospheric temperature well below Earth's values (300 K versus 1000-2000 K). Again, the emission from the minor isotopes would be much less were it not for the large energy transfer by V-V coupling between their (0,11,0) levels and that of 626.
Figure 11. Contributions and total cooling rate (in K per terrestrial day) produced by the CO2 15µm bands for the night time kinetic temperature profile. Heating rates The solar heating rates show one major difference from Mars, in that the absorption coefficients decrease with height in the upper atmosphere because the Venus thermosphere is depleted in CO2 above 140km. Between 90 and 110km bands of very different strengths give similar absorption rates, although peaked at different heights. The penetration of the solar flux into the atmosphere is larger at shorter wavelengths, where most of the weak bands are located, allowing them to make important contributions to the heating rate, as they do on Mars.
Page 28 of 45
Figure 12. Total solar heating rates of the Venusian atmosphere for solar zenith angle =60o . The total solar heating rate for a solar zenith angle of 60o appears in Fig.12, with the contributions from the different near-IR bands shown separately. As for Mars, much of the energy initially absorbed from solar radiation is emitted back to space, and radiative transfer and V-V collisions play major roles. The maximum total solar heating amounts to more than 1500K/day between 120 and 135km with a double peak due to the different heights of the individual maxima, like the cooling rate curve. Significant cooling is found on Venus only above about 100km and below about 150km, the corresponding heights on Mars being 65 and 125km (Fig.10). Above these limits, all of the solar energy absorbed is re-emitted to space before it can be quenched by thermal collisions. In the lower atmosphere, the solar flux is too attenuated to have much effect. Radiative equilibrium temperature In terms of global mean energy budget, carbon dioxide cooling at 15 microns dominates over eddy diffusion below 200 km. and over molecular conduction below 150 km; while solar heating in its near-IR bands is larger than the EUV heating below about 140 km. Therefore, from 140 km down to about 60 km (where vertical convection takes over as the principal vertical heat transfer mechanism) it is reasonable to apply a radiative equilibrium model to simulate the Venus mesosphere and lower thermosphere.
Page 29 of 45
Figure 13. Radiative equilibrium temperature profiles for dayside (D), global mean (GM), and nightside (N). The reference temperature profiles are also plotted (dotted lines).} The global mean radiative equilibrium temperature in Fig.13 was computed using a diurnally averaged solar heating rate, calculated for a solar zenith angle of 60deg and divided by 2. This shows a maximum around 110km produced by the solar absorption in the near-IR and in the weak bands at 4.3 and 2.7µm. The inflexion above 125km is due to the solar heating in the 2.7µm bands. The differences between day and night-time conditions are particularly extreme, given the slow rotation of Venus. The purely radiative model predicts very cold temperatures in the night-time thermosphere, and a contrast with the daytime which is larger than Pioneer Venus observed. The difference is probably due primarily to adiabatic heating by dynamics, rather than errors in the radiative transfer calculations and their rate coefficients. 5.4 Aeronomy Aeronomy refers to the study of non-equilibrium processes which occur most prominently at low atmospheric densities. Frequently these are associated directly or indirectly with solar excitation and give rise to non-equilibrium radiative emissions that, under the generic name of airglow, can be detected and used to study the upper atmosphere. In addition to the intrinsic interest in themselves, these processes are sometimes (in the absence of in-situ data) the only access to some atmospheric regions. A number of reviews of what is known in this field have appeared recently. The aerono my processes can be grouped under three main headings, as follows. Processes related to the physical separation and escape of atmospheric constituents. Solar Lyman-alpha radiation excite hydrogen, and the resonant atmosphere airglow has been used to obtain information about atomic hydrogen above 200 km. The values found require a large upward flux of H in the lower thermosphere at the sub-solar point, which seems to support an interhemispheric circulation. Apparently the escape flux of H decreases with solar activity, as they do the sputtering of oxygen atoms and pick up of ions by the solar wind. The
Page 30 of 45
exosphere, where the scale height and the mean free path are about equal, is located at 210 and 154 km during day and night, respectively. UV nightglow in gamma and delta bands of NO, excited by radiative recombination of N and O atoms, has been particularly valuable for constraining the circulation in the region between 115 and 150 km. The 2 hour offset in the night peak of NO emission toward the morning terminator indicates retrograde super-rotating zonal (RSZ) winds around 50 m s-1 at those altitudes. Non-LTE radiative transfer processes. Similarly excited by solar radiation, this group includes mostly those constituent emissions in the IR part of the spectrum, and the most important are the CO2 bands between 1.2 and 4.3 microns, CO(1-0) and (2-1) bands at 4.7 microns, and the O2 infrared atmospheric band at 1.27 microns. Images taken from Earth of these O2 bands in the night hemisphere show rapid changes in intensity that may be associated with variations in downwelling of atomic oxygen transported by the global circulation from the sunlit hemisphere. Also, observations of rotational lines of the CO bands (1-0) and (2-1) have been used to derive sub-solar to antisolar (SS-AS) winds at the altitudes 125-145 and 100-110 km, respectively. These emissions result from direct solar fluorescence at 4.7 microns and from UV photolysis of CO2 . Apparently the SS-AS winds increase with altitude, and are much more stable over time than the RSZ winds, which show a very large variability in short and long term scales. Dissociation, ionisation, and photochemistry. A current problem is related to carbon dioxide recombination in the mesosphere. As on Mars, the atmosphere is poor in the photodissociation products O and CO, but on Mars we know the photochemistry of H2 O participates in a cycle to reconstitute CO2 . On Venus, however, the mesosphere appears to be very dry and it is necessary to look for alternative catalytic cycles. Important links between photochemistry and radiation can be highlighted. The Venusian thermosphere is colder than the Martian case because of its larger atomic oxygen abundance, and it is very stable against variations in the solar flux because when this increases (solar rotation, solar cycle, etc) the atomic oxygen increases, and consequently the IR cooling by CO2 . 6 THE GLOBAL CIRCULATION AND DYNAMICS As a result of the slow rotation of the planet, its near circular orbit and small obliquity, the underlying circulation of Venus’ atmosphere is quite simple. The Sun is always above the equator, to within a couple of degrees, so the air warmed at low latitudes rises and moves towards the poles, where it cools and descends before returning equatorwards at lower altitudes.
Page 31 of 45
QuickTime™ and a QuickDraw decompressor are needed to see this picture.
Figure 14. (a) Profiles of the zonal (east-to -west) and meridional (equator-to-pole) wind on Venus as measured by tracking the Pioneer Venus and the Venera 8,9,10, and 12 entry probes. Note the suggestion of global layering, consisting perhaps of stacked 'Hadley' circulation cells of considerable latitudinal extent. On top of this simple picture are superimposed various complications. One that has been observed for many decades, but remains difficult to explain, is the global 'super-rotation', which manifests itself in cloud structure which moves rapidly around the planet in a direction parallel to the equator. The cloud markings, which appear with high contrast through an ultraviolet filter, have their origin at heights 50 or 60 km above the surface (where the pressure is of the order of 100 mb) and travel around the equator in 4 to 5 days, corresponding to speeds near 100 m s-1. This is more than 50 times faster than the rotation rate of the surface below. Measurements of the winds below the clouds (Fig.14), and calculations (from temperature data) of the winds above the cloud tops, show that the zonal wind speed declines at higher and lower levels, reaching values near zero at about 100 km and near the surface respectively. Direct measurements of the winds 1 m or so above the surface by the Russian landers Venera 9 and 10 found velocities of = 1 m s-1. Tracking of the Pioneer and Venera landers during their descent showed that there is a steady decrease with height from the 100 m s-1 or so observed in the ultraviolet markings near the cloud tops. Earth-based observers had earlier shown, by the measurement of Doppler shifted emission lines from atmospheric gases, that the cloud-tracked winds do, in fact, apply to mass motions, rather than the phase speed of waves as had also been suggested. Attempts have been made to explain these high zonal wind speeds on Venus by several mechanisms, all of which fall into one of three main categories, viz. (i) the gravitational interaction of the Sun with the atmospheric tides, (ii) the overhead motion of the Sun in the sky (the 'moving flame ' mechanism), and (iii) the upward transport of momentum from the surface. Currently prevailing opinion favours a version of mechanism (iii), in which Page 32 of 45
momentum from the solid planet is transported by waves whose interaction with the main flow is complex and in which the mean meridional circulation plays an important role. Parameterizations have been found which are able to produce large zonal velocities in dynamical models of the Venusian atmosphere, although of course this is not the same as saying that we understand the forcing or dissipation mechanisms responsible for the transfer of momentum from the surface to the cloud tops. The cloud motions which trace the zonal winds also reveal some aspects of the pattern of the meridional circulation on Venus. As expected on the simple theoretical grounds outlined above, Hadley cells exist in each hemisphere. These are global-scale circulation cells characterised by rising motion all around one constant latitude belt and descending motion at another. Each cell extends to higher latitudes than on Earth, in part a consequence of the slower zonal rotation speeds. Near the poles on Venus, a complex instability develops, resulting in dramatic long- lived wave structures. The polar collar takes the form of a ribbon of very cold air, some 10 km deep and a thousand km in radius, centred on the pole. Inside the collar, temperatures are some 40 K cooler than outside the feature (Fig. 15). Poleward of the inner edge of the collar lies the polar dipole, a wavenumber 2 feature consisting of two welldefined warm regions circulating around the pole. Both the dipole and the collar have so far resisted attempts to model them as normal modes of the atmosphere.
Figure 15. The polar dipole, imaged at 11.5 µm in the thermal infrared by Pioneer Venus. The cloud-tracked winds obtained from Pioneer Venus and Mariner 10 both show equator-topole velocities of around five metres per second in each hemisphere. Tracking of the PV probes shows winds of this magnitude at about 50 - 60 km altitude, with a very complicated
Page 33 of 45
vertical structure (fig. 14). One possible interpretation of the alternations in the direction, as well as the magnitude, of the meridional wind, is that these could mark the passage of the probe through the different components of a stack of Hadley cells, each extending from the equator to high latitudes. The layered eddy sources and sinks which have been postulated as driving the zonal super-rotation may be related to the cell interfaces in this scenario. Motions in the deeper atmosphere were observed by near- infrared imaging carried out by the Galileo probe in 1990. The features observed on the night side of the planet at wavelengths from 1 to 3.5 µm originate in the main cloud deck, illuminated from below by thermal emission from the hot lower atmosphere. The typical velocities inferred near the equator were about half as fast as those from uv markings, which is consistent with the vertical profiles of wind and cloud opacity measured by the Pioneer and Venera probes, since the cloud layer providing most of the opacity in the case of the near- ir markings is 10 to 15 km deeper than for the UV markings. The Galileo winds feature a zonal jet of more than 100 ms1 at middle latitudes, and equator-to-pole drifts of a few ms-1. 7 MODEL ATMOSPHERES 7.1 A VENUS REFERENCE ATMOSPHERIC MODEL Most of the observational information we have about the Venus atmosphere comes from the Pioneer Venus (PV) mission of the late 1970s. More recently, high resolution infrared spectra were obtained by the Near-IR Mapping Spectrometer (NIMS) during the Galileo fly-by in 1991, but temperatures were derived only between 60 and 100km. Due to the significant daynight variation, we need to consider separate day and night-time reference temperature profiles, both taken from the PV measurements and shown in Fig.13. The densities and atomic oxygen abundances appear in Fig.16. Note that CO2 is the major constituent only below about 140km. 7.2 GLOBAL CIRCULATION MODELS Basic Concept Global or general circulation models are a widely used tool in weather forecasting, climate forecasting and meteorological research. The basic idea is to produce a simulation of an atmosphere by solving the partial differential equations (PDEs) that govern the motion of the atmosphere subject to initial and boundary conditions. Although in principle it is possible to solve the equations exactly, there is no computer in the world that is powerful enough to do this. Also the initial conditions i.e. the state of an atmosphere at any particular time and the boundary conditions e.g. the surface albedo, cannot be known exactly. Hence one must approximate the system of PDEs and initial and boundary conditions in order to make the problem tractable. This approximation gives limitations on the performance of a GCM. Classical approaches to this problem and associated limitations, which afflict all GCMs, are described below. Dynamical formulations and discretization The motion of an adiabatic, frictionless planetary atmosphere can be described using the Navier-Stokes equations of fluid motion. When modelling an atmosphere however, it is appropriate to solve an approximate form of these equations namely the primitive equations (see e.g. Holton [1979]). Such an approximation is necessary, for instance, as sound waves which have high phase speeds which would require the time step over which the model is iterated to be very small. The primitive equations exclude sound waves so the model time step can be lengthened.
Page 34 of 45
Figure 16. Volume mixing ratios of the main compounds of the Venusian atmosphere taken from the Venus International Reference Atmosphere (Keating et al., 1985) The top two frames are for daytime conditions with night-time below.
Page 35 of 45
Once one has the primitive equations it is necessary to discretize them onto a grid of points in the horizontal and vertical. This discretization may be done any number of ways (see e.g. Haltiner and Williams [1979]) but inevitably it introduces errors into the solution of the PDEs. Firstly the equations of motion have many conservation properties e.g. the conservation of angular momentum, of which only a few can be guaranteed by a given numerical formulation. In fact it is interesting to note that both the GCMs proposed for use in this study do have numerical schemes that conserve angular momentum and this has been shown by Hourdin [1989] to be very important when simulating the Martian atmosphere. This property should be still more important for simulating Venusian atmospheric super-rotation. Secondly, the limitations of computers require that solutions must be truncated in space and time, or in a spectral space for spectral models. Parameterizations Because the equations of motion are represented on a finite number of grid points there are a number of processes e.g. turbulent eddies generated near the surface, that are not explicitly resolved. However these processes can be important in providing an accurate simulation as there may be a significant transfer of heat or momentum from so-called sub-grid scale processes, into the resolved scales of the GCM. Also effects such as the heating and cooling of the atmosphere due to radiative processes must be accounted for. Representing such things in a GCM falls under the general heading of parameterization. Parameterization schemes are often based on empirical formulas or idealised models and simulations of the terrestrial atmosphere are often very sensitive to the `tuneable parameters' involved in such schemes. Application to planetary atmospheres Although developed originally for terrestrial meteorology, physics-based GCMs can be applied in principle to other planetary atmospheres, at least for the terrestrial planets (solid bodies surrounded by a thin atmosphere). The first GCM of the Martian atmosphere was developed in the late sixties, during the very early history of terrestrial GCMs. This pioneering work by Leovy and Mintz (1969) has been since followed by a number of other models developed around the world, which have confirmed the relevance of such tools for the Martian atmosphere. When adapting a terrestrial GCM to Mars, the formulation of the dynamical equations and the associated numerical formulations are essentially unchanged. The main effort needed is on the "parameterizations", in particular on radiative transfer. The conditions in which radiation is absorbed and emitted by the thin CO2 and dusty atmosphere of Mars can not be handled with exactly the same radiative codes as those developed for our wet and cloudy atmosphere. Most recent Martian GCMs such as the LMD-Oxford Model also include parameterizations of physical processes specific to the atmosphere of the red planet: CO2 condensation and sublimation, radiative impact of CO2 snow, dust- lifting and transport, and so on. GCMs now play a central role in the study of the Martian atmosphere and climate as they do on Earth. Past attempts to develop specific GCMs for Venus have been quite limited. The only full treatment published to date is that by Young and Pollack (1977). The main result of their model was the simulation of strong prograde equatorial winds compatible with the observed super-rotation of Venus. However, this super-rotation was obtained by including in the model an ad hoc parameterization accounting for equatorward transport of angular momentum by eddies. Similar efforts conducted at LMD in the early 80s concluded that super-rotation can be maintained and even reinforced without such a parameterization, but these remained unpublished (Tourte, 1984). Although no other GCM has been developed specifically for Venus, the ability of GCMs in general to simulate atmospheric super-rotation has been shown for idealized planetary Page 36 of 45
conditions (Hourdin et al., 1991, Del Genio et al., 1993) and for Titan (Hourdin et al. 1995). This question, crucial for the development of a new GCM for Venus, is detailed in the next section. We then discuss what would be the main work to be done on existing GCMs such as the LMD-Oxford Mars Model to develop a reliable model of the atmosphere of Venus, suitable for compiling a dedicated database. 7.3 SIMULATING ATMOSPHERIC SUPER-ROTATION WITH GCMS The dynamics of terrestrial atmospheres is driven primarily by latitudinally varying insolation. A classical view suggests that such a forcing should result in strong prograde winds in the middle or high latitudes as the consequence of poleward angular momentum transport by a thermally direct Hadley circulation. Those winds could be called super-rotating in the sense that, locally, the air rotates in the same direction but faster than the solid planet. However, the super-rotation of Venus (and probably Titan) is far from this picture. The atmosphere of Venus, at 70 km above the surface, rotates globally 60 times faster than the planet. For Titan, the mid stratosphere, near 250 km, probably rotates ten times faster than the surface. In both cases, even the air above the equator is strongly super-rotating. Such a super-rotation can not be explained by a simple axi-symmetric redistribution of angular momentum. In particular, equatorial super-rotation, requires the presence of non-axisymmetric eddy motions (Hide 1969, Held and Hou 1980, Rossow 1985). A number of mechanisms for producing such eddies have been proposed, including barotropic instability of the high_latitude jet produced by the Hadley cell (Gierasch 1975, Rossow and Williams 1979), solar semidiurnal thermal tides (cf. Fels and Lindzen 1974, Pechmann and Ingersoll 1984, Leovy 1987), transient or topographically forced planetary- or small-scale gravity waves (Leovy 1973, Hou and Farrell 1987, Gierasch 1987, Del Genio and Rossow 1990), and external torques (Gold and Soter 1971). GCMs predict the existence of high- latitude jets when run at slow rotation, but were for many years unsuccessful in generating equatorial super-rotation. As stated above, the GCM of Young and Pollack (1977) did produced strong equatorial winds, but in the presence of unrealistic momentum sources, due to a no n-conservative eddy diffusion parameterization. First attempts to produce super-rotation by running GCMs for slowly rotating planets have yielded weak or even subrotating zonal winds at the equator despite the presence of quasibarotropic eddies which transport momentum equatorward as required by the GieraschRossow-Williams scenario (Rossow 1983, Covey et al. 1986, Del Genio and Suozzo 1987). Since none of the latter group of models included a diurnal cycle, it was plausible to speculate that the missing transport by thermal tides is the crucial super-rotation mechanism. Williams (1988a,b) in fact achieves moderate equatorial super-rotation via diurnal forcing of a moist terrestrial GCM. This is appropriate for the upper Venus atmosphere, but much stronger than that experienced by the deep atmosphere. Consistent with this view, Hou et al. (1990), using a high resolution tidal model coupled to a zonally averaged circulation model, have demonstrated that tides act primarily within and above the cloud layer on Venus and can account for only about half of the observed super-rotation. Recent simulations of atmospheric super-rotation The first attempt to simulate super-rotation concentrated on the slow rotation of the solid planet. In fact, another condition seems to be quite important: the stability of the vertical temperature profile. Del Genio and Suozzo (1987) suggested that the failure of slowly rotating GCMs to super-rotate was a consequence of excessive vertical mixing by parameterized convection driven by statically unstable radiative equilibrium temperature profiles. Hourdin et al. (1992) first succeeded in producing super-rotation without any ad hoc forcing.
Page 37 of 45
They used a "parametric" version of the LMD GCM in which the description of the planet was reduced to a set of 20 parameters. Whereas this model was able to produce a reasonable Earth-like meteorology for terrestrial values of those parameters, a strong super-rotation was obtained with different values. In addition to the slow rotation rate, a key in this simulation was the use of a strong coefficient for the absorption of solar radiation which significantly enhanced the stability of the atmosphere. Del Genio et al (1993) obtained strong super-rotating regimes using a terrestrial general circulation model (GCM), simplified by removal of the hydrologic cycle, the diurnal cycle, and all seasonal and geographic variations, to study a suite of equilibrium simulations in which rotation rate, radiative heating profile, surface drag, and stratospheric drag are varied. The key to super-rotation in these experiments is the presence of an upper troposphere cloud which intercepts much of the incoming solar flux and produces a statically stable radiative equilibrium state in the lower and middle troposphere. The radiative heating profile limits the depth of boundary layer convection and detaches the upper level flow from the surface. The cloud-covered GCM produces equatorial winds in excess of 50/100 m sec- l with/without stratospheric drag. In these simulations, remova l of the cloud decreases static stability, increases vertical convective mixing, and almost completely eliminates equatorial superrotation. A significant super-rotation was also obtained more recently in a Titan GCM (Hourdin et al., 1995). Those simulatio ns are also characterized by the slow rotation rate of the planet and by the strong absorption of solar radiation by the orange haze within the atmosphere. So, an underestimation of vertical stability, resulting in an overestimation of turbulent mixing or convection seems to be the main reason for the failure in simulating super-rotation. Indeed, the convection mixes momentum downward where it is transferred to the solid planet by surface drag, and the adiabatic thermal structure prevents large vertical wind shears. The resulting weakly stable lapse rate inhibits the development of quasi-barotropic eddies. In slowly rotating terrestrial GCMs, the radiative state is dictated by the semi-transparency of Earth's atmosphere to sunlight, which is absorbed mostly at the surface. In the Venus GCM of Rossow (1983), the radiative equilibrium state was specified to be super-adiabatic in the lowest 20 km, according to prevailing opinion about the Venus thermal structure at that time. Pioneer Venus, Venera, and Vega probes have since shown, however, that the Venus atmosphere is statically stable above 5 km altitude except for isolated near-neutral layers at ~25-30 km and ~50-55 km (cf. Young et al. 1987). In all of the simulations mentioned here, super-rotation extends throughout most of the atmosphere (as it does on Venus). Hadley cell interaction with quasi-barotropic eddies which transport momentum equatorward is responsible for the excess angular momentum, in line with certain aspects of proposals by Gierasch (1975) and Rossow and Williams (1979) albeit with relatively modest Prandtl numbers. However, Limaye (1988a,b, 1990) has suggested, on the basis of analyses of the movement of UV cloud markings, that the observed eddy momentum transport, at the cloudtop level at least, may be in the opposite direction to that implied by the models. In all these simulations, topography was not included, and in all but the Titan simulation, the diurnal and seasonal cycles and all geographic variations were removed. Each of these may actually play an important role on Venus. What those simulations do show, is that without them, a strong super-rotation can be reached just by the Gierasch-Rossow-Williams mechanism. Nevertheless, the mechanisms responsible for the creation of super-rotation in the model have still to be confirmed by observations of Venus and of Titan. Another concern is that the GCM results could depend partly on the numerical approach employed. Del Genio et al. (1993) point out that an important feature of the GISS GCM is that Page 38 of 45
its stable numerical schemes permit the model to be run with no explicit horizontal or vertical diffusion. The Arakawa differencing techniques conserves global angular momentum to within about 0.0005% per day, or 1-10% over an entire integration of the model to equilibrium, with the numerics acting as a very weak momentum sink. This assures that any super-rotation which occurs is the result of explicitly resolved and/or parameterized physical processes. On the other hand, studies performed with the LMD GCM (Hourdin et al., 1992, 1995) did include a parameterized super-rotation, and showed that this parameterization is crucial. The numerical scheme for large scale dynamics is built so as to ensure the conservation of potential enstrophy (enstrophy is the square of absolute vorticity). This property controls the interaction between different scales in 2D or quasi 2D turbulence, and results in a cascade of enstrophy from the large scale where it is injected, to the small scales where it is dissipated by viscosity. Since this cascade is properly represented in the GCM, the cascade systematically produces an accumulation of enstrophy at the smallest resolved scale of the model. Dissipating this enstrophy at the mesh scale is both physically realistic and essential for the model stability. The LMD simulations showed that this parameterization was not dominant for equatorward angular momentum transport, which was essentially produced by explicitly resolved barotropic planetary waves. All together, those results suggest that GCMs are able to produce atmospheric super-rotation, following the Gierasch-Rossow-Williams mechanism, and that they will generally do so for slowly rotating planets with a stable enough atmosphere. 7.4 DEVELOPING A NEW GLOBAL CIRCULATION MODELS FOR VENUS This section describes possible steps in developing a new GCM specifically for Venus. Since simulations and models of the atmosphere of Venus are not yet available, this has to be quite speculative, and we suggest an incremental approach, with a progressive improvement of the GCM. General requirements Since the model is intended to produce useful information for future space missions, including landing and aero-assistance, it should probably cover the atmosphere from the surface up to about 140 km, as for the LMD-Oxford Mars GCM. The horizontal discretization will probably be imposed by the need to simulate atmospheric super-rotation by explicitly resolving the important eddies, without being too strongly affected by parameterized dissipation. Our experience suggests that a spatial resolution of 3 by 3 degrees, similar to that used currently for Mars, should be enough. The question of vertical resolution is probably more crucial since the entry profiles of the Venera probes suggest a layering of winds with a typical vertical length scale of order one km. It is difficult to postulate a priori if these small scale vertical structures must be accounted for in the GCM to obtain a realistic climate. Our experience however suggests that, if the grid is not fine enough to capture those modes, it could result in the excitation of spurious numerical modes at the grid-scale. This suggests that the model should use a rather fine vertical resolution of the order of 1 km or a number of layers of the order of one hundred. The model could start with a rather simple set of parameterizations for subgrid-scale motions, at least for turbulent mixing and dry convection. Such schemes are already included in the LMD-Oxford Mars GCM and can theoretically be reused without major changes. The main outstanding question is that of how to deal with the computation of radiative transfer; this will be central in the incremental approach we propose.
Page 39 of 45
Radiative transfer As explained earlier in this document, computing radiative transfer in the atmosphere of Venus is quite challenging. Conditions encountered vary from strong absorption in a very dense CO2 atmosphere to quasi conservative scattering by clouds at visible and near infrared wave- lengths. As on Mars, the upper atmosphe re requires special treatment to allow for nonLTE effects. Even line-by- line codes, generally accurate schemes which have been developed for the purpose of interpreting observations of the Earth’s atmosphere, must be used carefully under the novel conditions of high temperature and pressure on Venus. The latter have effects on the shape of individual spectral lines which are not well characterized at the present time. Perhaps the greatest problem lies in the derivation of a fast, numerically tractable code for a GCM in which radiative transfer can computed every few minutes if necessary, over a broad spectral range and for vertical profiles associated with each point of the horizontal grid. The rest of the discussion assumes that a line-by-line reference model exists for the atmosphere of Venus and concentrates on the problem of deriving a code fast enough for a GCM. The question of solar heating could be treated in a quite simple way as a first step. Indeed, if variations of obliquity, and atmospheric composition are neglected, the solar heating in the atmosphere only depends upon latitude and altitude. The thermal infrared is more difficult to handle since, because of the fundamental dependency of emission on atmospheric temperature, the computation can not be made a priori. The net exchange formulation, developed for the LMD-Oxford Martian GCM may be a good way of approaching this problem. The idea of this method is to reformulate radiative transfer in terms of net exchange of energy between pairs of model layers rather than in terms of radiative fluxes. It can be shown quite easily that, for small enough spectral intervals, and for two isothermal layers, the net power exchanged between layer i and j can be expressed formally as P i,j = X i,j ( B i - B j ) where B is the average Planck function on the spectral interval and X i,j is a coefficient which only depends upon the optical properties of the atmosphere. X i,j B i is that part of the power emitted by layer i which is absorbed by layer j. If both layers are at the same temperature, this power is exactly canceled by that emitted by j and absorbed by i. For two nearby layers, assuming that layers are isothermal introduces errors. However, a linear temperature profile can also be handled by the simple formula above. Because it ensures the conservation and reciprocity properties of radiative transfer are not violated it can be used safely to introduce approximations into the computations. In the case where there is a combination of absorption and scattering, as on Venus, the determination of coefficient X i,j as a function of optical path and spectral properties can be very complex. This net exchange formulation could lead to the following three steps in developing a radiative code for Venus. Step 1: If latitudinal and temporal variations of optical properties are neglected, the exchange coefficients X i,j could be estimated numerically from a series of computations performed with a line-by- line code on a reference temperature profile. For each computation, the source function would be set to zero in all layers except layer i. With such a source function, the lineby- line computation would directly produce the net power P i,j and hence optical coefficients X i,j. This approach requires N times M integrations of the line-by- line code where N is the number of layers retained for the GCM and M is the number of spectral intervals used (typically of the order of a few hundreds).
Page 40 of 45
Although very demanding, this computation can be done once for all. Exchange coefficients are then stored and reused during the GCM simulation in each point of the horizontal grid. The method is straightforward and has already been tested for Venus a few years ago at LMD. Rerunning and assessing this work will represent an important part of the development of a new Venus GCM. Step 2: In step 1, the vertical pressure grid must be the same in the line-by- line code and in the GCM. In particular, it is directly applicable only to a billiard-ball Venus. The inclusion of orography, which results in a varying pressure discretization depending on the location on the surface of the planet, would require that we are able to interpolate the exchange coefficient from one vertical grid to another. This step has not been adequately tested yet. The solar heating can also be computed once and for all. Provided it is done as a function of longitude, latitude and altitude. Step 3: The last step would be to be able to account for possible variations of the cloud cover or atmospheric composition. This requires the means to be able to compute on- line, in the GCM, the dependency of the exchange coefficients upon the atmospheric composition. There are probably two main directions to develop such a model. The first one consists of extracting the required information from additional integrations of the line-by- line model. For instance, the sensitivity of the exchange coefficient to the cloud opacity could be stored as well and used in the GCM simulation. The second way would consists in developing a fast, approximate radiative transfer code, based for instance on kdistribution methods, which could be used regularly in the GCM to update the exchange coefficient, with a periodicity depending upon the time-scale of the physical processes which modify the atmospheric composition and optical properties. The choice between approaches will require a detailed analysis of these processes, which include cloud micro-physics and possibly chemistry. These may have to be included in the model as well. This step would also require some work on the part of the code that deals with visible wavelengths. This description in three steps mainly concerns the part of the atmosphere where LTE is valid. The non-LTE part will have to be treated in a different way. However, the treatment of nonLTE for the Martian atmosphere has much in common with that required for Venus. The recent comprehensive study by Roldan et al. (2000) will be useful to guide our work and that we anticipate that an adaptation from the Martian parameterizations to the Venus case should not introduce any special difficulties. 8 A VENUS CLIMATE DATABASE The EuroMars consortium has gained considerable experience during the development of the Mars Climate Database (Lewis et al. 1999) in summarizing GCM output and making it available to the wider community. Novel techniques have been derived to represent the variability which is inevitably lost in a statistical representation of GCM output and to add variability on scales smaller than the GCM is able to represent explicitly, e.g. internal gravity waves. Once a realistic Venus GCM has been developed, we plan to apply the same methodology to produce a Venus Climate Database based directly on its output. The Venus database will follow the structure of the MCD, although it may be unnecessary to provide the same sort of interannual variability (dust scenarios) that was necessary for Mars. This will have to be assessed once experience is gained with a Venus GCM. The small obliquity of Venus also means that the division of the database into 12 seasons, as was done for Mars, may also be unnecessary. Both of these factors will allow the resulting database to be fitted into a much smaller amount of disk space. On the other hand, local solar time of day is clearly an important factor in the Venusian atmosphere and it may well prove desirable to store fields at more local times of day (12 were Page 41 of 45
used for Mars; this may be at least doubled for Venus). The thick atmosphere is also likely to mean that the GCMs will be run with more vertical levels and this should be reflected in the database structure. The net effect of these changes may be to produce a database of comparable size, with the mean and variance of atmospheric fields stored as functions of longitude, latitude, height and local time of day. Different levels of solar activity may also have to be considered for the upper atmosphere. The large-scale (empirical orthogonal function) and small-scale (gravity wave) variability models are equally applicable to Venus, with the observational evidence (summarized earlier) indicating the presence of both small- and planetary-scale waves. The 2D EOF model, as used in the MCD versions 2 and above, can be retained to represent the large-scale variability in the Venus GCM, with EOFs calculated from frequent model output to capture as much of the variance as possible. Small-scale gravity wave motions are also likely to be of great importance, and the scheme used for Mars will have to be re-calibrated for Venus. 9 CONCLUSIONS This document summarises most of current knowledge concerning the surface and atmospheric environment of Venus. In the next stage of the project we will produce a numerical model of the Venusian atmosphere which draws on this information to produce a realistic simulation of the atmosphere, and we will use this model to produce a database of statistics of the atmosphere. Please see the model and database user and software requirement documents for more information. 10 REFERENCES Allen, D. and Crawford, J. Discovery of cloud structure on the dark side of Venus. Nature, 307, 222-224 (1984). Allison, M., and L. D. Travis 1986. Astronomical, physical, and meteorological parameters for planetary atmospheres. In The Jovian Atmospheres (M. Allison and L. D. Travis, Eds.), pp. 293-319. NASA CP-2441, Washington, DC. Allison, M., and A. D. Del Genio 1992. A zero potential vorticity model for the zonal- mean circulation of the Venus/Titan atmospheres. J. Atmos. Sci., in press. Arakawa, A. 1972. Design of the UCLA general circulation model. Tech. Rep. No. 7, Dept. Meteor., University of California, Los Angeles. Avduevskiy, V.S., et al. Structure and Parameters of the Venus Atmosphere According to Venera Probe Data. In Venus (eds Hunten, D.M., Colin, L., Donahue, T.M. and Moroz, V.I.) 280-298, (1983). Bougher, S.W., M.J. Alexander and H.G. Mayr. Upper atmosphere dynamics: Global circulation and gravity waves. In 'Venus II' (eds. Bougher, S.W., D.M. Hunten, R.J. Phillips), University of Arizona Press, Tucson, 259-291, (1997). Carlson, R.W., K.H. Baines, Th. Encrenaz, F.W. Taylor, P.Drossart, L.W. Kamp, J.B. Pollack, E.Lellouch, A.D. Collard, S.B. Calcutt, D.Grinspoon, P.R. Weissman, W.D. Smythe, A.C. Ocampo, G.E. Danielson, F.P. Fanale, T.V. Johnson, H.H. Kieffer, Matson, D. L., McCord, T.B., and L.A. Soderblom. Galileo infrared imaging spectroscopy measurements at Venus. Science, 253:1541 -1548, (1991). Carlson, R.W, Kamp L., Baines, K., Pollack, J.B., Grinspoon, D., Encrenaz, Th., Drossart, P., and Taylor, F.W. Distinct Venus Cloud types as Observed by the Galileo Near Infrared Mapping Spectrometer. Planetary and Space Science, 41, 7, 477-486 (1993).
Page 42 of 45
Collard, A.D., Taylor, F.W., Calcutt S.B., Carlson, R.W., Kamp L., Baines, K., Encrenaz, Th., Drossart, P., Lellouch, E., and Bézard , B. Latitudinal distribution of carbon monoxide in the deep atmosphere of Venus. Planetary and Space Science, 41, 7, 487 - 494, (1993). Covey, C., E. J. Pitcher, And J. P. Brown 1986. General circulation model simulations of super-rotation in slowly rotating atmospheres: Implications for Venus. Icarus 66, 380-396. Del Genio, A. D., and W. B. Rossow 1982. Temporal variability of ultraviolet cloud features in the Venus stratosphere. Icarus 51, 391-415. Del Genio, A. D., and R. J. Suozzo 1987. A comparative stud y of rapidly and slowly rotating dynamical regimes in a terrestrial general circulation model. J. Atmos. Sci. 44, 973-986. Del Genio, A. D., and W. B. Rossow 1990. Planetary-scale waves and the cyclic nature of cloud top dynamics on Venus. J. Atmos. Sci. 47, 293-318. Dickinson, R.E., 1972. Infrared heating and colling in the Venusian Mesopshere. J. Atmos. Sci., 29, 1531. Dickinson, R.E., 1976. Infrared radiative Heating and Cooling in the Venusian Mesosphere. J. Atmos. Sci., 33, 290. Fels, S. B. and R. S. Lindzen 1974. The interaction of thermally excited gravity waves with mean flows. Geophys. Fluid Dyn. 6, 149-191. Gierasch, P. J. 1975. Meridional circulation and the maintenance of the Venus atmospheric rotation. J. Atmos. Sci. 32, 1038-1044. Gierasch, P. J. 1987. Waves in the atmosphere of Venus. Nature 328, 510-512. Gold, T. and S. Soter 1971. Atmospheric tides and the 4-day circulation on Venus. Icarus 14, 16-20. Hansen, J., G. Russell, D. Rind, P. Stone, A. Lacis. S. Lebedeff, R. Ruedy and L. Travis, 1983. Efficient three-dimensional global models for climate studies: Models I and 11. Mon. Weather Rev. III, 609-662. Hedin, A. E., H. B. Niemann, W. T. Kasprzak, and A. Seiff, Global empirical model of the Venus thermosphere, J. Geophys. Res., 88, 73-83, 1983. Held, I. M. and A. Y. Hou 1980. Non- linear axially symmetric circulations in a nearly inviscid atmosphere. J. Atmos. Sci. 37, 515-533. Hide R. 1969. Dynamics of the atmospheres of the major planets with an appendix on the viscous boundary layer at the rigid bounding surface of an electrically-conducting rotating fluid in the presence of a magnetic field. J. Atmos. Sci. 26, 841-853. Hou A. Y. and B. F. Farrell 1987. Super-rotation induced by critical level absorption of gravity waves on Venus: An assessment. J. Atmos. Sci. 44, 1049 1061. Hou, A. Y., S. B. Fels, and R. M. Goody 1990. Zonal super-rotation above Venus' cloud base induced by the semidiurnal tide and the mean meridional circulation. J. Atmos. Sci. 47, 1894 1901. Houghton, J. T. 1977. The Physics of Atmospheres. Cambridge Univ. Press Cambridge. Hourdin F., P. Le Van, O. Talagrand, R. Courtin, D. Gautier, and C. P. Mckay 1992. Numerical simulation of the circulation of the atmosphere of Titan. In Titan (B. Kaldeich Ed.) pp. 101-106. ESA SP-338. Noordwijk. Janssen, M.A., Hills, R.E., Thornton, D.D., and Welch, W.J., 1993. Venus: new microwave measurements show no atmospheric water vapor. Science, 179, 994-997. Kamp, L.W., Taylor, F.W., and Calcutt, S.B., 1988. Structure of Venus' atmosphere from modelling of night side infrared spectra. Nature, 336, 360-362.
Page 43 of 45
Kamp, L.W. and F.W. Taylor, 1990. Radiative transfer models of the night side of Venus. Icarus, 86, 510 -529. Heating, G. M. et al., 1985. In Venus International Reference Atmosphere, eds. A.J. Kliore, V.I. Moroz, and G.M. Keating, Pergamon Press, New York. Kuo H.-L. 1978. A two- layer model study of the combined barotropic and baroclinic instability in the tropics. J. Atmos. Sci. 35, 1840-1860. Leovy C. B. 1973. Rotation of the upper atmosphere of Venus. J. Atmos . Sci. 30, 12181220. Leovy, C. B. 1987. Zonal winds near Venus' cloud top level: An analytic model of the equatorial wind. Icarus 69, 193-201. Lewis S. R., M. Collins, P. L. Read, F. Forget, F. Hourdin, R. Fournier, C. Ho urdin, O. Talagrand and J.-P. Huot (1999) Journal of Geophysical Research, Vol. 104, No. E10, 24,177-24,194. Limaye, S.S., 1990. Venus atmospheric circulation: Known and unknown. Advances in Space Research, 10(5), 91-101. Limaye, S.S., 1988. Venus: Cloud level circulation during 1982 as determined from Pioneer cloud photopolarimeter images. II. Solar longitude dependent circulation. Icarus, 73, 212-226. Limaye, S.S. , 1988. C. Grassotti, and M.J. Kuetemeyer, Venus: Cloud level circulation during 1982 as determined from Pioneer cloud photopolarimeter images. I. Time and zonally averaged circulation. Icarus, 73, 193-211. Lopez-Puertas, M. and M. A. Lopez-Valverde, 1995. Radiative energy balance of CO2 nonLTE infrared emissions in the Martian atmosphere. Icarus, 114, 113-129. Mayr, H. G., and I. Harris 1983. Quasi-axisymmetric circulation and super-rotation in planetary atmospheres. Astron. Astrophys. 121, 124-136. Moroz, V.I., 1983. Summary of the Preliminary results of the Venera 13 and 14 Missions. In Venus (eds Hunten, D.M., Colin, L., Donahue, T.M. and Moroz, V.I.) 45-68. Pechmann, J. B., and A. P. Ingersoll, 1984. Thermal tides in the atmosphere of Venus: Comparison of model results with observations. J. Atmos. Sci. 41, 3290-3313. Pettengill, G.G., Ford, P.G., and Wilt, R.J. Venus surface radiothermal emission as observed by Magellan. J. Geophys. Res., 97, 13091-13102, (1992). Pollack, J. B., and R. Young, 1975. Calculations of the radiative and dynamical state of the Venus atmosphere. J. Atmos. Sci. 32, 1025-1037. Roldan, C., M. A. Lopez-Valverde, M. Lopez-Puertas and D. P. Edwards, 2000. Non-LTE infrared emissions of CO2 in the atmosphere of Venus. Icarus, 147, 11-25. Rossow, W. B. 1983. A general circulation model of a Venus- like atmosphere. J. Atmos. Sci. 40, 273302. Rossow, W. B. 1985. Atmospheric circulation of Venus. Adv. Geophys. 28A, 347-379. Rossow, W. B., AND G. P. Williams 1979. Large-scale motion in the Venus stratosphere. J. Atmos. Sci. 36, 377-389. Rossow, W. B., A. D. Del Genio, and T. Eichler, 1990. Cloud tracked winds from Pioneer Venus OCPP images. J. Atmos. Sci. 47, 2053-2084. Schofield, J.T. and Taylor, F.W., 1983. Measurements of the mean solar- fixed temperature and cloud structure of the middle atmosphere of Venus. Quarterly Journa l of the Royal Meteorological Society, 109, 57-80.
Page 44 of 45
Stone, P. H. 1974. The structure and circulation of the deep Venus atmosphere. J. Atmos. Sci. 31, 1681-1690. Taylor, F.W. The Venusian Polar Dipole. In 'Middle Atmosphere of Venus', ed. K. Schaeffer and D Spankuch, Veroffentlichungen des Forchungsberichs Geo- und Kosmoswischenschaften, Academie-Verlag Berlin.18, 93-97, 1990. Taylor, F.W., 1992. Remote Sensing of Venus' Atmospheric Dynamics. Adv. Space Research, 12, (9)57 - (9)71. Taylor, F.W. Carbon Monoxide In The Deep Atmosphere Of Venus. Adv. Space Res., 16, 6, 81-88, 1995. Taylor, F.W., D. Crisp, and B. Bézard, 1996. Near-Infrared Sounding of the Lower Atmosphere of Venus. In Venus 2, University of Arizona Press, Tucson, AZ. Tomasko, M. G., L. R Doose, P. H. Smith, and A. P. Odell 1980. Measurements Of The flux of sunlight in the atmosphere of Venus. J. Geophys. Res. 85, 8167-8186. Wattson, R.B., and L.S. Rothman, 1993. Direct Numerical Diagonalization: Wave of the Future. J.Q.S.R.T., 48, 763-780. Williams, G. P. 1988a. The dynamical range of global circulations—1. Climate Dyn. 2, 205260. Williams, G. P. 1 988b. The dynamical range of global circulations—II. Climate Dyn. 3, 4584. Young, R. E., and J. B. Pollack 1977. A Three-Dimensional Model Of Dynamical processes in the Venus atmosphere. J. Atmos. Sci. 34, 1315-1351. Young, R. E., R.L. Walterscheid, G. Schubert, A. Seiff, V M. Linkin, and A. N. Lipatov 1987. Characteristics Of Gravity Waves Generated By Surface Topography On Venus: Comparison with the VEGA balloon results. J. Atmos. Sci. 44, 2628-2639.
Page 45 of 45